.jpg)
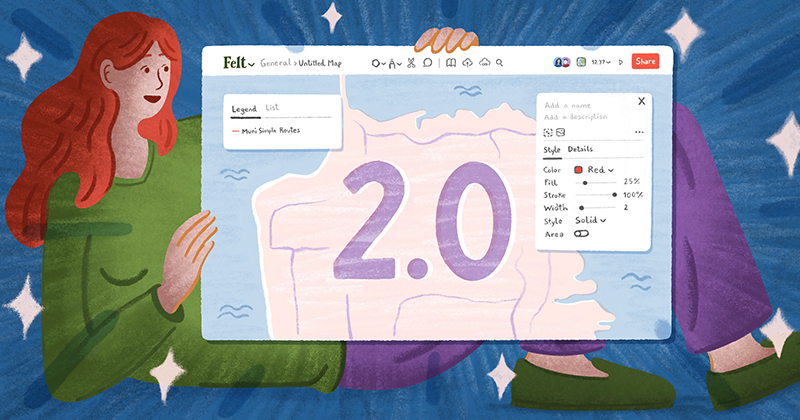
Today, we are putting incredibly powerful data editing tools in the hands of our customers. None of this would be possible without a key piece of open source mapping software called Tippecanoe. Tippecanoe is the only tool in its category: a geodata pre-processing library to optimize for great visual appearance across data densities and zoom levels and deliver fast maps via tiles.
Tippecanoe is a prominent example of Felt’s reliance on and support for open source software, alongside the cloud-optimized data format PMTiles and the rendering library Protomaps. These projects are not just core to Felt, they are also critical for their respective open source communities of users. Tippecanoe is so important to our work that we’re reviving development at felt/tippecanoe on Github. We are proud to announce that Erica Fischer, who originally authored Tippecanoe at Mapbox, has joined the Felt team. Enjoy our interview with Erica to understand how the software has changed over time and what to expect next!
What is the origin story of your open source project, Tippecanoe?
Tippecanoe grew out some work I was doing in data visualization. I had been making maps of big datasets to understand the patterns that showed up in them when you looked at them in aggregate — like every location that a tourist posted a photo from, or every location where a taxi picked up a passenger — any sort of slice-of-life geodata I could get my hands on.
I started off doing this with raster images, generating PDFs and rendering images from that, and then once I joined Mapbox, I moved into web maps, not just static images, with some custom-written tools. I had something called datamaps that ingested a list of points, with a color for each one, and let you view it with some zoom level sensitivity so when you were zoomed out, it had that earth-from-space look to it.

This is was all bitmap, and the problem with bitmap was that it is just a picture of the data rather than the data itself, so you have to make a new map if you want to look at a different aspect of it. I started moving into the vector maps world along with the rest of the company, where you can bring much more of the original data down to the client side, but the problem with the existing tools was that everything was meant for much smaller datasets than I was working with. There was an expectation, for example, that you would have one feature for each street, not one feature for every location where a taxi had ever stopped on each street.
There was a problem both on the data ingestion side and the data rendering side. If you tried to ingest a data file with 200 million points into an application on your laptop, it would crash because it runs out of memory. I needed something that could take in data in a streaming way so I could work with data sets bigger than would fit in memory.
I also needed something that could make the zoomed out views look good without having to know anything about the data other than the locations, which was hard to do in existing rendering tools. The existing tools were meant more for cartography than for data visualization, and worked on the assumption that all of your data would be tagged somehow. For example, if you’re styling a zoom level where you can see the entire country, normally all the features would be tagged so you can exclude the local streets and the city parks and subway lines and only keep in the major national parks and highways and city names.
But I was working with untagged data. I needed something that would thin out data at the low zooms just based on the position of features and their relationship to one another, without knowing anything about what they signify. For example, working with global photo data, I only knew the locations where someone took a photo. I had no idea which were locally relevant versus globally relevant. Tippecanoe was born out of my need for a solution to this problem.
How would you describe what Tippecanoe does?
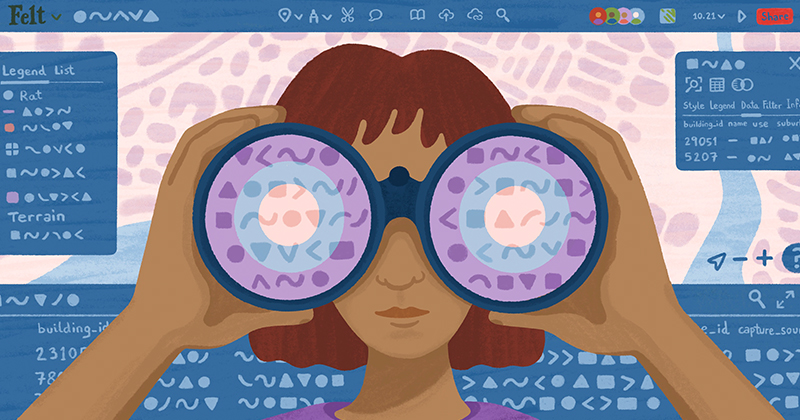
Tippecanoe is basically a converter from one file geographic format (GeoJSON) to another (vector map tiles), but one with a specific aesthetic intent. Its goal is to enable making a scale-independent view of your data, so that at any level from the entire world to a single building, you can still see the density and texture of the data rather than having to generate clusters or manually exclude certain classes of data.
If you give it all of OpenStreetMap and zoom out, it should give you back something that looks like Ben Fry’s "All Streets" project rather than something that looks like an Interstate road atlas.

Why do you think Tippecanoe became so widely adopted?
Some combination of being useful, available, and adaptable. It certainly also helped that I had made a new year’s resolution to stop making up my own single-purpose flat-file formats for tools and to put in the extra effort to accept and generate GeoJSON in whatever I did next. It’s not necessary the perfect geospatial file format for every application, but it makes it straightforward to connect Tippecanoe to other data pipelines. People wouldn’t have used it if there was an awkward conversion step required to use it.
Were you surprised by the wide adoption by the public and companies alike?
Yes. I wrote Tippecanoe essentially for my own use, and was not starting from the assumption that it solved a problem that had a big user base. There’s always the hope that what you make will be useful to other people, but it became an open source tool used by the public almost as an afterthought.
It’s always a pleasant surprise to find out that someone has come to rely on something you made. It was wonderful that it was useful for other people at Mapbox, and for Mapbox’s customers, and for other people and companies making their own mapping stacks, and it is wonderful that it has become important enough to Felt that I can continue my work on it, because there is lots more to be done.
It has repeatedly surprised me how far other people have pushed its limits. For example, when Jennings Anderson used it to map the entire history of OpenStreetMap, he collected every version of every feature in OSM, with full attributes, and used Tippecanoe to tile all that together, which was a way larger dataset than I had ever tried myself, and it held up much better than I had imagined it would. I thought I had done some big data things, but a world base map in all of its versions was way beyond what I had tried.
What advice do you have for first-time users?
My main tip is: please don’t read about all the options and try to use them all. A lot of the options are for special cases that most people probably don’t have. I would urge everyone to start with using ‘guess the zoom level automatically’ and ‘drop densest as needed’ to thin down your tiles if they get too big. If you try to use all the other features, it’s easy to accidentally make your map worse rather than better.
You have worked on many open source projects. What got you started down this path?
I think that in part it comes from the moment in time when I got involved in computers. There was a historical moment in the early ‘80s when computers had become cheap enough to have them at home, but commercial software was tightly controlled by the manufacturers. If you were just a regular person, there wasn’t an app store to order stuff from, but there were racks of magazines that were full of programs you could type in at home, and you could dream that if you wrote something good yourself, you could send it to a magazine for other people to use. I grew up with the idea that computer programs were something that you can make and share. It’s very satisfying to release something and have people use it.
What are you looking forward to tackling now that you’re back working on Tippecanoe at Felt?
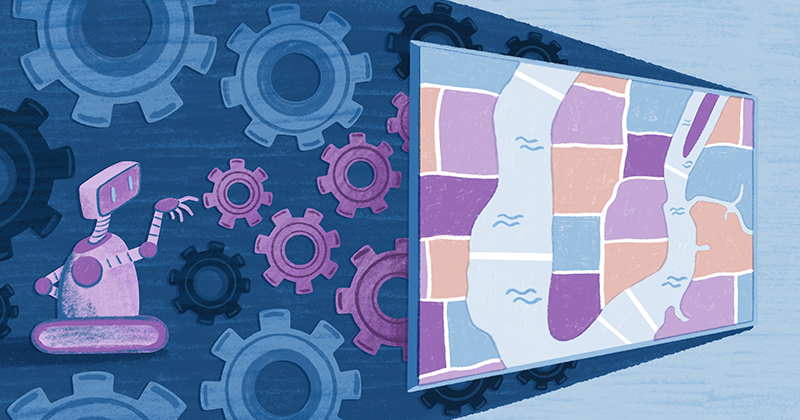
The special challenge of Tippecanoe at Felt is that it is being applied to user uploads with no opportunity for manual configuration, so it has to be able to make efficient, faithful, good-looking tiles without being given any hints about what kind of data it is tiling. I already know that it doesn’t currently do very well at low zoom levels with topographic contours, or with gridded data represented as individual polygons, or with continuous urban parcel polygons, or with branching systems of rivers, and I’m sure the uploads will also soon reveal other usage patterns that need to be detected and given some special treatment.
Where to Find Tippecanoe
To see what Erica is up to with Tippecanoe, visit github.com/felt/tippecanoe.