Skip to content
LAT37.8044° NLON122.2711° WX-13611157 mY4551831 mE564166 mN4184363 mE6050014 ftN2120204 ftBRG041.0°041.0°040.6°042.1°ZOOM11.0CRS
← Gallery
Planning

OSM Pedestrian Density Visualization

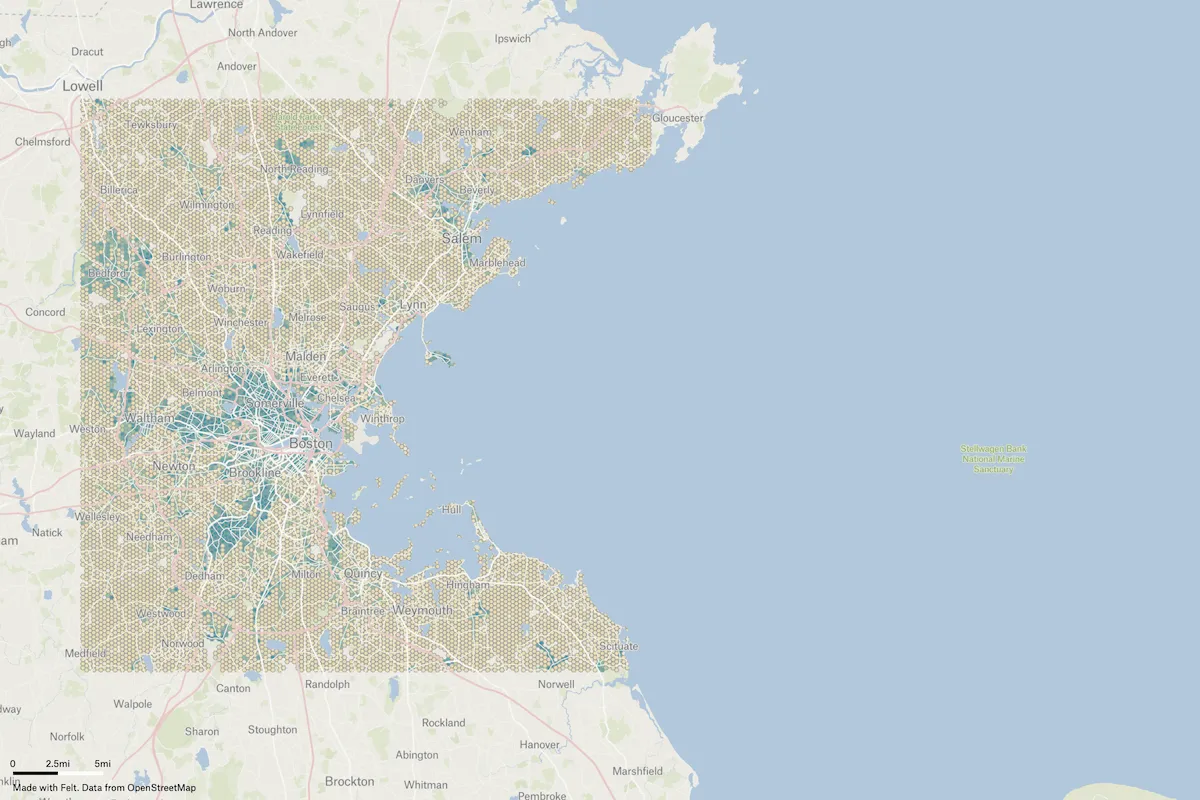
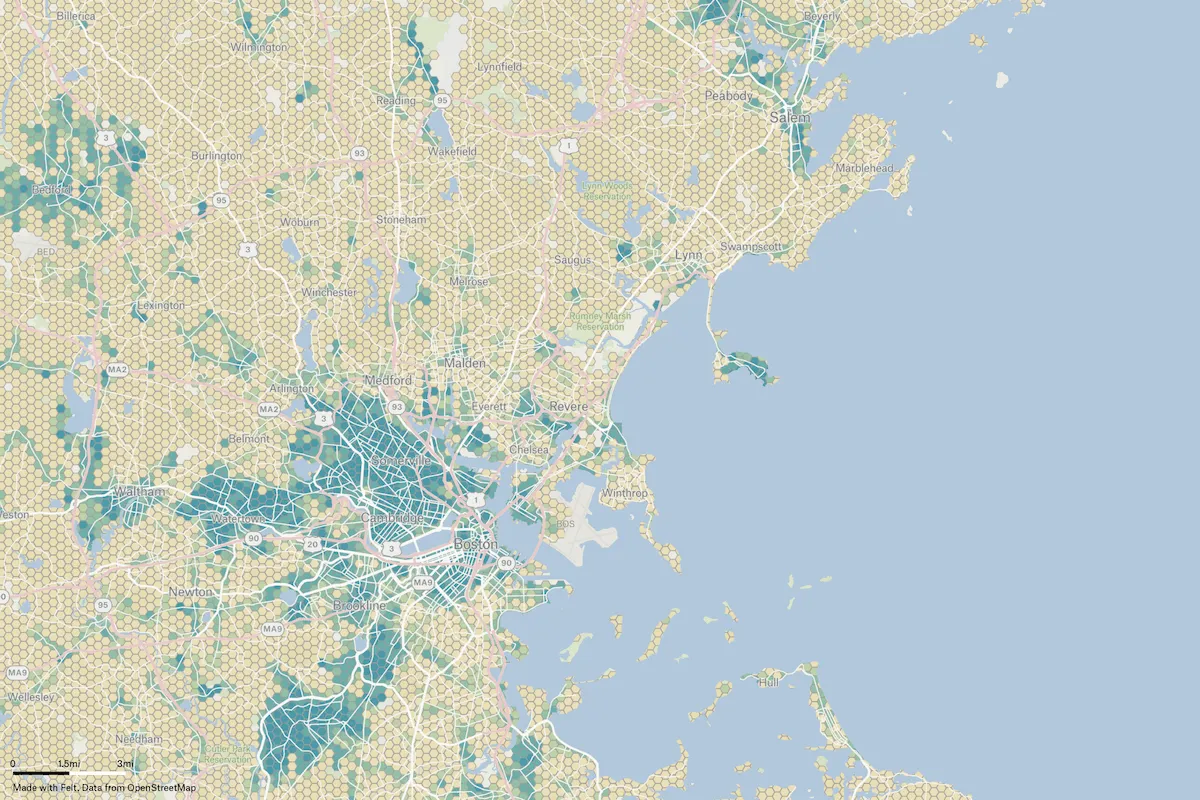
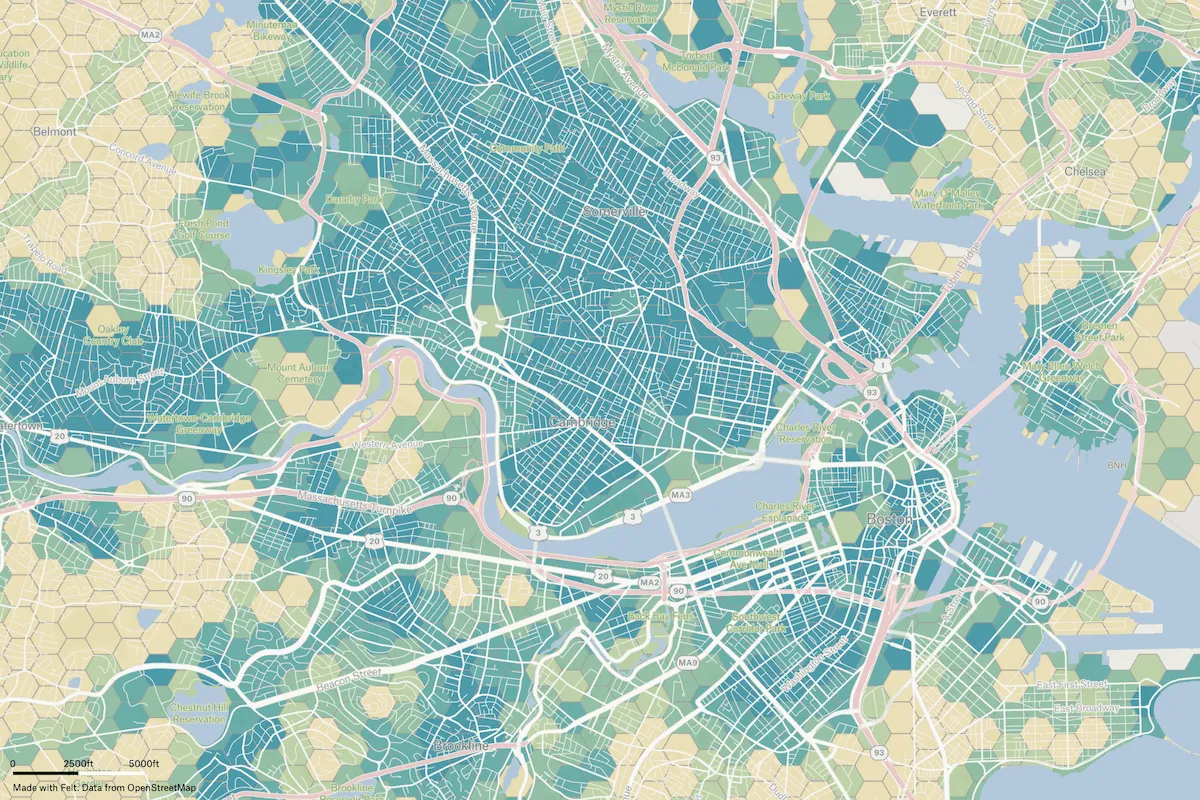
This project showcases an innovative approach to visualizing pedestrian mapping quality in OpenStreetMap (OSM) data using QGIS and Felt. The creator Martijn Van Exel developed a method to calculate a "quality index" based on the ratio of pedestrian infrastructure to total road network length, displayed in visually appealing hexagonal grids. By leveraging open-source tools and Felt’s user-friendly platform, the project demonstrates how complex spatial analysis can be transformed into interactive, easily shareable maps for urban planning and pedestrian infrastructure assessment.
Preview of OSM Pedestrian Density Visualization, an interactive Felt mapExplore this interactive map →
OSM Pedestrian Density VisualizationOpen in Felt →
CartographerMartijn Van ExelCategoryPlanning

This project showcases an innovative approach to visualizing pedestrian mapping quality in OpenStreetMap (OSM) data using QGIS and Felt. The creator Martijn Van Exel developed a method to calculate a "quality index" based on the ratio of pedestrian infrastructure to total road network length, displayed in visually appealing hexagonal grids. By leveraging open-source tools and Felt’s user-friendly platform, the project demonstrates how complex spatial analysis can be transformed into interactive, easily shareable maps for urban planning and pedestrian infrastructure assessment.

More views

Try Felt

Bring your data, see it on the map

Connect a database or drop in a file and see your data live on a map in minutes.