Know where your portfolio is exposed
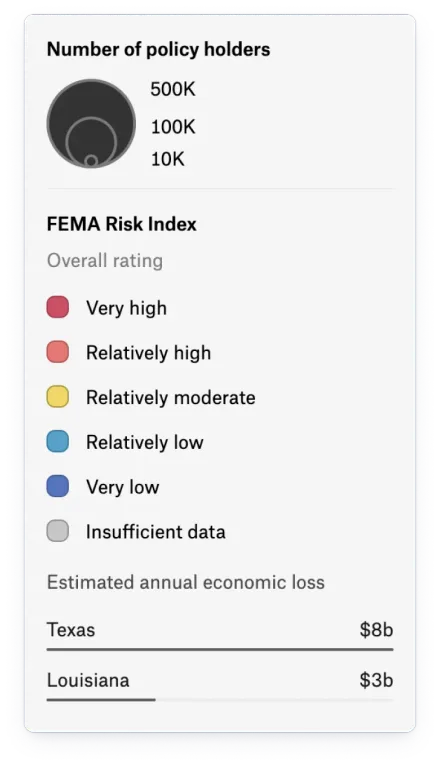
See which properties face flood, wildfire, and other hazards. Bring your portfolio and risk data together in Felt so underwriting and claims teams can assess exposure and act on the same picture.
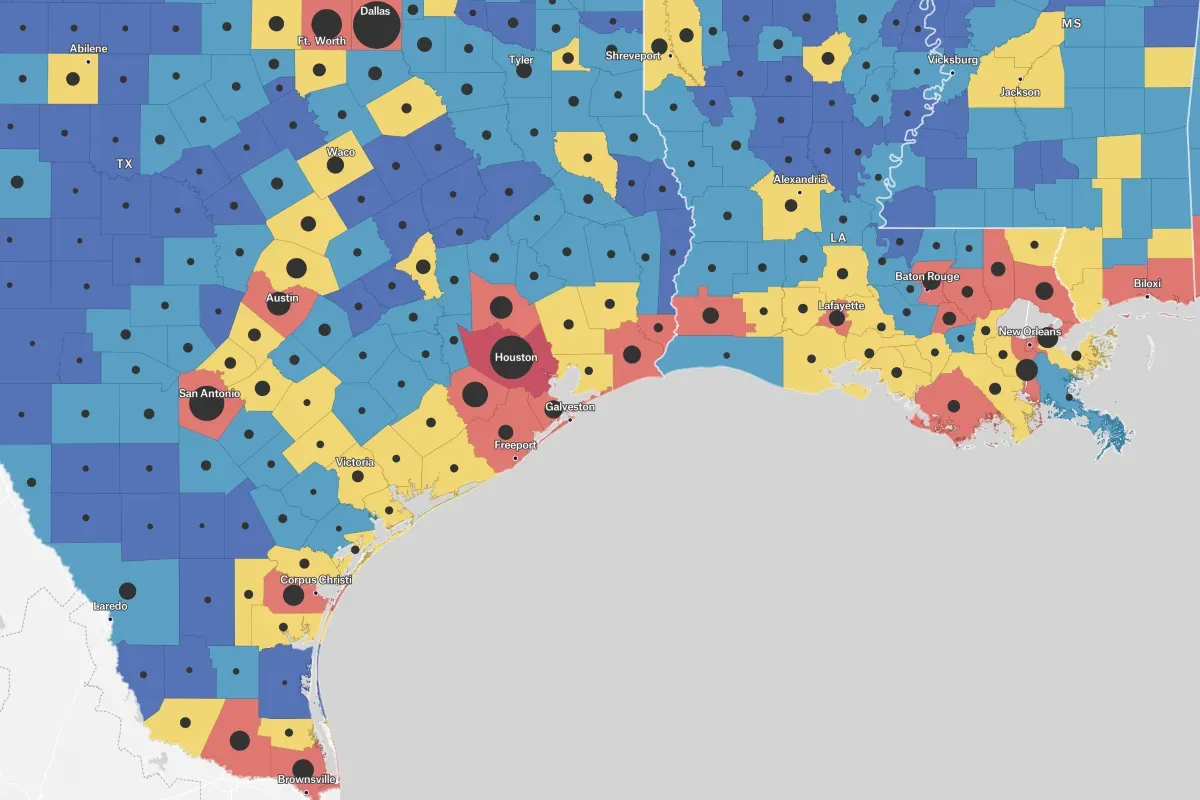






A clearer view of risk. A faster path to action.
Connect policies, claims, and hazard data from files, Snowflake, or Databricks. Give underwriting and claims teams one place to assess risk and coordinate their response.
Make exposure clear at every location
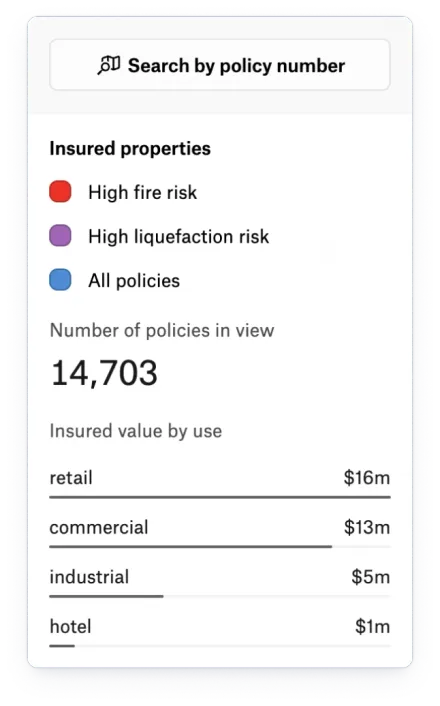
Identify exposed properties and compare risk across your portfolio. Overlay hazard footprints and add values such as flood depth to each insured location, without writing code.
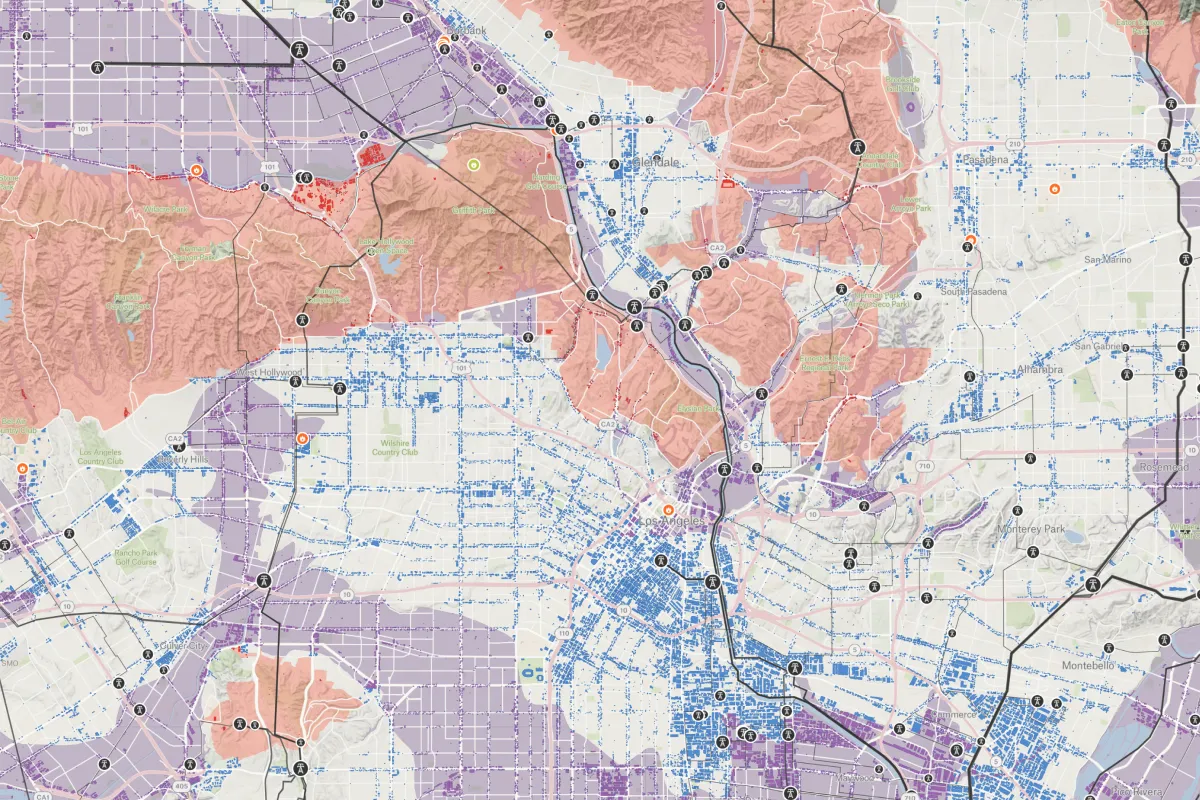
Give claims teams the full picture
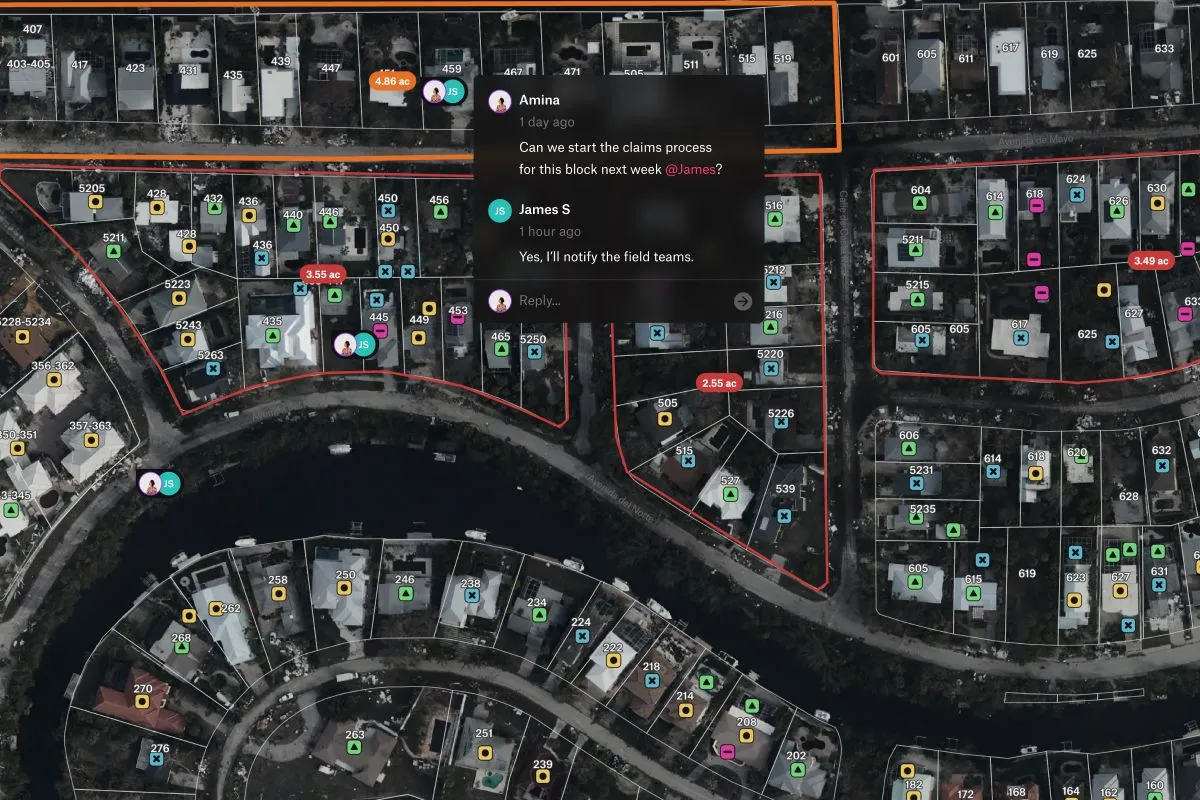
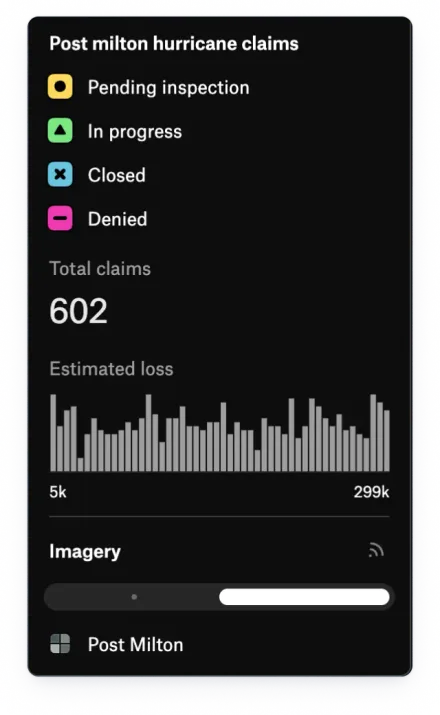
Give reviewers the property, damage imagery, and claim status in one place. Shared dashboards and comments keep teams aligned as they work through claims by area and priority.
Put risk insight into every review
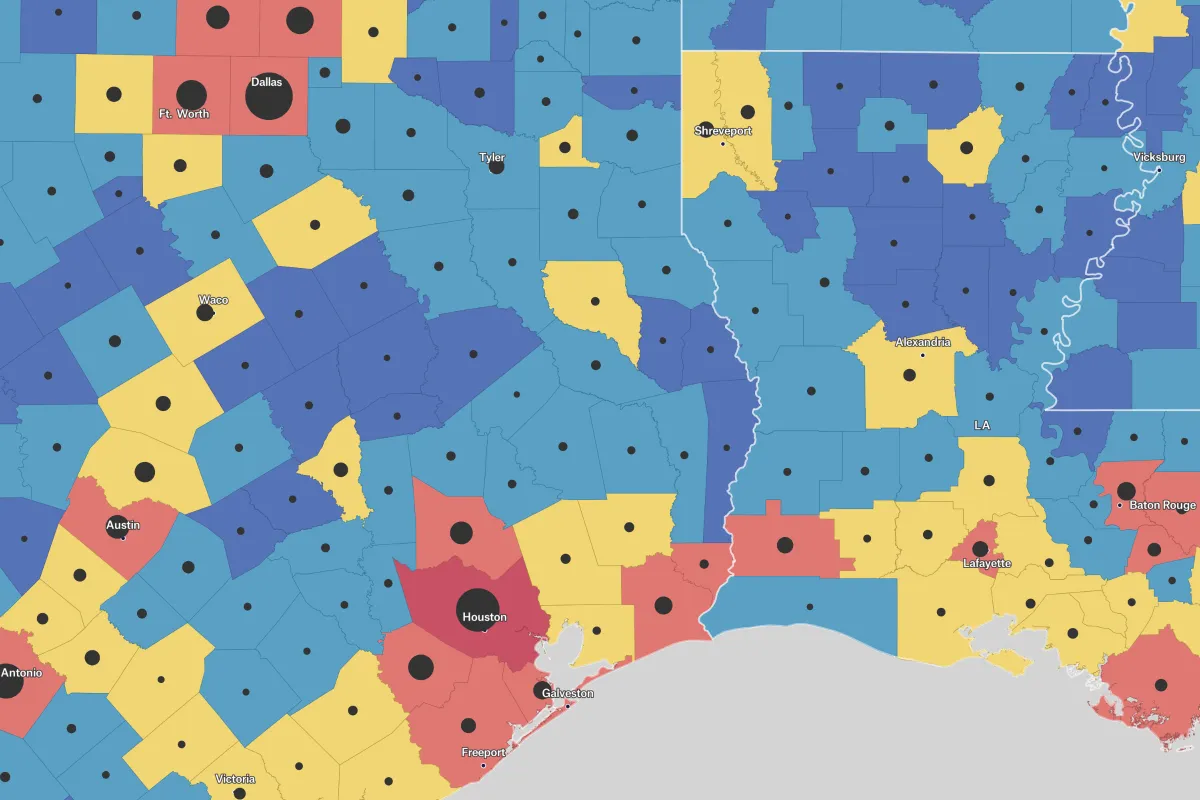
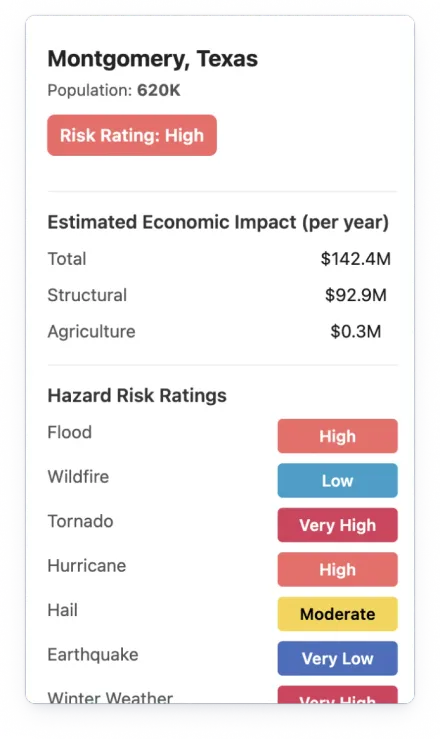
Give underwriters a shared view of policies and hazards, refreshed from your warehouse on a schedule. Use the REST API to bring those maps into the risk reports your team already relies on.
See what teams achieve with Felt

Felt allows us to have really productive dialogue remotely.

Once we discovered what we could do with Felt, we implemented it immediately.

I find Felt the quickest and easiest way to have planners and analysts visualize data.

Common questions
- 01Can Felt add flood depth values to our insured locations?
Yes. Felt adds raster hazard values such as flood depth to every insured location as attributes, with no code. Underwriters can then sort and filter the portfolio by exposure.
- 02Can Felt show which properties fall inside a flood zone?
Yes. Overlay a flood zone or wildfire footprint on your portfolio and Felt lists the properties inside, with attributes from both layers, and counts them per zone. The Global Library includes riverine and coastal flood risk layers.
- 03How large a raster file can Felt handle?
Upload hazard grids and orthomosaics as GeoTIFFs up to 100 GB per file. For larger collections, stream rasters from your cloud bucket or STAC catalog with no file size limit and no processing usage.
- 04How many policies can a Felt map handle?
Felt has no cap on features per layer or layers per map, so you can assess exposure across your portfolio. Connect your database to refresh policy data on a schedule.
- 05Can we add Felt maps to automated property risk reports?
Yes. Use the Felt REST API to create maps, refresh data, and export map images for property reports. For interactive reports, embed maps and customize them with the JavaScript SDK.
Bring your data, see it on the map
Connect a database or drop in a file and see your data live on a map in minutes.