Felt’s powerful mapping platform makes it easy to build maps, apps, and dashboards for climate mapping with exceptional speed and simplicity, helping teams analyze climate change impacts like wildfire, drought, heat, sea level rise, and coastal risk using climate models and spatial data, so they can focus on climate resilience and informed assessment rather than implementation.


Specifically designed to address the unique challenges of the climate sector

Make your source-of-truth accessible to those who rely on it daily.


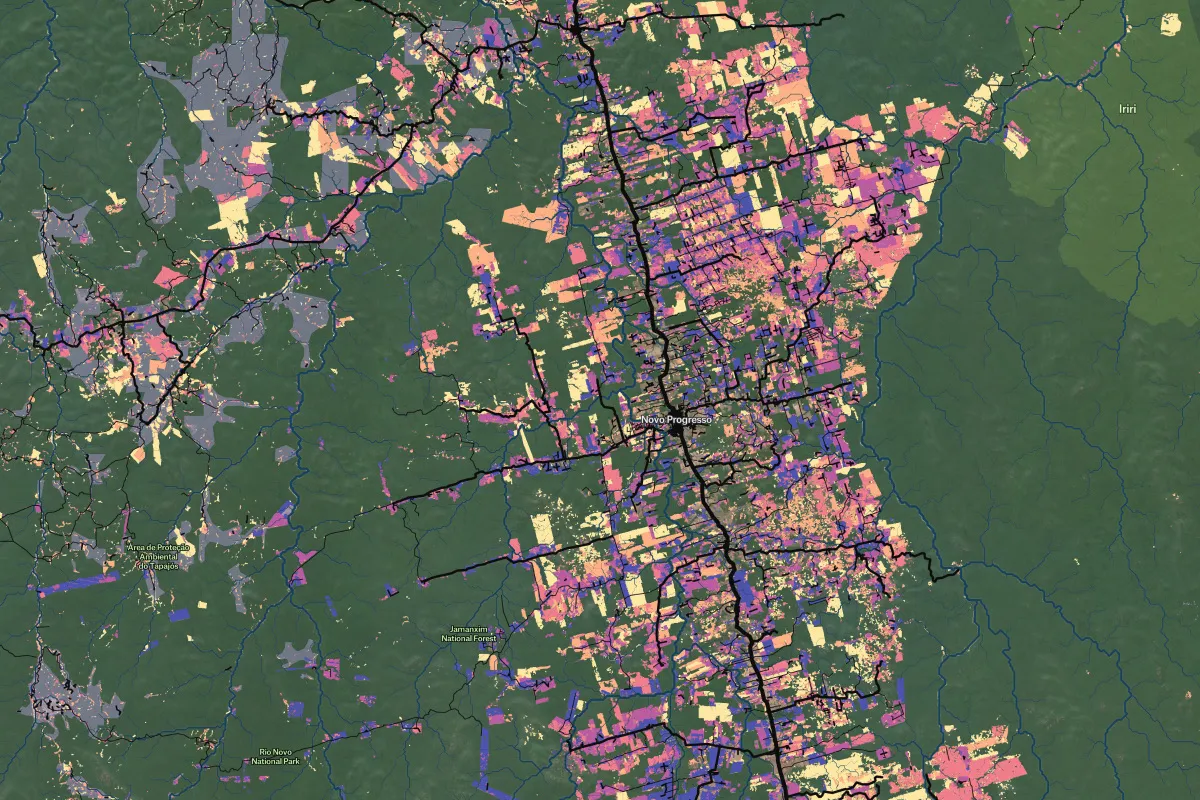
Climate mapping is the process of visualizing temperature, precipitation, emissions, or hazard data on a map to understand how climate change affects different regions over time. These maps help teams build climate risk maps, model future scenarios, and analyze patterns using modern GIS mapping tools. A powerful climate mapping tool makes it easier to layer datasets, compare trends, and share insights across climate and natural resources teams.
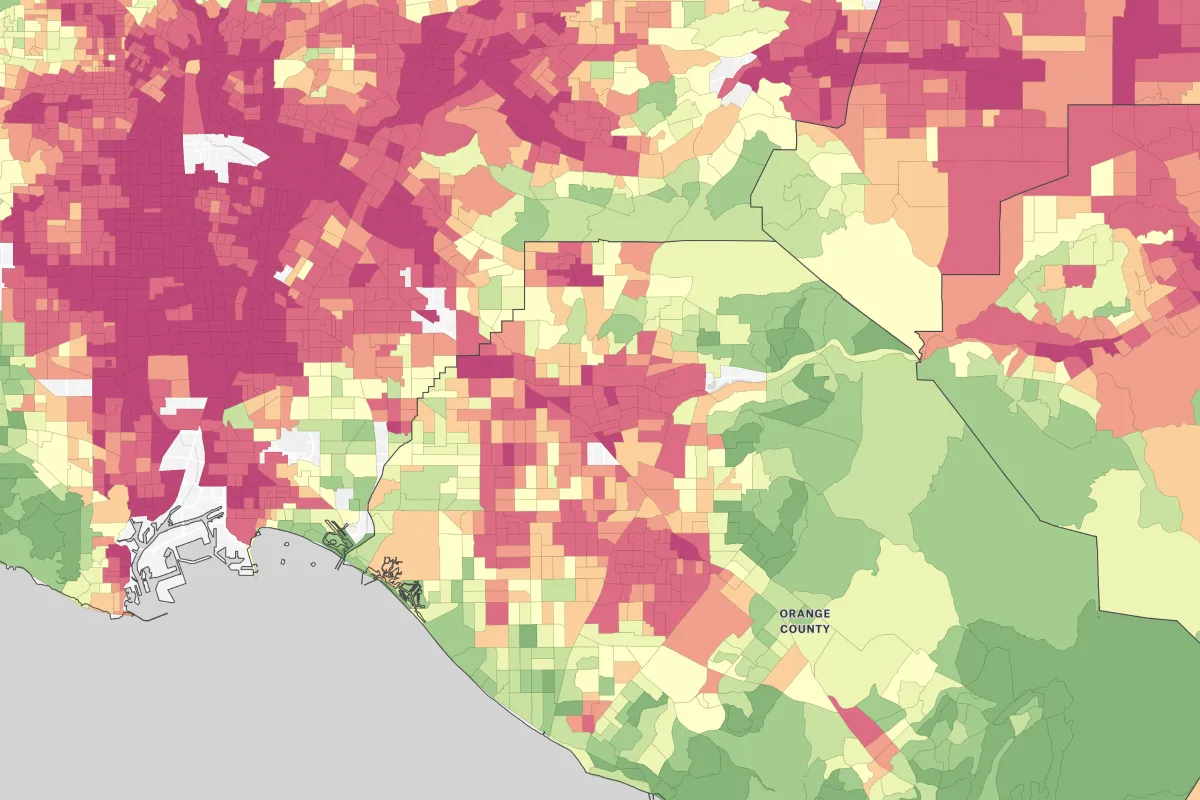
Resilience mapping visualizes a community or ecosystem’s ability to withstand and recover from climate-related impacts such as floods, heat, or pollution. It often combines infrastructure, environmental, and social indicators into a natural resources map or risk model. With the right tools, teams can assess vulnerabilities, prioritize interventions, and plan long-term climate resilience strategies.
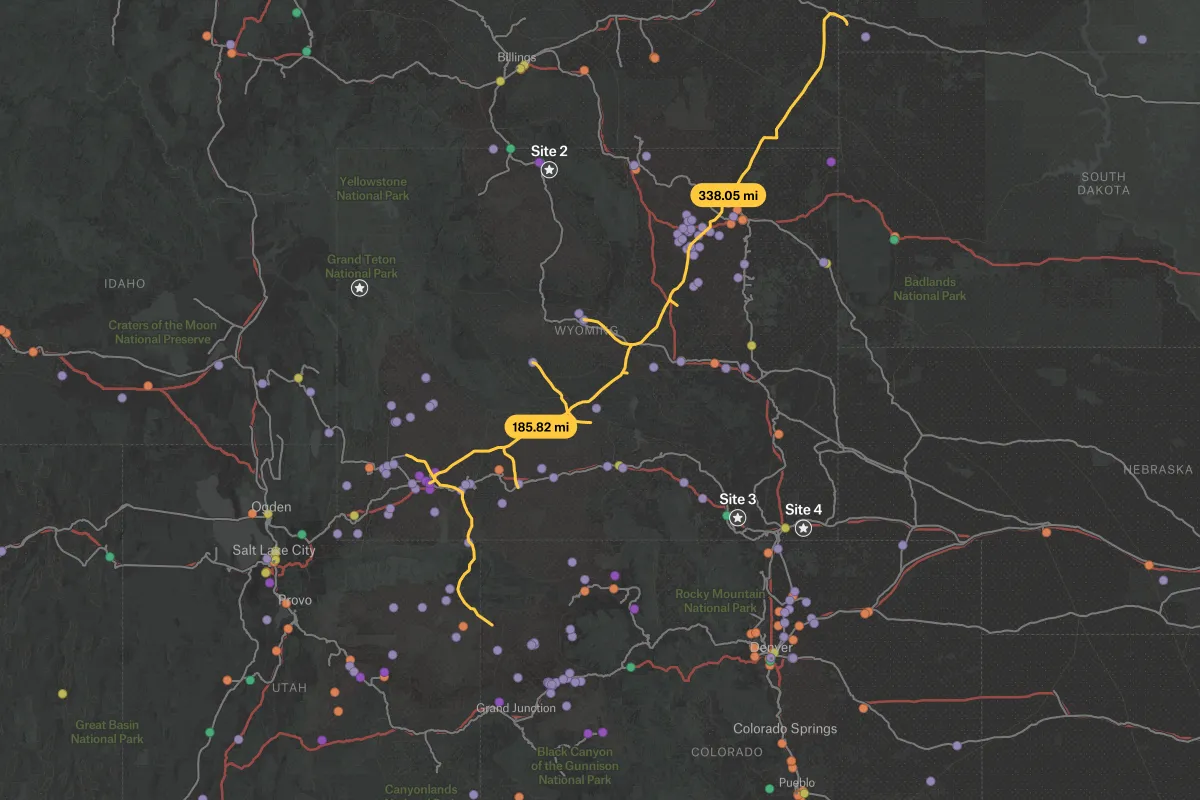
GIS plays a central role in climate change analysis by enabling teams to map climate change impacts, model future conditions, and monitor environmental trends using spatial data. It powers everything from climate models and hazard forecasting to emissions tracking and natural resources management. Modern GIS mapping tools like Felt help teams visualize evolving risks, collaborate in real time, and turn climate data into actionable decisions.

.webp)