Skip to content
LAT37.8044° NLON122.2711° WX-13611157 mY4551831 mE564166 mN4184363 mE6050014 ftN2120204 ftBRG041.0°041.0°040.6°042.1°ZOOM11.0CRS
← Gallery
Climate and natural resources

3 Day Average Heat Index

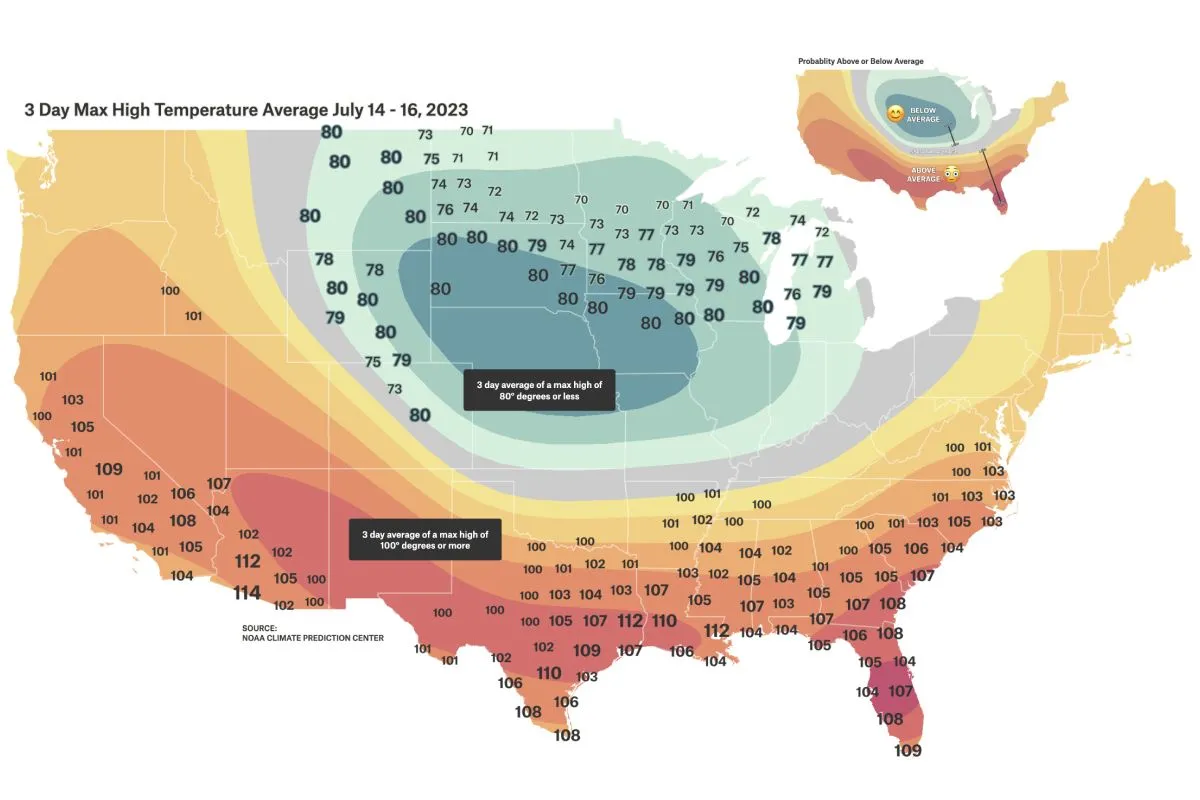
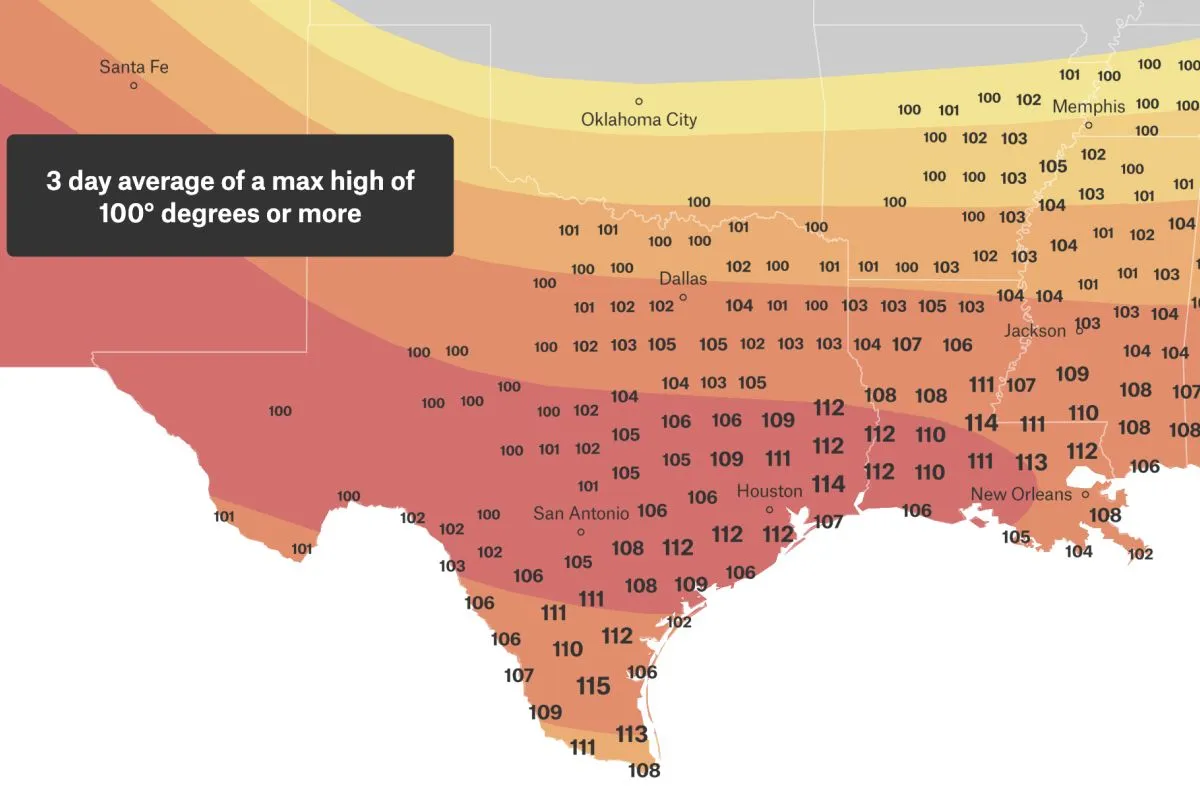
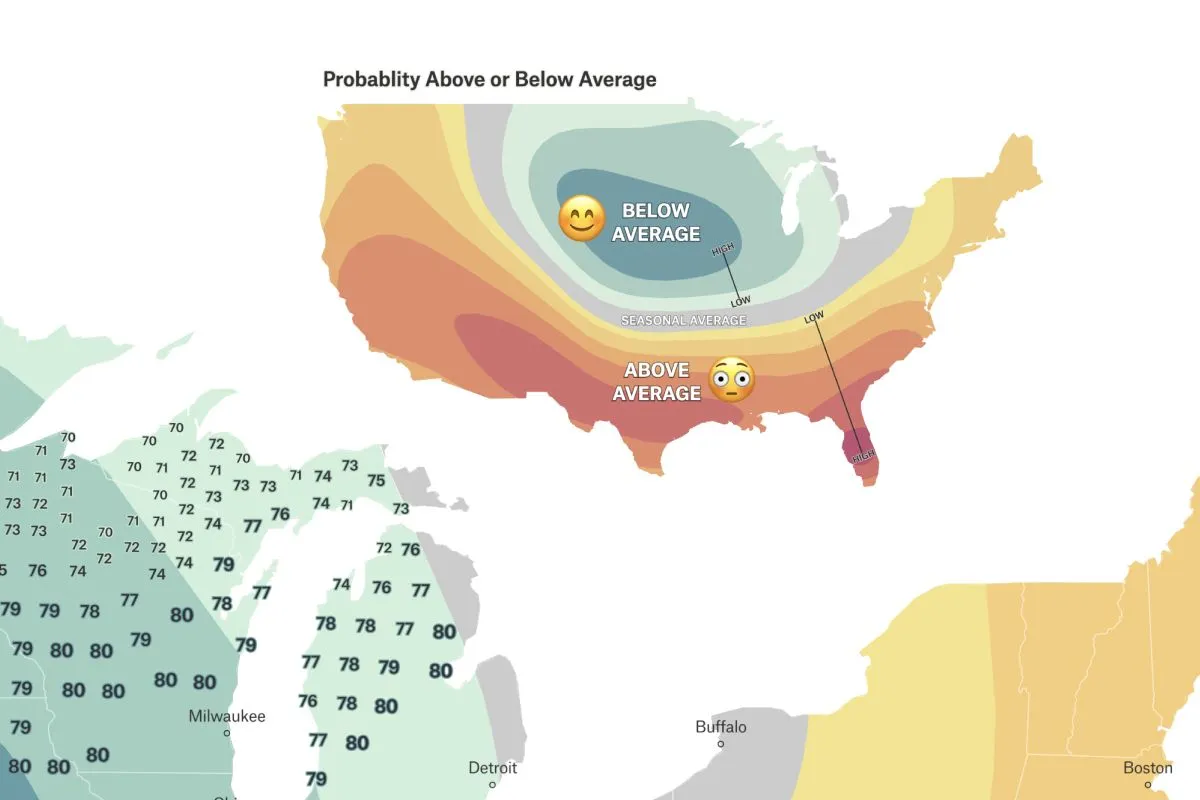
This map shows average three day maximum highs above 100 degrees in areas that were predicted to be above normal temperatures and highs below 80 degrees in areas predicted to be below normal temperatures.

Preview of 3 Day Average Heat Index, an interactive Felt mapExplore this interactive map →
3 Day Average Heat IndexOpen in Felt →
CartographerFeltCategoryClimate and natural resources

The summer of 2023 has been one of the hottest on record. Using data from NOAA Climate Prediction Center and Natural Earth, this map labels average three day maximum highs above 100 degrees in places that were predicted to be above normal temperatures and highs below 80 degrees in areas predicted to be below normal temperatures during the weekend of July 14-16, 2023.
More views

Try Felt

Bring your data, see it on the map

Connect a database or drop in a file and see your data live on a map in minutes.