Felt for Agriculture
Track program progress from every farm visit. Capture field evidence, identify farms that need attention, and give field and office teams one map to plan what comes next.
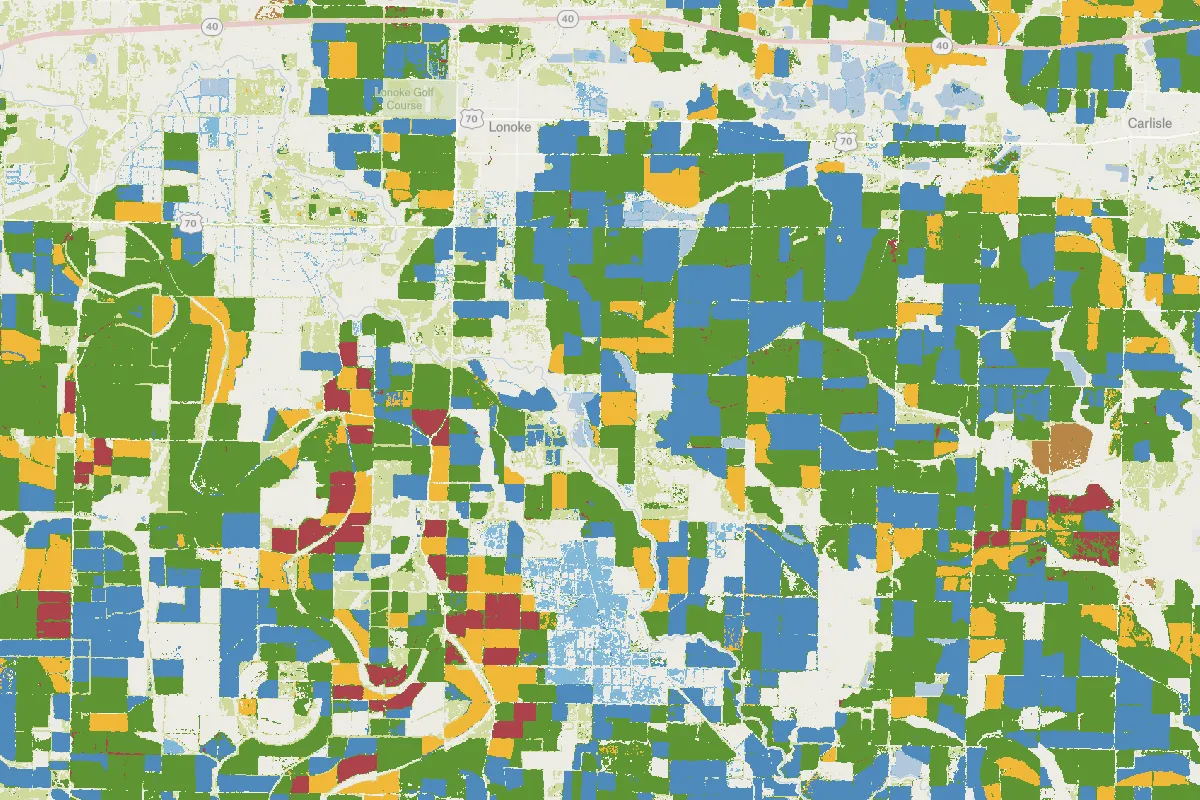
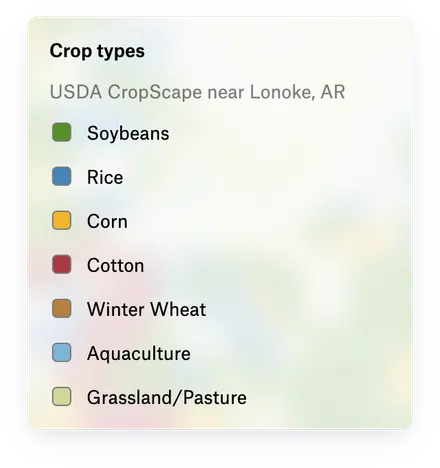






From fieldwork to program results
Collect reliable evidence, keep boundaries current, and give everyone a clear view of progress.
Make on-farm verification easier to review
Give reviewers the evidence they need in one place. Capture observations and geotagged photos against each field, with required questions that keep surveys consistent. The office can review findings as they sync from the field.
Keep field boundaries current
Keep planning grounded in accurate field boundaries. Import KML, Shapefile, or GeoPackage data and let crews correct boundaries on site. Publish to a Felt Server layer so every map that uses it reflects the corrections.
See where every program stands
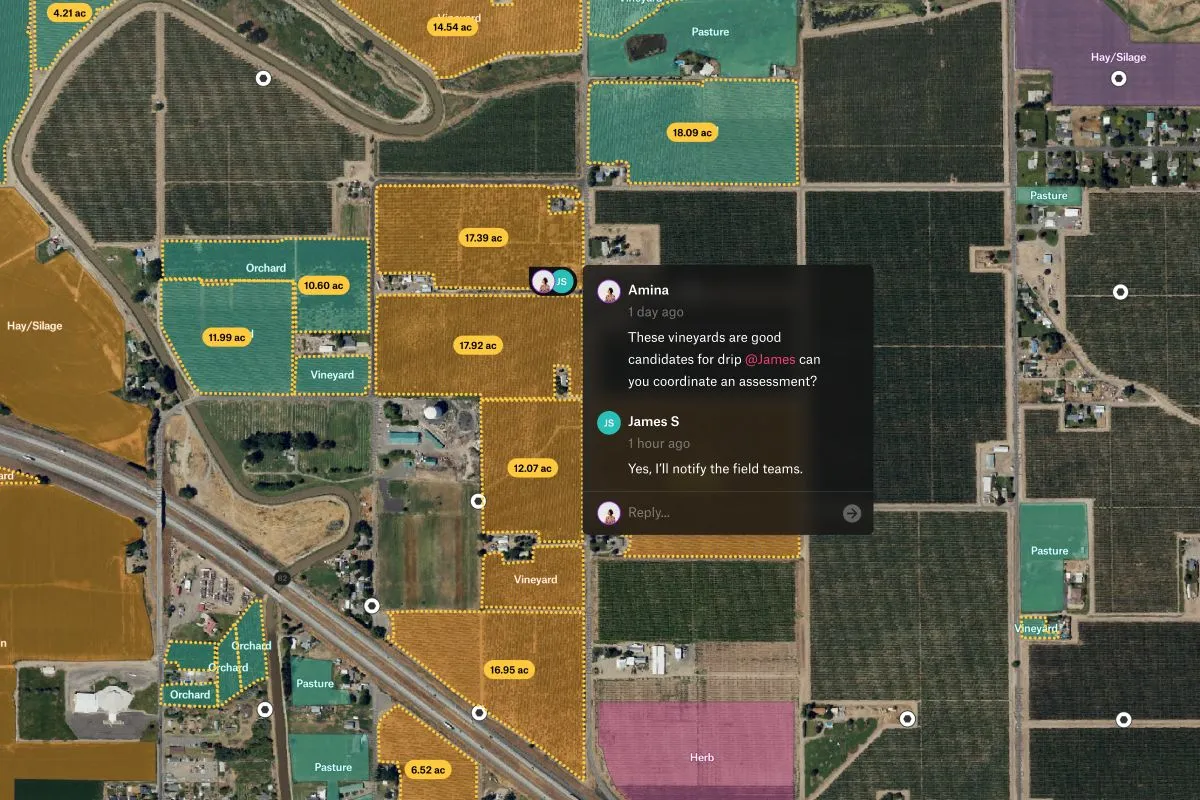
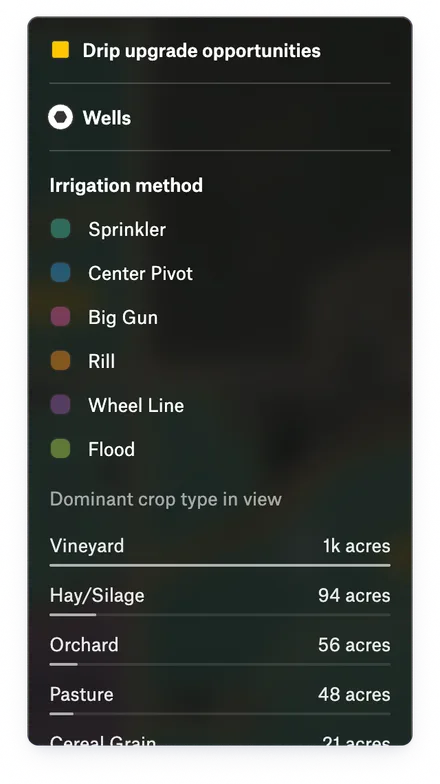
See which fields are enrolled, which visits are complete, and where work needs attention as field reports come in. Filter by program or status, then share the same view with partners in your site or app.
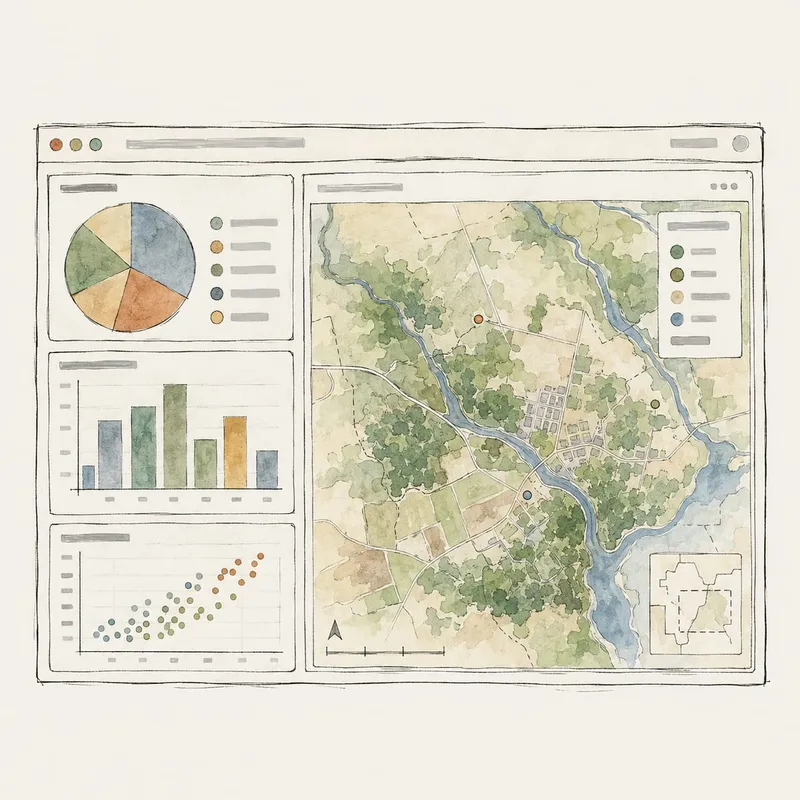
Program & MRV leads
Back program reports with mapped observations and photos from the field.
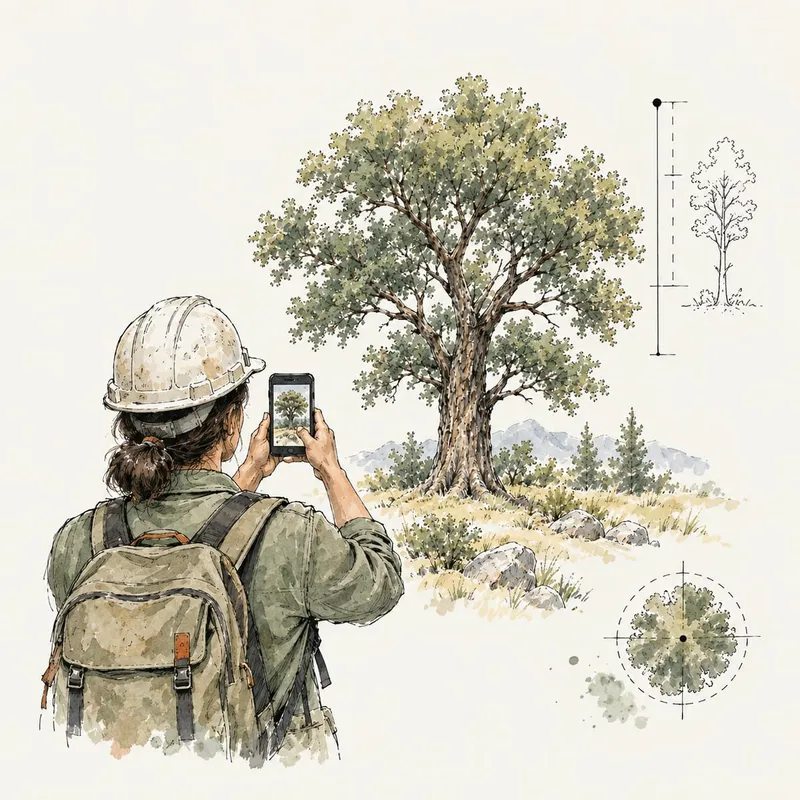
Agronomists & enumerators
Capture observations and update field boundaries on your phone, even offline.
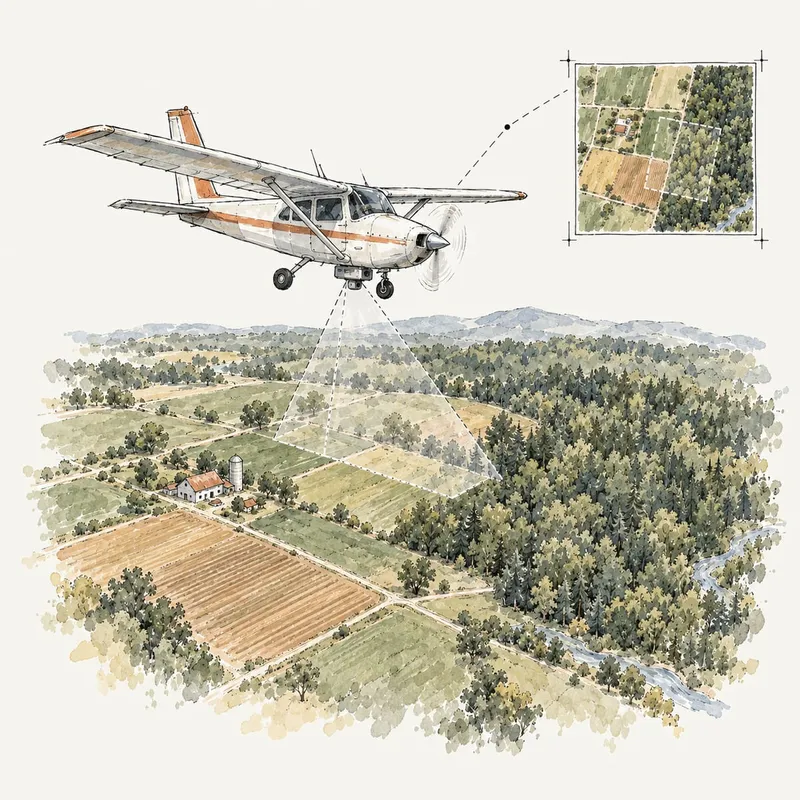
Remote sensing teams
Sample imagery into field boundaries so agronomists can compare conditions across farms.
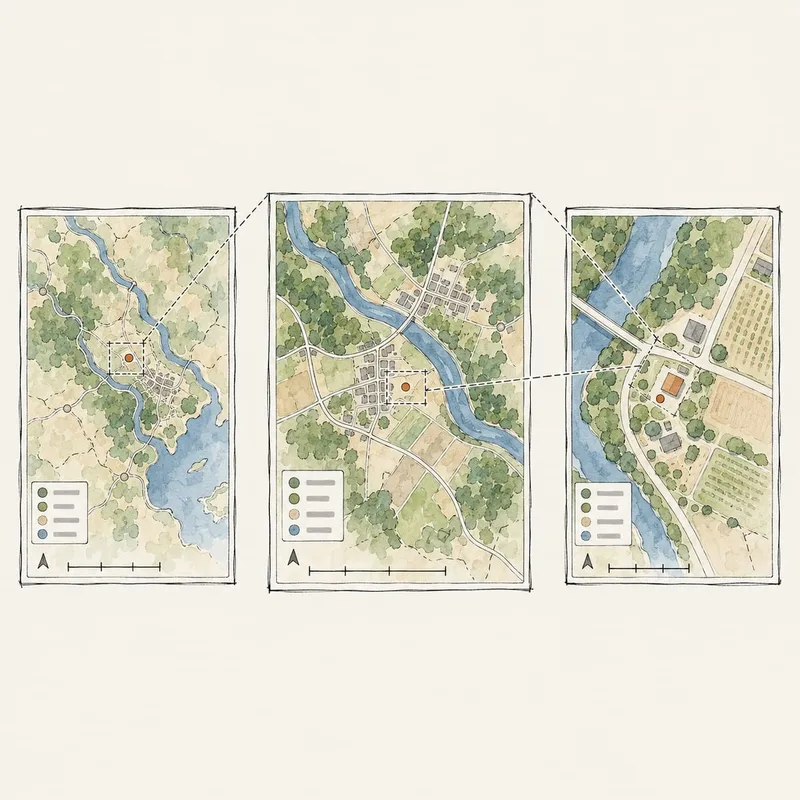
Coordinators
See which fields need attention as reports come in from your team.
One view of every farm and field
Bring boundaries, imagery, and program data together with field observations. Keep connected sources fresh on a schedule so your team can plan the next visit with the latest information.
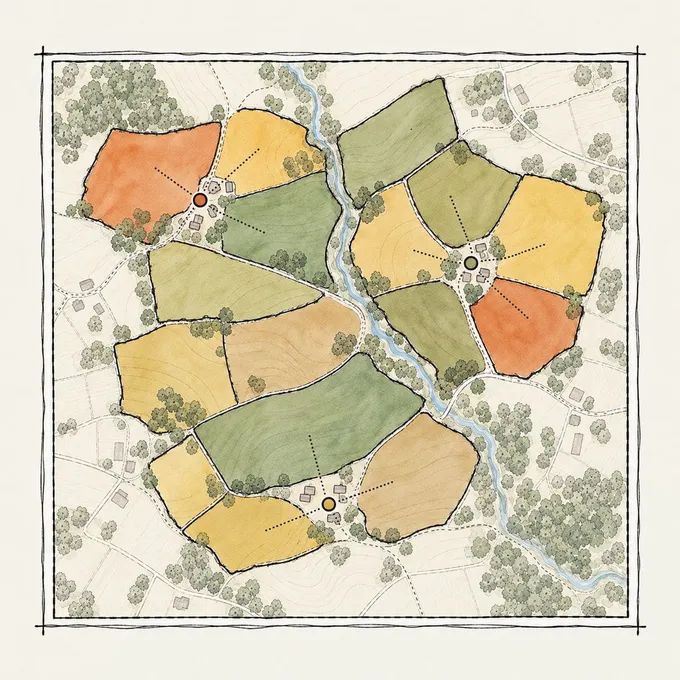
Field and farm boundaries
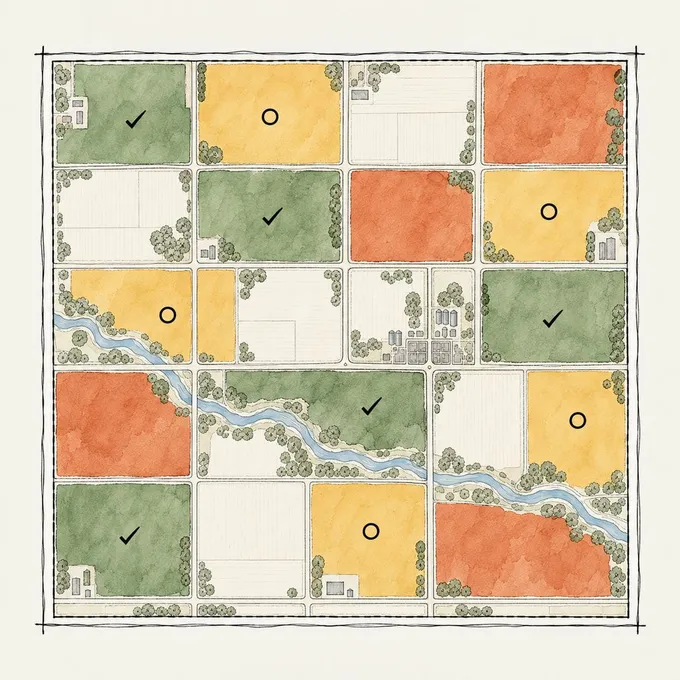
Enrollment and program status
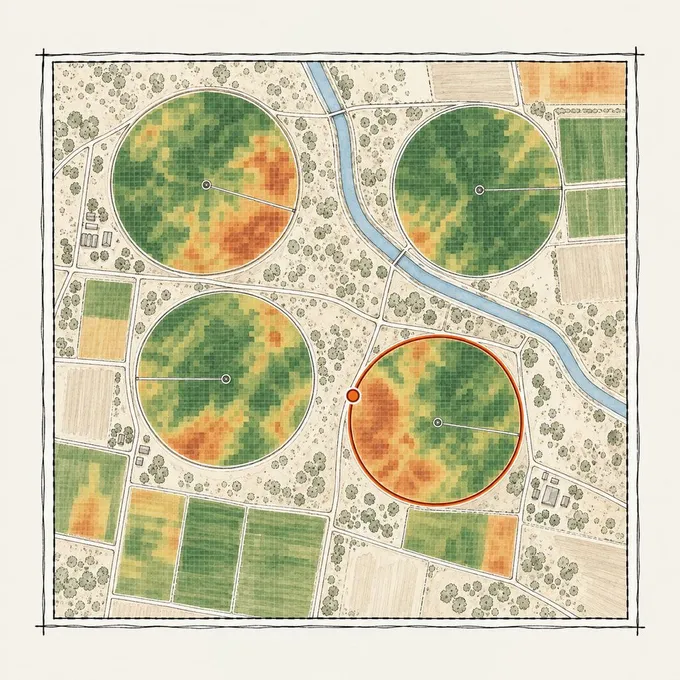
Imagery and analysis layers
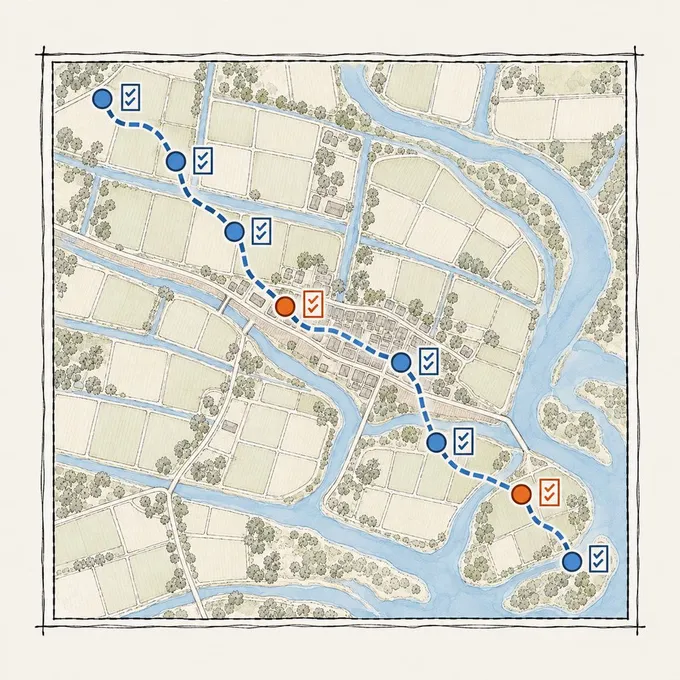
Verification surveys and observations
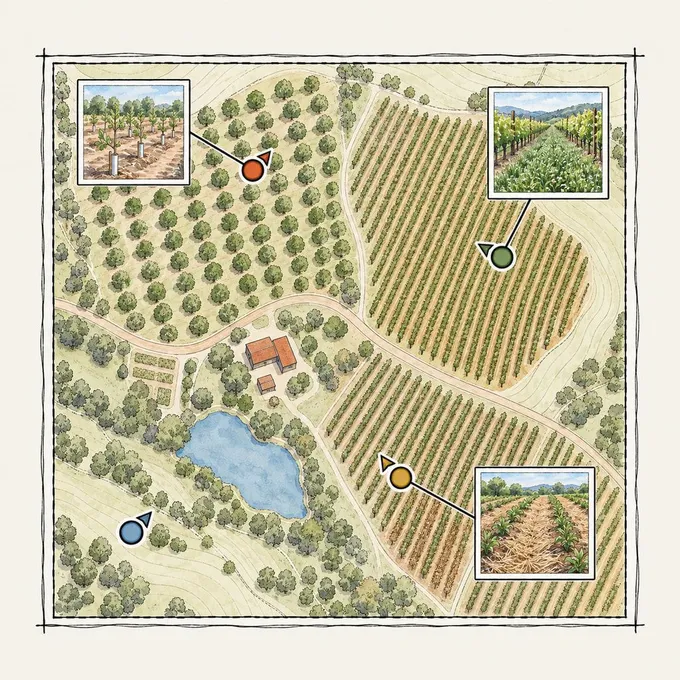
Geotagged photos of practices
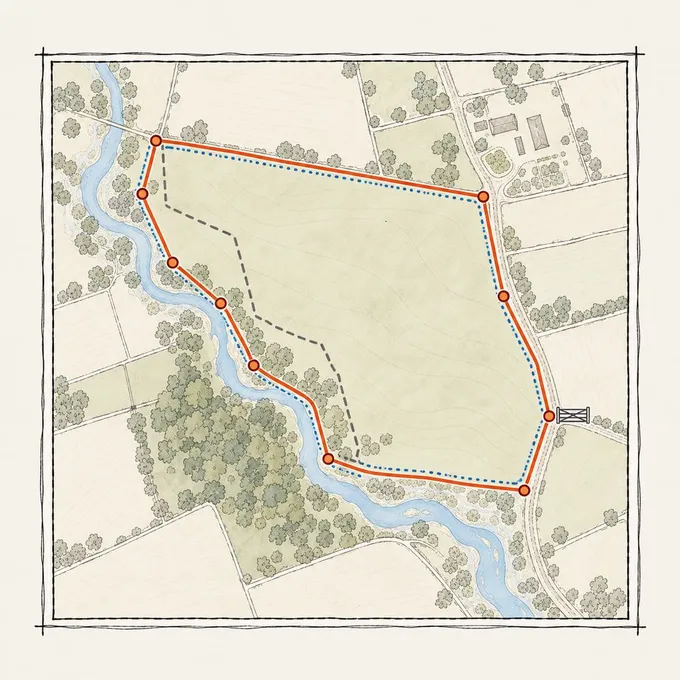
Boundary redraws
Proven results for leaders in agriculture

Felt saves us hours on every analysis and has enabled us to build faster without increasing team size.

Felt saved my team months of work visualizing data.

The up front investment to build a custom solution that met our performance standards would have been massive.
Built for the people in the field
Give agronomists and enumerators a simple way to capture observations, photos, and boundaries in the Field App. They can work offline and sync when coverage returns, so the office gets evidence tied to the right field without re-entering it from a spreadsheet.

Common questions
- 01Can field staff use Felt maps on their phones?
Yes. Give agronomists the same maps the office uses, in the Felt Field App or a mobile browser. Viewing requires no paid seat; staff with a seat can also take maps offline.
- 02Can Felt calculate soil and crop coverage per field?
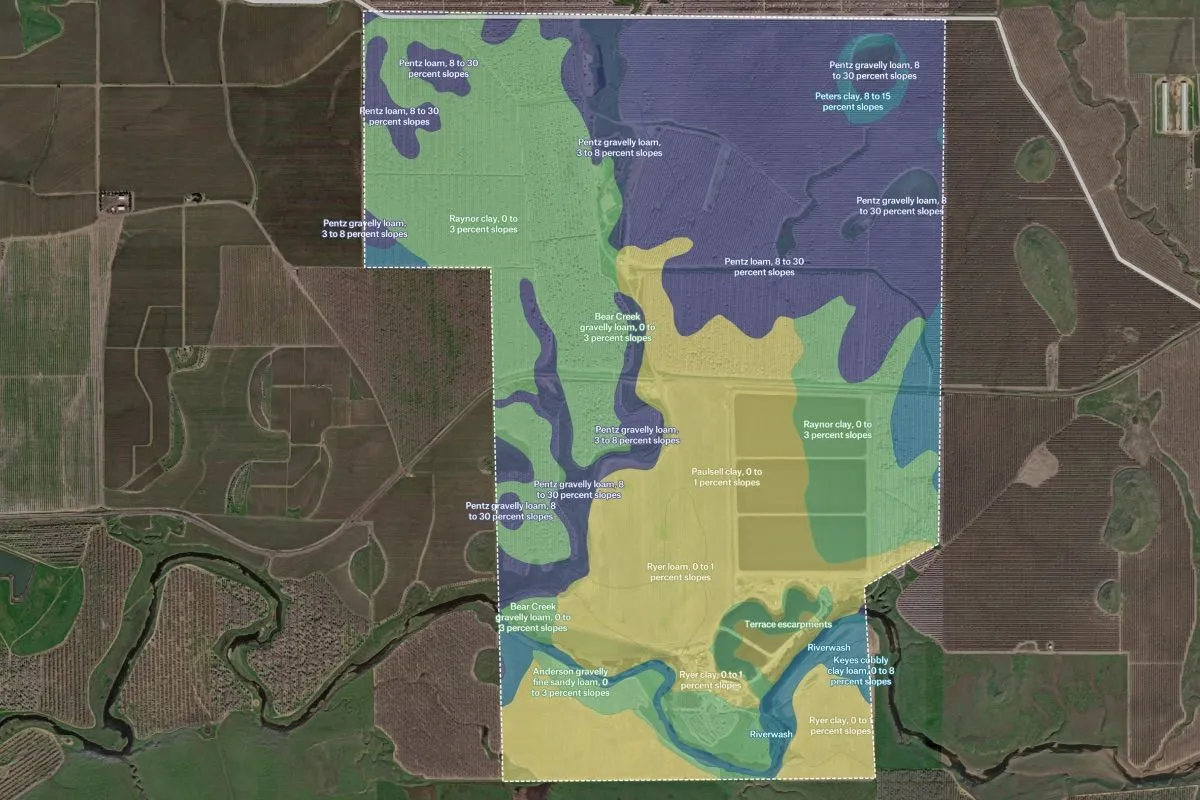
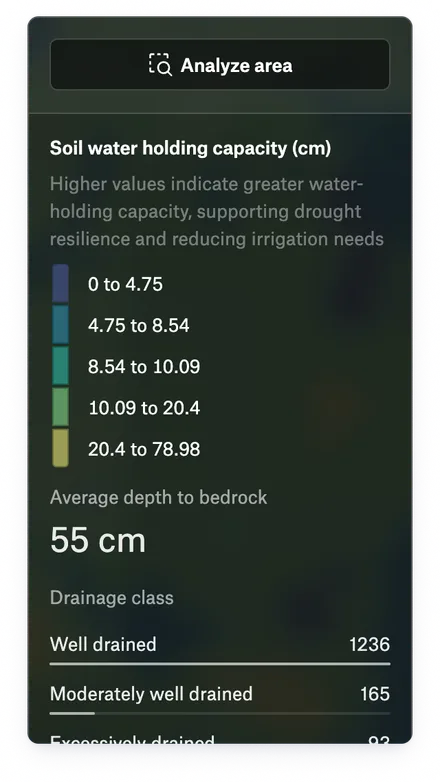
Yes. Calculate soil and crop statistics for each field, then sort, filter, and compare the results. Agronomists can prioritize fields using measures such as average soil score and share the analysis on a map.
- 03Can I mask a raster to show one crop type?
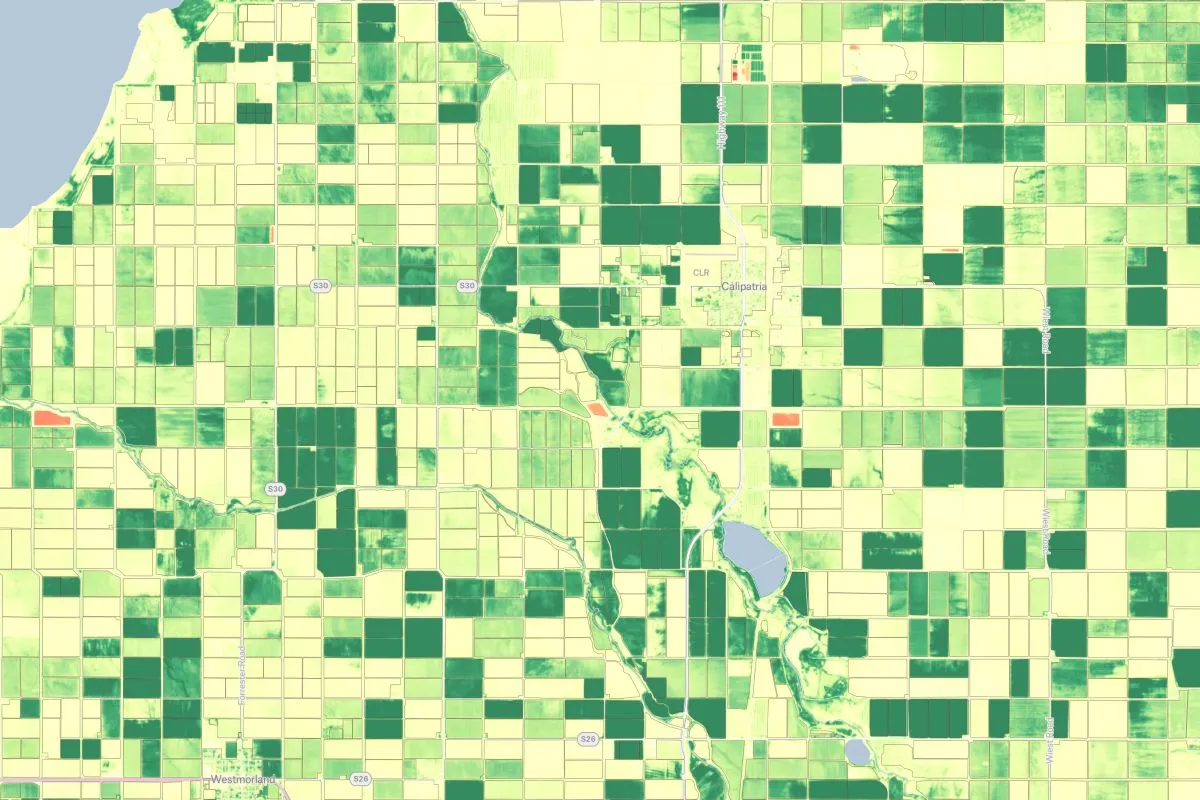
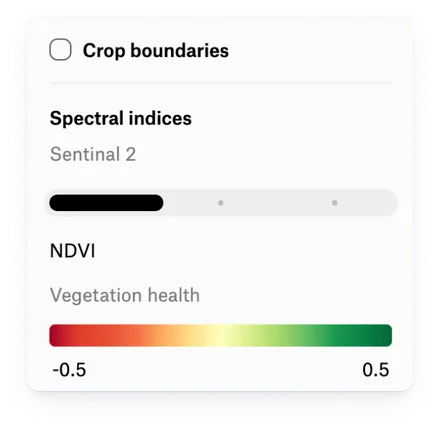
Yes. Isolate a crop type, soil class, or value range to focus your analysis. Felt also calculates indices such as NDVI from multi-band imagery, helping agronomists identify stressed fields in the browser.
- 04Can Felt connect to our Amazon S3 bucket?
Yes. Turn spreadsheets, field boundaries, and imagery in your S3 bucket into map layers. Connect private buckets through an IAM role in your AWS account and schedule spreadsheet refreshes to keep your maps current.
- 05Does a Felt map update when our data changes?
Yes. Schedule refreshes for layers connected to a database, Google Sheet, or ArcGIS service. Your maps stay current without re-uploading data or rebuilding styles and filters.
Make the field visit the record
Every observation and photo tied to the field where it happened.