Skip to content
LAT37.8044° NLON122.2711° WX-13611157 mY4551831 mE564166 mN4184363 mE6050014 ftN2120204 ftBRG041.0°041.0°040.6°042.1°ZOOM11.0CRS
← Gallery
Climate and natural resources

NOAA Seasonal Snow Accumulations

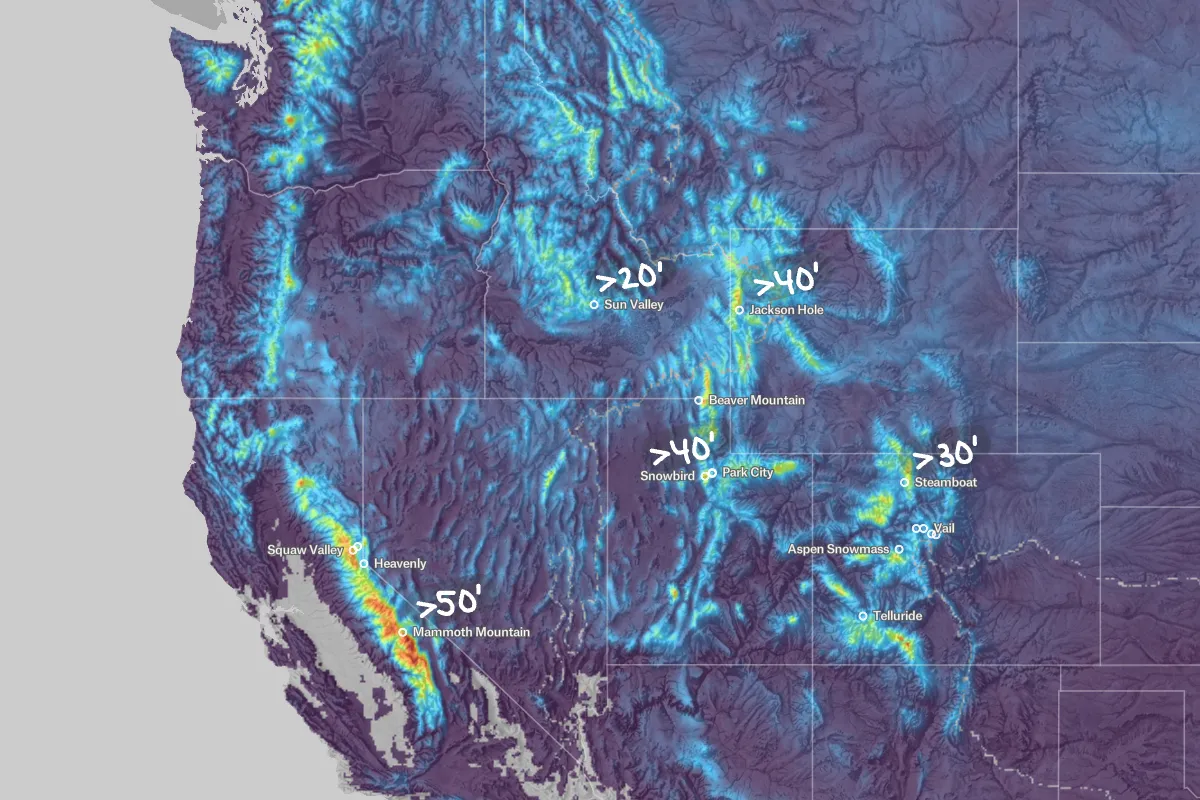
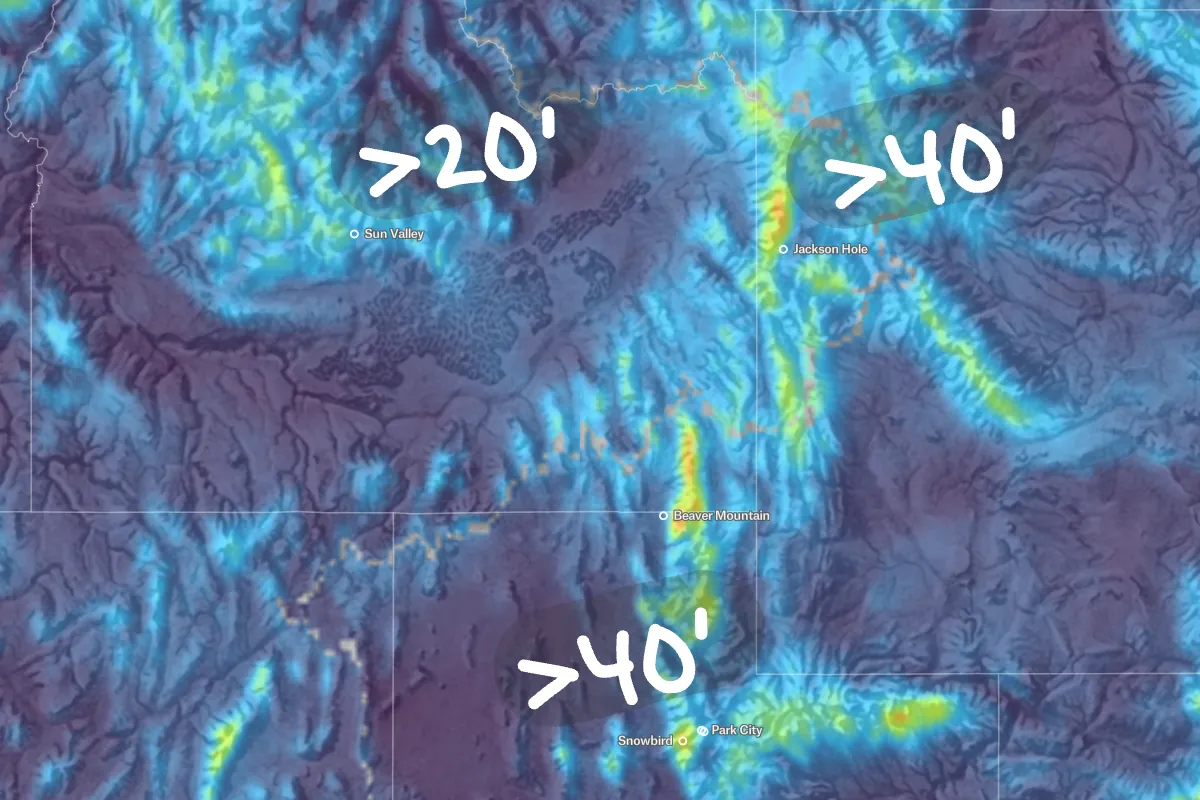
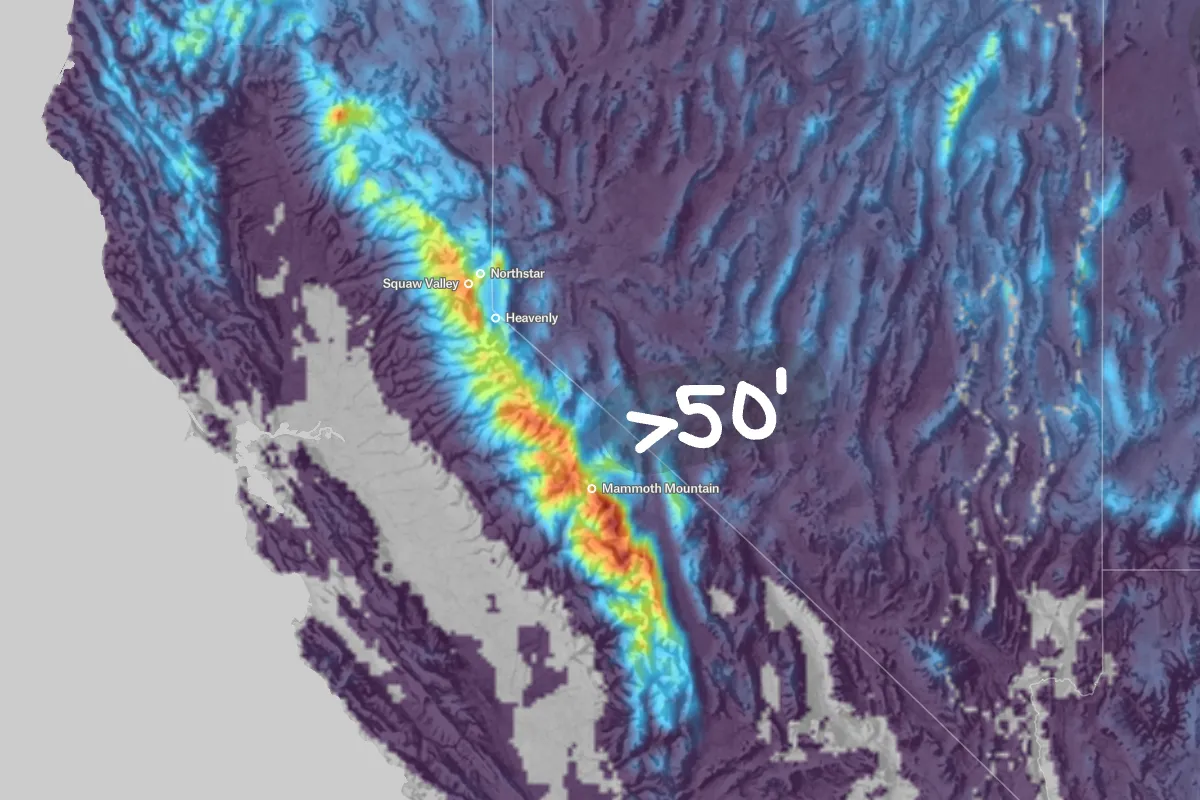
Combine rasters to achieve cartographic affects, like this map of NOAA’s September-April 2023 cumulative snowfall raster over Richard Edes Harrison shaded relief.

Preview of NOAA Seasonal Snow Accumulations, an interactive Felt mapExplore this interactive map →
NOAA Seasonal Snow AccumulationsOpen in Felt →
CartographerFeltCategoryClimate and natural resources

An effective way to enhance the visual appeal of your maps is to combine rasters. By doing so, you can create cartographic effects that can greatly improve the quality of your maps. For instance, you can overlay NOAA’s September-April 2023 cumulative snowfall raster over a Richard Edes Harrison shaded relief map to produce a stunning visual representation of the snowfall in that region. Whether you are a professional cartographer or simply someone who enjoys making maps, experimenting with different raster combinations can help you produce captivating maps that are sure to impress.
More views

Try Felt

Bring your data, see it on the map

Connect a database or drop in a file and see your data live on a map in minutes.