Skip to content
LAT37.8044° NLON122.2711° WX-13611157 mY4551831 mE564166 mN4184363 mE6050014 ftN2120204 ftBRG041.0°041.0°040.6°042.1°ZOOM11.0CRS
← Gallery
Planning

California Reservoirs

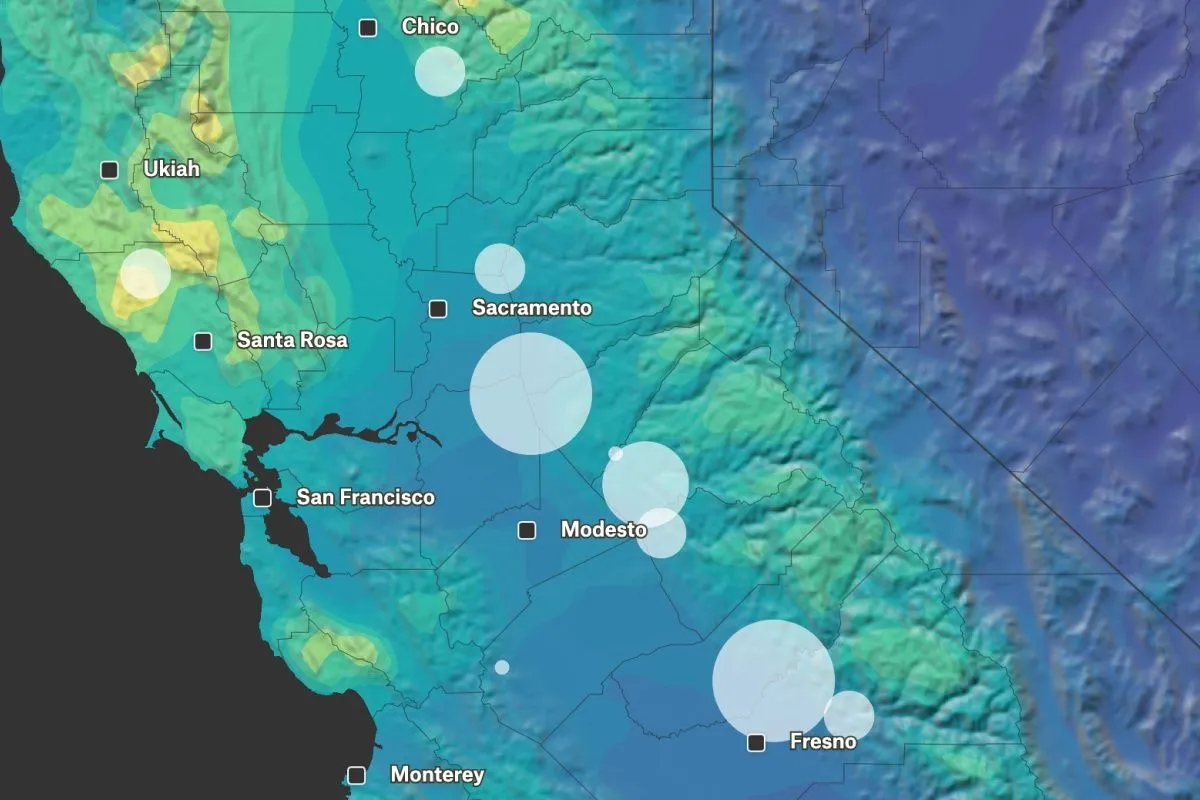
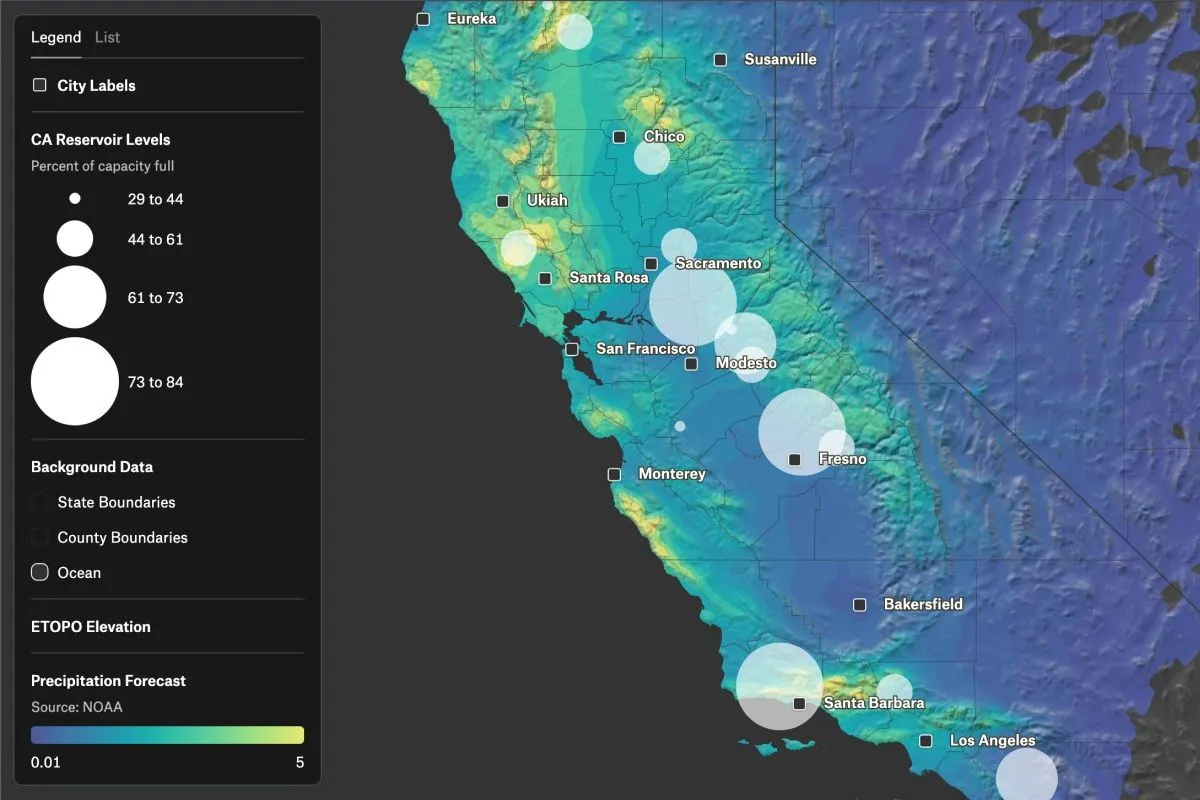
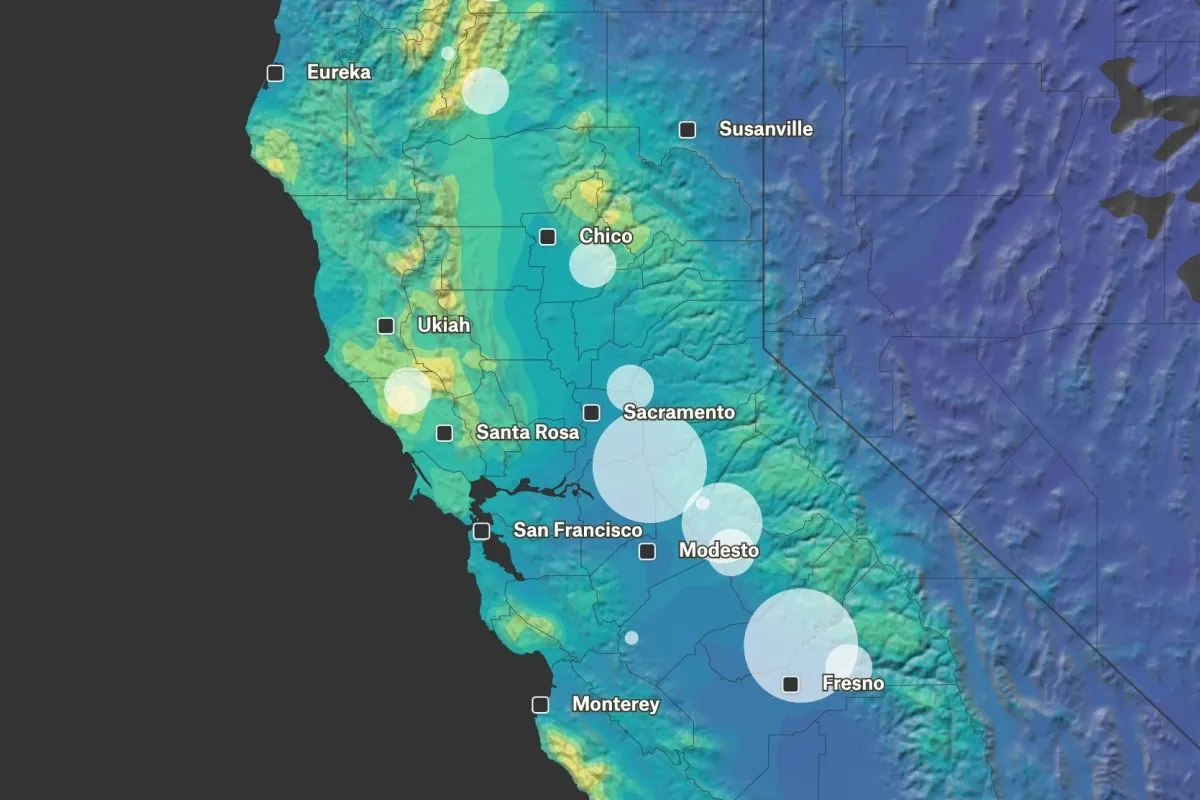
The percentage of reservoir capacity utilized in State of California in January of 2023.

Preview of California Reservoirs, an interactive Felt mapExplore this interactive map →
California ReservoirsOpen in Felt →
CartographerFeltCategoryPlanning

The percentage of reservoir capacity utilized in State of California in January of 2023. The reservoirs are visualized using Felt’s size-by-value visualization type in the style editor and are displayed by the percent capacity filled. Precipitation data from NOAA is visualized using the categorical style type in the style editor.
More views

Common questions

01What are the 10 largest reservoirs in California?

The 10 largest California reservoirs by capacity are: Shasta Lake (4.5 million acre-feet), Lake Oroville (3.5 million), Trinity Lake (2.4 million), New Melones Reservoir (2.4 million), San Luis Reservoir (2 million), Don Pedro Reservoir (2 million), Lake Berryessa (1.6 million), Pine Flat Lake (1 million), Isabella Lake (570,000), and Cachuma Lake (205,000). Rankings can vary slightly depending on whether measuring by surface area or water storage capacity.

02Why is California removing dams?

California is removing certain dams to restore river ecosystems, improve fish passage (especially for endangered salmon and steelhead runs), reduce maintenance costs for aging and obsolete dams, address safety concerns with old infrastructure, restore natural sediment flow, and improve water quality. Most removals target smaller, outdated dams that no longer serve their original purpose rather than major water supply reservoirs.

03Are reservoirs in California filling up?

California reservoir levels fluctuate significantly based on seasonal precipitation and drought cycles. As of recent years, many reservoirs have recovered from severe drought conditions following wet winters with atmospheric rivers, but levels vary considerably by location and season. Current reservoir status changes frequently, so checking the California Department of Water Resources’ real-time data provides the most accurate picture of storage levels.

Try Felt

Bring your data, see it on the map

Connect a database or drop in a file and see your data live on a map in minutes.