CartographerFeltCategoryPlanning
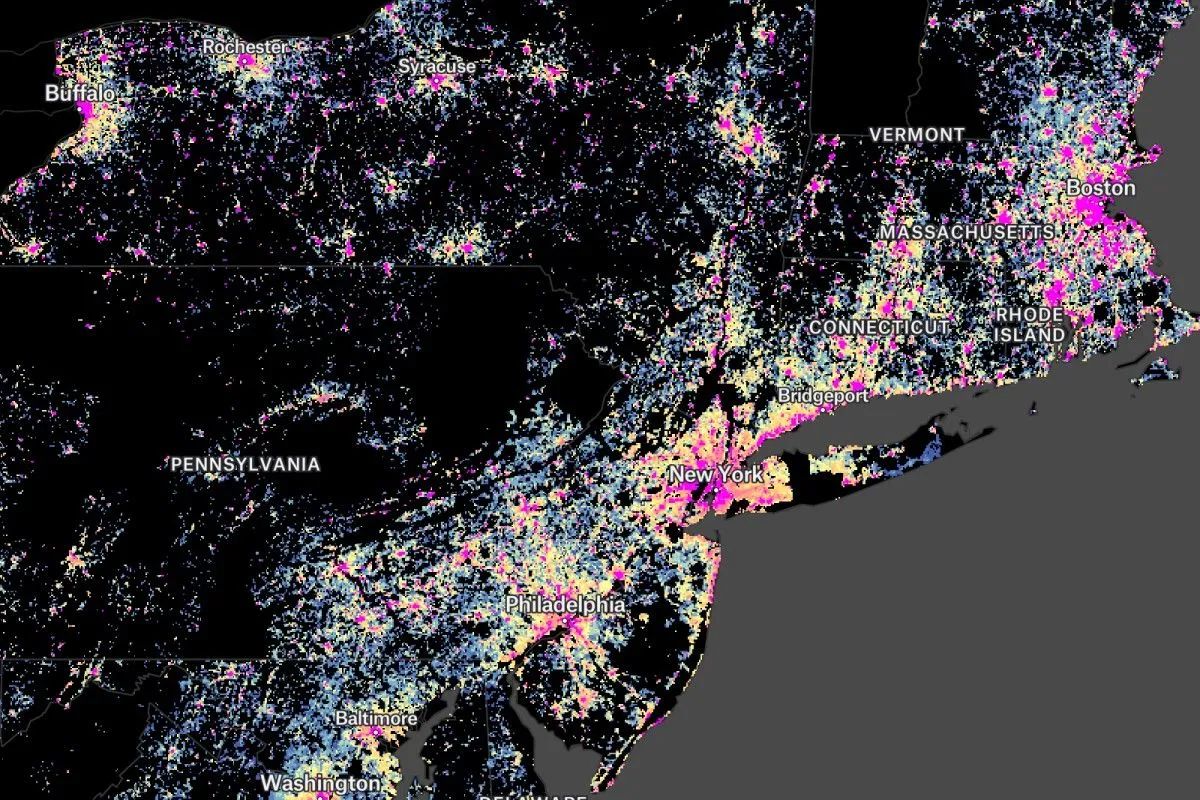
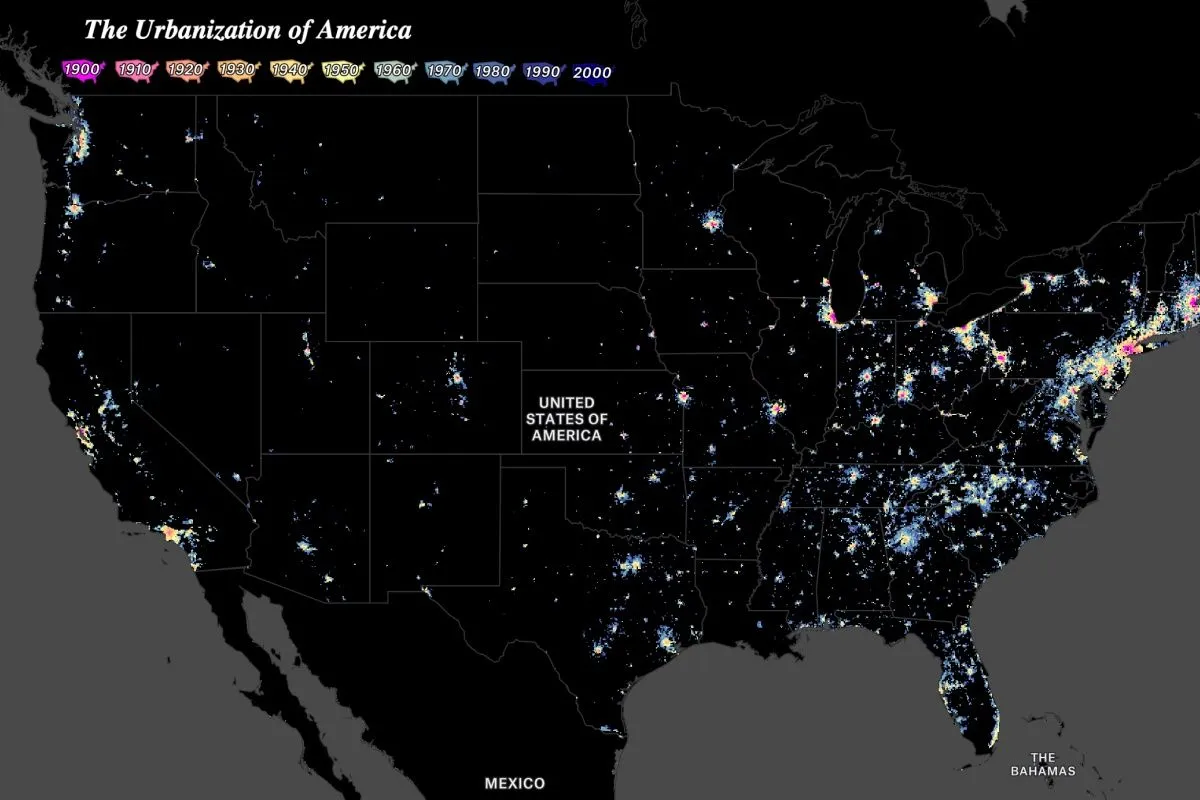
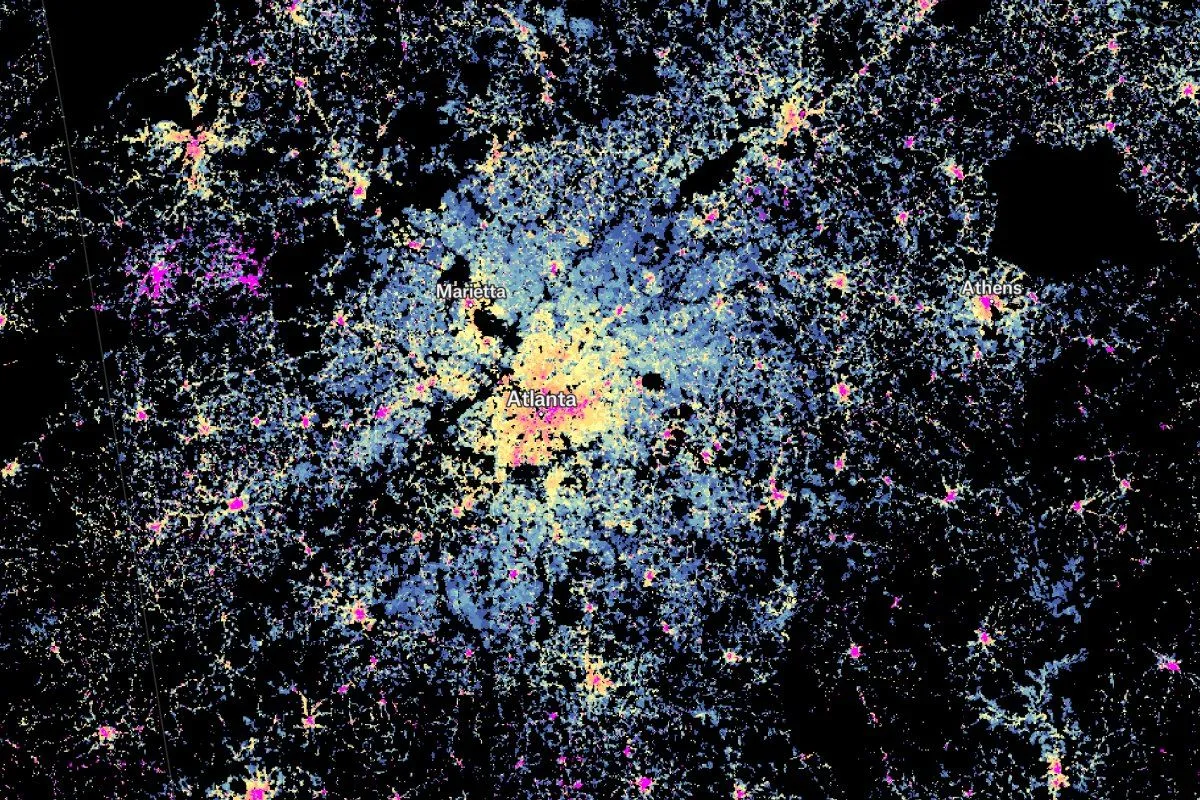
By the 1900s the majority of the US population lived in urban areas. This map highlights the pattern of urbanization across the continental United States between 1900 - 2000 in 10 year increments. The data were compiled by researchers at the University of Colorado, Boulder using the Zillow Transaction and Assessment Dataset and the raster layers represent the presence of at least one built-up structure at 250m spatial resolution over each time period.
Toggling decades on and off reveal rich patterns and trends in transportation and land use changes. Zoom into a city you know well. What do you notice?