Introducing Felt’s JavaScript SDK: the best way to build apps with maps
Take full control over Felt’s UI and create custom applications with our JavaScript SDK.

Take full control over Felt’s UI and create custom applications with our JavaScript SDK.
Update, October 2026: Platform, which includes the JavaScript SDK, is now free for three months on any paid plan. Read about building Felt maps into your product.
Every day, we talk to teams focused on critical problems, all looking for a faster way to build best-in-class mapping apps. With missions like carbon sequestration, or methane monitoring – these teams want to focus on their core business problems, not the never-ending complexities of mapping software. We started thinking, what if we could give them a faster, more efficient path to build best-in-class mapping applications?
In the past, Felt’s made it wildly fast to create maps and dashboards. Today, we’re doing the same with apps by launching our JavaScript SDK. Users can now take full control of the UI and create custom applications with the same time-savings and ease of use you’ve come to love from Felt.
Introducing the JavaScript SDK
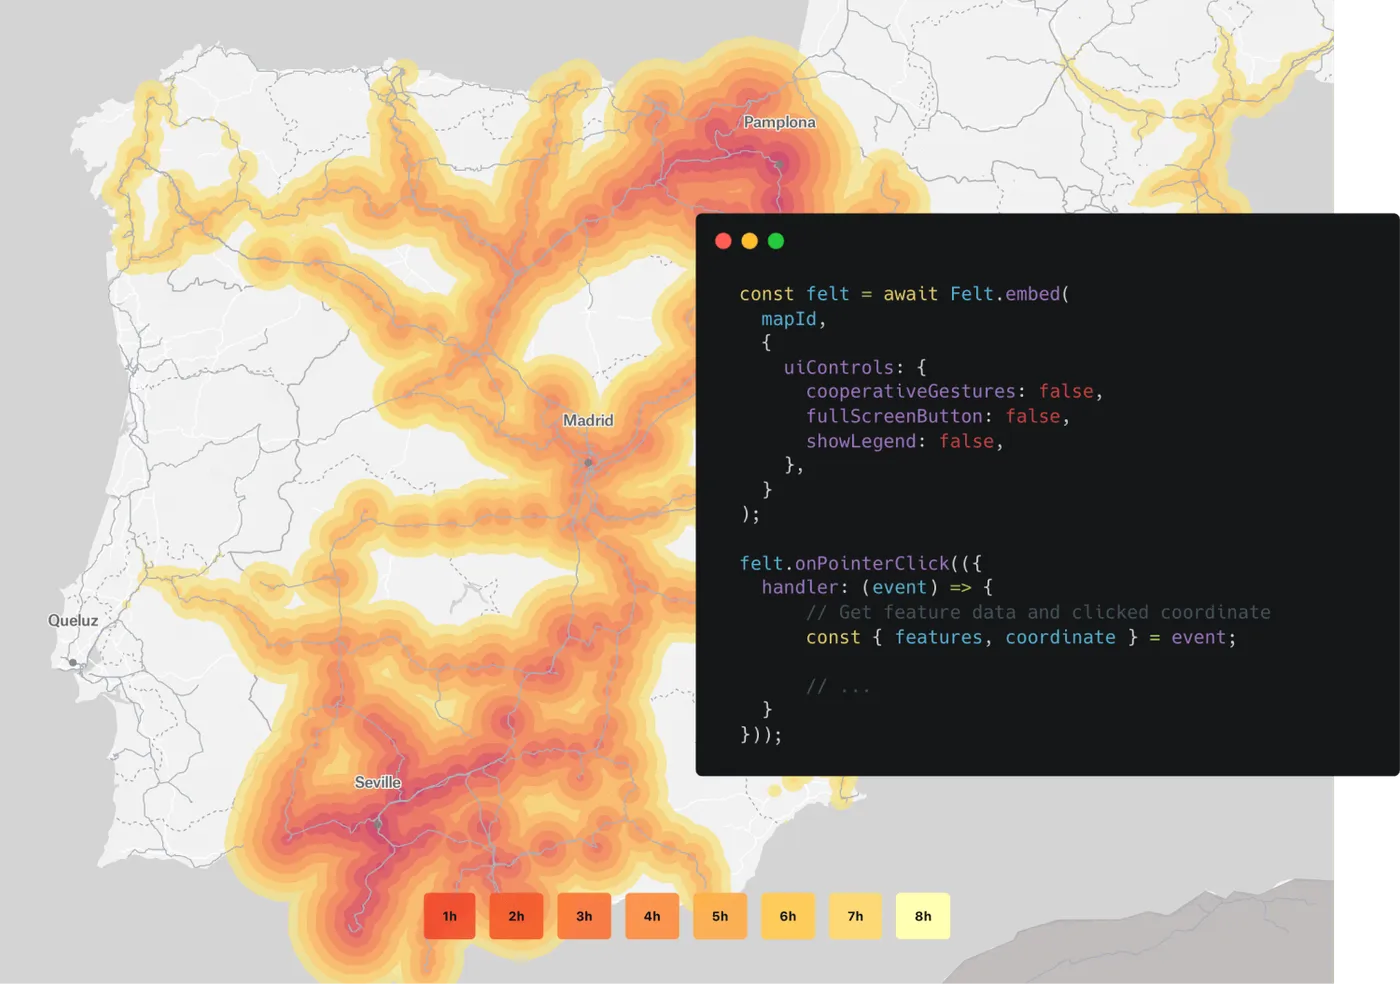
Felt’s JavaScript SDK enables you to take full control of Felt and build custom experiences for your end users. Here are just a few things you can do with the new JS SDK:
- Remove the UI and add your own for a fully branded experience.
- Integrate maps into your dashboards by listening for map interactions.
- Filter data on a dashboard UI and programmatically apply those filters to the map.
- Build story maps with interactive scrolling experiences.
By leveraging the power of Felt’s platform, we’ve seen customers build in days what would have taken weeks with conventional tools. For example, watch how two Felt engineers built a custom application (inspired by Chronotrains) that returns travel time isochrones when you click on a train station location (dive into the code here).
Upgrade existing maps with custom HTML
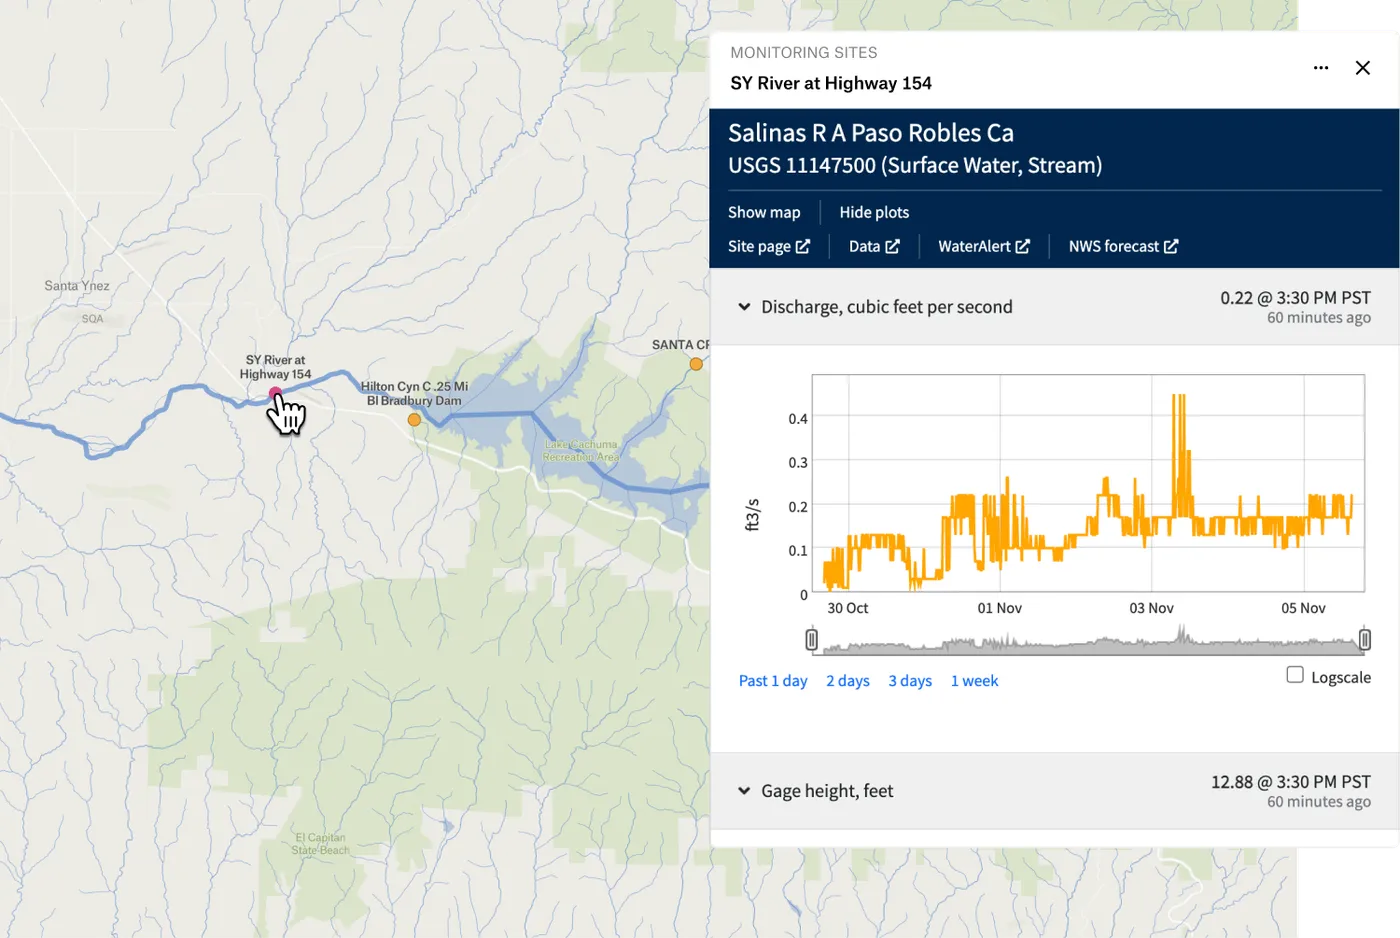
You can also use the SDK to deliver custom workflows and interactive superpowers entirely within the app. Every click can generate a popup, sidebar or modal populated with an iframe or custom HTML. Enable viewers to see custom charts, site plans, photos and/or key statistics related to a location without ever leaving the map. In the example below, we used the new sidebar interaction to generate an iframe of United States Geological Survey’s river rate monitor webpages based on the site selected. Explore the River Rate Monitor app here.
World-class developer experiences
Curious about what you can build? Jump into our top notch documentation and get hands on with our gallery of examples in CodeSandbox. We’ve built world-class developer experiences that make it easy for you to dive right in.
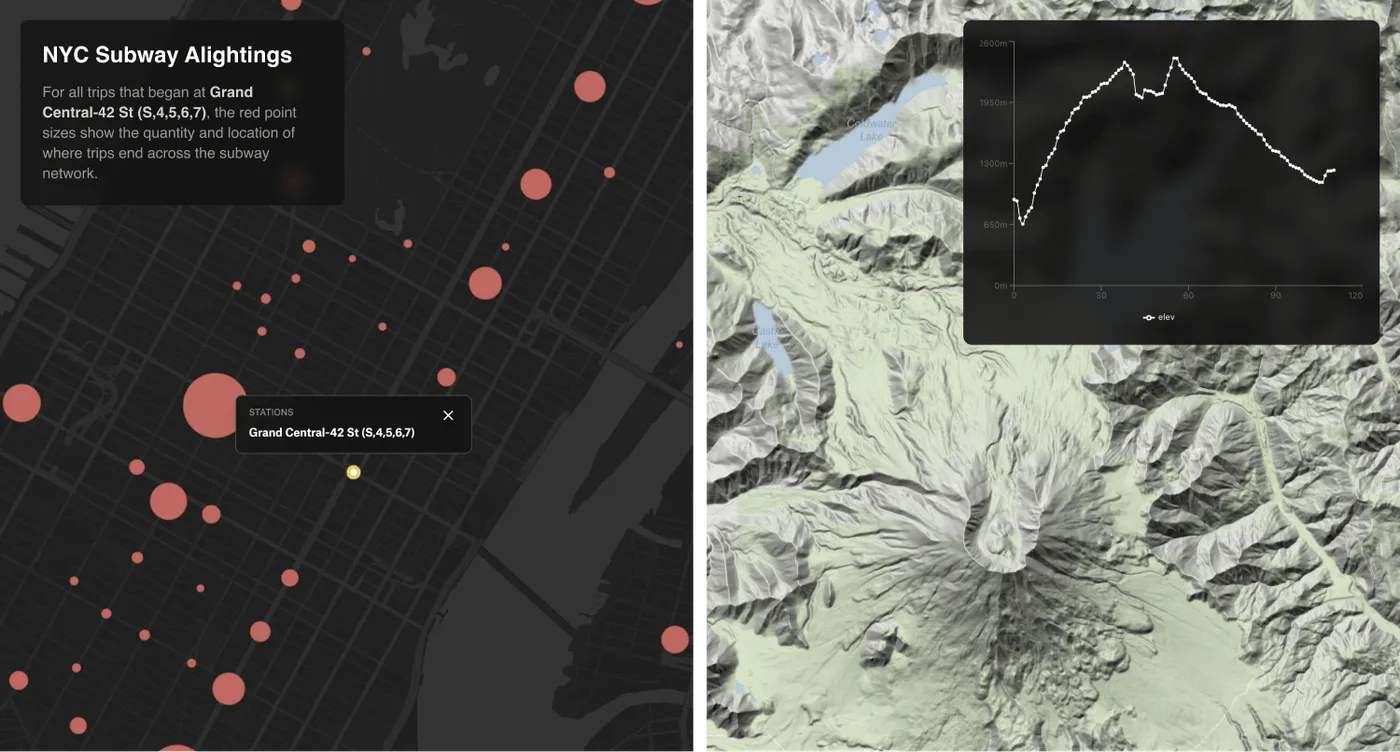
Visit the links below to explore apps built with Felt’s JavaScript SDK (code best viewed on desktop):
- Felt Racer [code] - use your arrow keys or WASD to try to stay on the race track! Must be played on desktop.
- Station Alightings Tracker [code] - select a station to see where people are traveling from.
- Terrain Explorer [code] - move your mouse across the landscape to return the terrain profile (desktop only).
- Transit Isochrone Generator [code] - select a transit station and time frame to see what destinations you can reach.