Building mapping applications is notoriously difficult. From selecting a rendering library, to figuring out how to deliver data programmatically and performantly, to designing the UI experience, these obstacles require substantial engineering resources and extend development cycles, delaying core business objectives.
Felt directly addresses this problem with developer tools that can be implemented in minutes and require zero maintenance. By eliminating concerns about rendering, tiling, and data infrastructure, our API users report 6x faster project delivery, 95% less maintenance time and an increased ability to execute on complex user interactions. Today, we're expanding our API capabilities to help developers accelerate their roadmaps even further.
JavaScript SDK
Felt's JavaScript SDK empowers developers to create dynamic, interactive maps by embedding, connecting to, and controlling map styles and filters. Today's launch delivers enhanced capabilities making interactive mapping applications easier than ever to build.
- [New] Element API - Add all the Felt elements you know and love, like points, lines, polygons, notes, and text to your map programmatically. You can even specify their color, stroke weight, styling, whether to display measurement & more.
- [New] Draw API - Our world class drawing tools – like lines, polygons, circles, marker & highlighter – are now available through the SDK to leverage when building custom user drawing interactions.
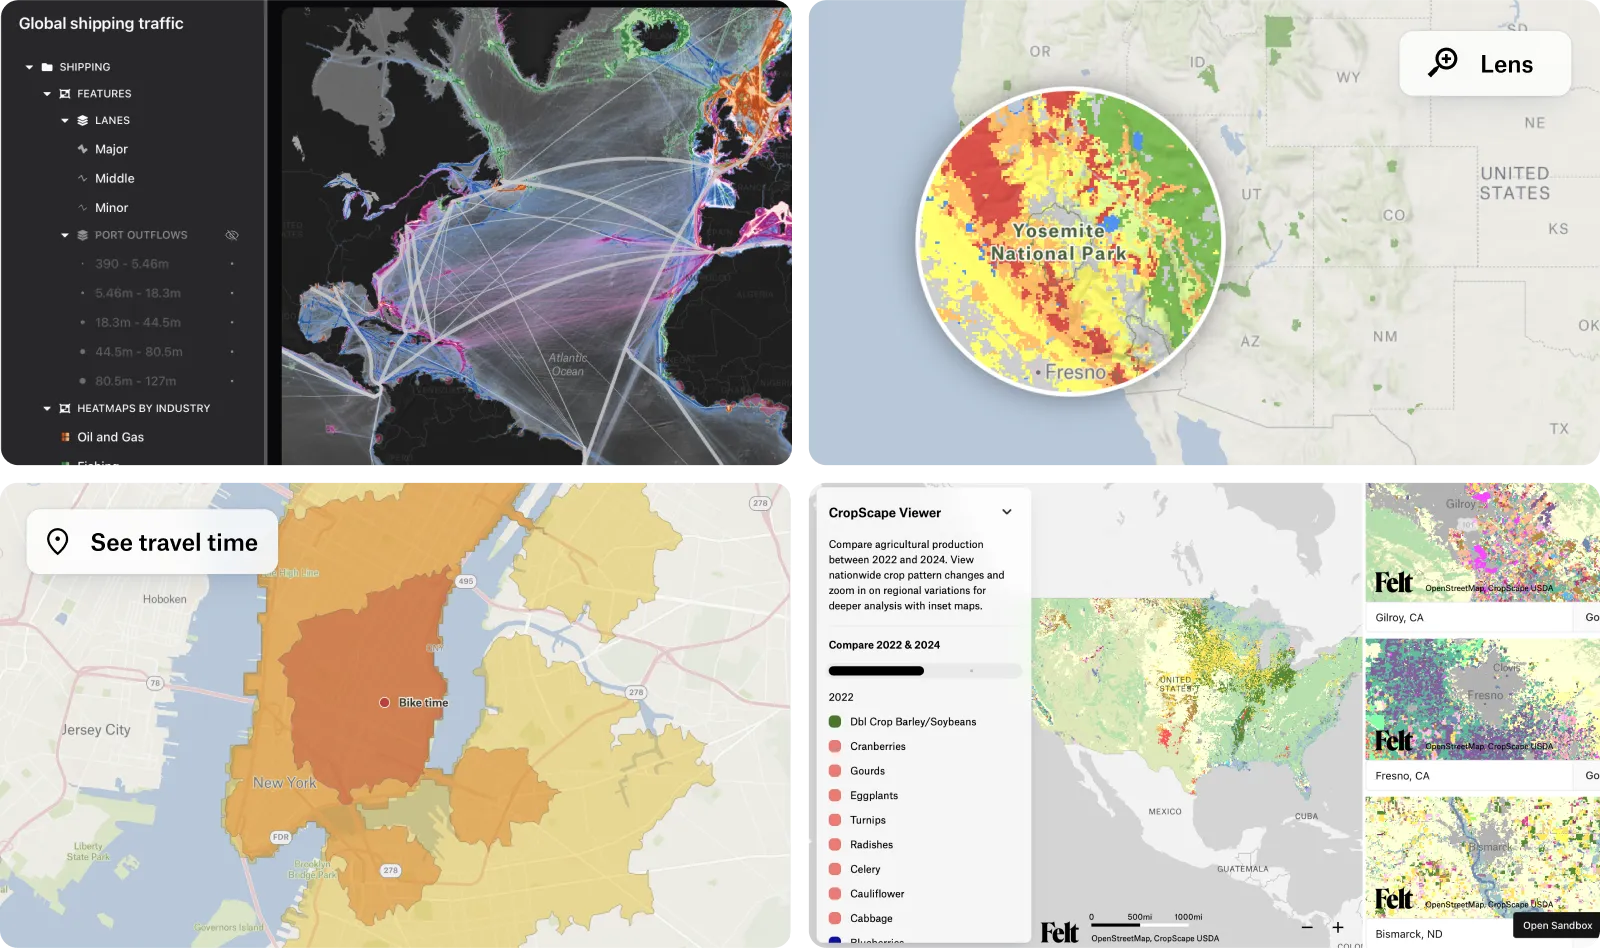
- [New] Add Layers - Now you can add GeoJSON layers to maps programmatically – even live layers! This is perfect for tracking real-time information like vehicle locations, weather patterns, or sensor readings
- [New] Stats API - Plug into the new stats API to pull raw statistical calculations and create powerful analytical visualizations with popular charting libraries like D3 and Recharts.
- [Enhanced] Layer Styling Properties for Custom Legends - Use layer styling properties to build custom legends. Create intuitive legend interactions like nested folders that help your users understand complex spatial data at a glance.
Visit our developer docs for a complete overview of JavaScript SDK API capabilities.
REST API
The Felt REST API enables you to integrate Felt's powerful mapping capabilities into your own workflows and pipelines from any environment that can send GET and POST requests. You are able to create and manipulate Maps, Layers, Elements, Sources, Projects and more. Today's major upgrades enable even more sophisticated backend workflows.
- [New] Project Management API - Move maps to projects or folders programmatically, enabling automated organization of your mapping assets.
- [New] Sources API - Programmatically create, read, update, list, sync and delete layers from your connected sources. This streamlines the process of keeping your maps in sync with external data sources.
- [Enhanced] Layer API - Set a schedule for layer refresh frequency, specify the geometry attribute to ensure your data is processed the way you want, and update layer metadata. These improvements give you precise control over how your data is displayed and updated.
- [Enhanced] Comment Workflows - Resolve and delete comments programmatically, and use webhooks to identify when a comment is created. These features enable better collaboration and communication around your maps.
- [Enhanced] Python SDK - Felt's Python SDK has been updated to support all new APIs and enhancements, making it easier to integrate Felt into your existing Python workflows.
Visit our developer docs for a complete overview of REST API capabilities.
Real World Applications
Example 1: Responsive Viewer Drawing Interactions

Build drawing interactions with a few lines of code. This example, built with React, allows users to draw polygons around areas of interest to instantly evaluate solar potential. By combining the SDK Draw API and Layer API, it leverages existing solar potential data from an Esri ArcGIS service to aggregate key metrics like total and usable rooftop area, potential system size, projected energy production, and annual cost savings for all buildings within the selected region. This drawn data workflow has been requested by users across several industries such as renewable energy, telecom and real estate where end users commonly need quick stats derived from a drawn input. Learn how to build these interactions in our upcoming webinar series.
Example 2: Interactive Charts & Dashboards

You no longer have to compromise performance or establish complex integrations when adding maps to business intelligence dashboards. The SDK's Stats API allows you to customize the look and feel of your dashboard by plugging into your favorite charting library, and providing the raw statistics that keep your map responsive and performant. Allow viewers to drill down into key KPIs while watching the map update instantly, providing a better understanding of the spatial implications. Whether you’re analyzing climate impacts, retail performance or transportation patterns, you can tap into any charting library to create visualizations needed. Dive in deeper into how to build these dashboards in our upcoming webinar series.
Build with Felt
With this release, it’s easier than ever to build mapping app interactions that used to take months of dev time. Check out our gallery of example apps and register for our upcoming developer webinar series to learn how organizations are accelerating mapping projects with Felt. Our team will showcase implementation techniques and answer your questions. Register below:
- April 23, 9-9:30am PST: Building Custom Dashboard Apps with Felt
- April 30, 9-9:30am PST: Creating Interactive Drawing Apps with Felt Developer Tools
- May 7, 9-9:30am PST: Using the REST API to Deliver Full Stack App Solutions
By simplifying the complex world of mapping technology, Felt enables teams to focus on solving business problems rather than wrestling with spatial infrastructure. Felt’s developer APIs are accessible on Felt’s Enterprise App Development plan. Reach out to sales to start building with our expanded APIs today and experience the difference for yourself.
Compare Felt using AI


.webp)