


Northern Arizona University's Ecosystem Science and Innovation Lab, with funding from the Arizona Board of Regents and residents of Arizona via the Technology Research Initiative Fund, has developed a cutting-edge real-time monitoring system for plant stress in Arizona by integrating satellite data (Planet SuperDove, Sentinel 2, Landsat, ECOSTRESS), ground observations, and advanced modeling techniques. For every 3m pixel across Arizona, they observe the daily change and gauge the health of the vegetation there with their custom stress index. The results of this analysis help to identify early warnings of plant stress due to drought, pests, or disease, and these insights help the public and the Arizona Department of Forestry and Fire Management (DFFM) better plan and take precise preventative action against wildfires.
Before the data can be utilized, it needs to be visualized. With 100s of terabytes of real-time pixels to share and limited capacity, the research team set out to build the EcoMonitor, a tool that would be purpose-built for the DFFM’s planning process and the public’s information. They needed a solution that would do three things:
To build a solution that met these requirements, the lab, in the School of Informatics, Computing, and Cyber Systems, would have needed to construct a tile server and frontend visualization experience, using an array of open source tools like GDAL, Rasterio, STAC, and Mapbox and tons of custom development—a process that would have required hundreds of thousands in investment and significantly more time to implement. With Felt, they could plug in their storage and start streaming directly into the browser where the data would be visualized instantly. After weighing options, the team chose Felt. “The choice was easy,” said Dr. Alexander Shenkin, Director of the Ecosystem Science and Innovation Lab, and project lead.
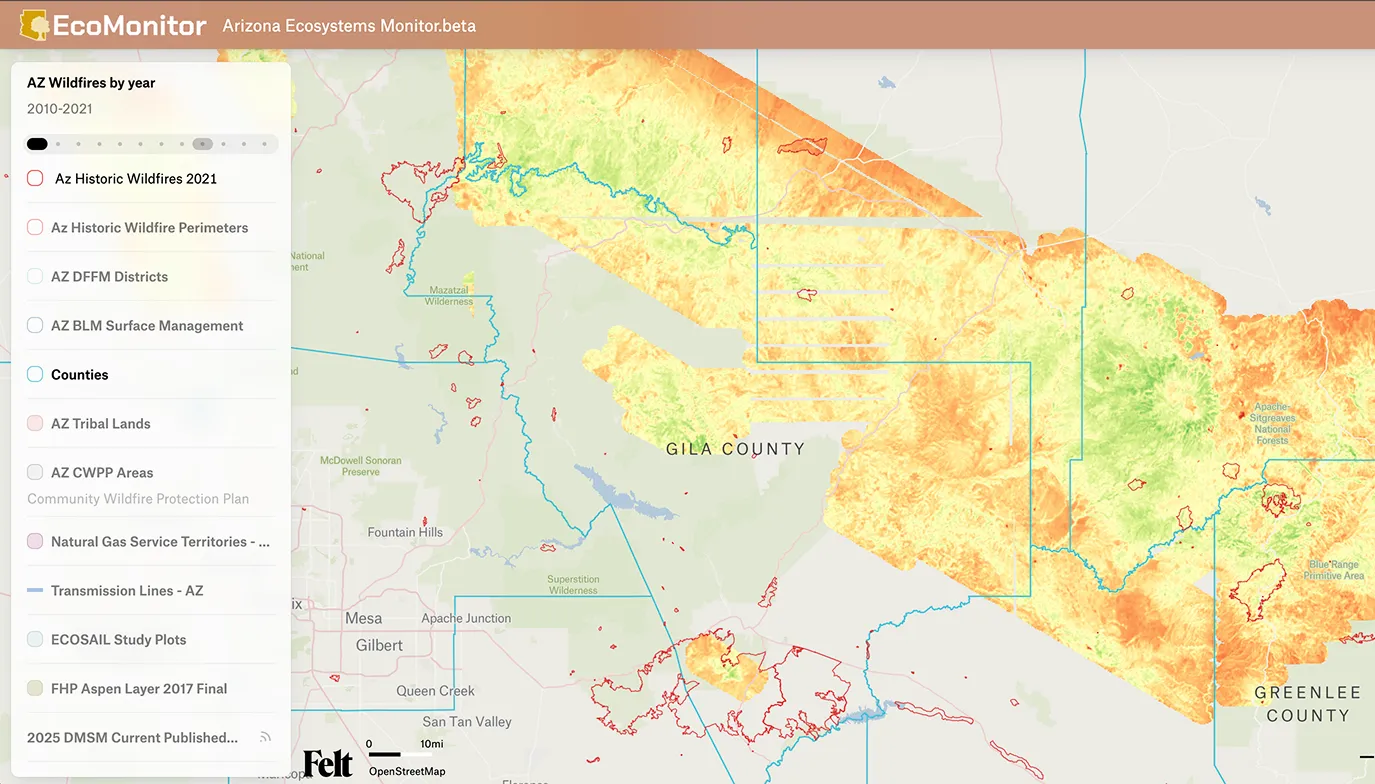
Northern Arizona University turned to Felt as their visualization platform of choice. The solution integrates multiple data layers, including Arizona Department of Forestry and Fire Management priority areas and a real-time stress index derived from satellite datasets trained on DFFM and field data. With Felt's STAC connectors, the team was able to plug their data directly into the platform. The raster styling capabilities allowed them to transform pixel data into striking visualizations without much infrastructure or frontend development. Most impressively, the user interface was successfully built in two weeks by the program’s Associate Director, Amy Wolkowinsky, a registered geologist with a masters degree, but no programming experience. Back end data processing systems were developed in parallel by their senior engineer, Revanth Reddy Munugala.
"With Felt's raster infrastructure solution, we eliminated a year of custom development and maintenance work," says Ms. Wolkowinsky. "Now we can stream terabytes of our model output data on critical plant stress into a dashboard where it’s instantly visualized for the teams at the Department of Forestry and Fire Management to take action.”
With Felt, Northern Arizona University was able to deploy the EcoMonitor faster than expected, using their existing team and budget efficiently. The EcoMonitor tool will enable Arizona forest managers to make data-driven decisions about forest health and fire management, with immediate potential to optimize aerial survey flight paths based on stress data.
“The early response from the Department of Forestry and Fire Management team we work with has been tremendous. They can finally access the powerful plant health information we’re able to generate with our models, but within the context of their own data and within an intuitive UI. It’s this combination that will lead to greater efficiencies and precision in planning, ultimately saving the state hundreds of thousands of dollars,” says Ms. Wolkowinsky.
They plan on extending this system across western states, the US writ large, and internationally once the concept has been proven in Arizona, says Dr. Shenkin.
