37° 48' 15.7068'' N, 122° 16' 15.9996'' W
MODERN MAP MAKING HAS ARRIVED
37° 48' 15.7068'' N, 122° 16' 15.9996'' W
MODERN MAP MAKING HAS ARRIVED
37° 48' 15.7068'' N, 122° 16' 15.9996'' W
MODERN MAP MAKING HAS ARRIVED
37° 48' 15.7068'' N, 122° 16' 15.9996'' W
MODERN MAP MAKING HAS ARRIVED
37° 48' 15.7068'' N, 122° 16' 15.9996'' W
MODERN MAP MAKING HAS ARRIVED
37° 48' 15.7068'' N, 122° 16' 15.9996'' W
MODERN MAP MAKING HAS ARRIVED
37° 48' 15.7068'' N, 122° 16' 15.9996'' W
MODERN MAP MAKING HAS ARRIVED
37° 48' 15.7068'' N, 122° 16' 15.9996'' W
MODERN MAP MAKING HAS ARRIVED
37° 48' 15.7068'' N, 122° 16' 15.9996'' W
MODERN MAP MAKING HAS ARRIVED
37° 48' 15.7068'' N, 122° 16' 15.9996'' W
MODERN MAP MAKING HAS ARRIVED
Maps
Product
Felt for advocacy groups: mapping traffic violence in Oakland
Bryan Culbertson and Kuan Butts, two activists working on Traffic Violence Rapid Response, leverage Felt maps to advocate for safer streets in Oakland.

This case study focuses on the challenges faced by Traffic Violence Rapid Response and the ways the team leveraged Felt's collaborative features and intuitive interface to document fatalities and propose solutions.

Understanding Traffic Violence in Oakland

In June 2022, a cyclist named Jonathan Waters was killed by a speeding driver while making a turn on Shattuck Street in Oakland, CA. Together with their peers, Bryan Culbertson and Kuan Butts formed a group in response to Waters’ tragic death. Recognizing the frequency of such incidents, they wanted to raise awareness about the issue and urge the city to take action. As the team organized vigils and gathered data on collisions, they realized they needed a systematic approach to address traffic violence in Oakland.

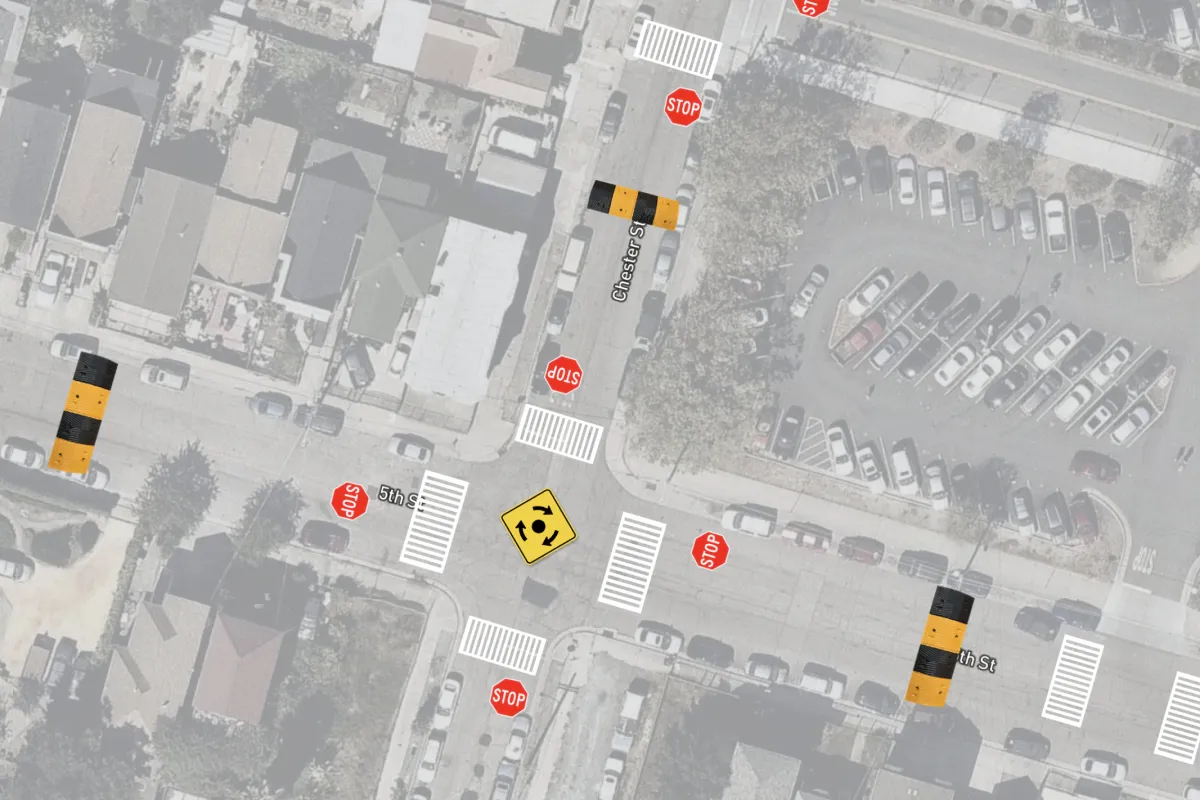
To show that Jonathan's death was not an isolated incident, the TVRR team turned to Felt. “To start up the project, I decided to map collision data in Oakland,” says Bryan Culbertson. He used The Transportation Injury Mapping System (TIMS) dataset that shows collisions recorded by the local police. “They don’t have a geospatial export feature, so if I used any other mapping software, I would have to write a parser for the CSV and then convert it into GeoJSON, but with Felt, I just dragged it into the screen and immediately saw where all the data points were,” adds Culbertson.

Then Culbertson added layers from Oakland Open Data portal so the viewer can see neighborhood boundaries, bike lanes, parks, and council districts. “I could put all of those on the same map without having to write any of my own data processing, and that was really useful,” he adds.

Effective Advocacy

Traffic Violence Rapid Response used Felt for presenting data to Oakland council members, so they could follow along during presentations and access the data afterwards. “This Felt map was useful because we presented it to council members so that they would know what was going on in their district,” adds Bryan. During the presentation, the council member could follow along, and then they were able to access data on their own with a single link.

“I think it helps show the scale of the problem — you can see that it's undeniable when you show a particular district, you can see the degree of coverage that these severe accidents and deaths have,” adds Kuan Butts. The TVRR team also shared the map on their website — the ease of sharing and the ease of exploration helped the group to advocate for change in their local community.

Collaborating with the Local Community

TVRR also leveraged Felt for collaborative mapping. The group created a proposal for a crosswalk near Oakland Technical High School because several students were hit by a car there. Bryan and Kuan led a brainstorming session to figure out the best ways to help out students and used Felt as a shared team space. They invited other TVRR members to the map, and then everyone could see each others cursors. “We were able to collaboratively come to an understanding of exactly where we were talking about and what changes we were proposing,” says Culbertson.

TVRR Team used faded satellite basemap from Mapbox and Felt elements to map road signs and pedestrian crossings in South Prescott neighborhood of Oakland.

Looking ahead, the team aims to expand their mapping efforts and try Felt's new commenting feature for gathering community feedback and drive public engagement as the group is working on South Prescott Traffic Calming Plan.

TVRR impact

The use of Felt in addressing traffic violence had significant impacts. Council members prioritized traffic violence in their budgets, reflecting the awareness raised by TVRR. Additionally, the mapping and advocacy work contributed to the approval of interventions — for example, a new bus lane separation on International Boulevard, one of the most dangerous streets for pedestrians in Oakland.

Felt's collaborative features and intuitive UI proved instrumental in addressing the challenge of traffic violence and advocating for safer streets in Oakland. With Felt, Bryan, Kuan, and their team were able to create and share informative maps, engage stakeholders effectively, and drive positive changes in their city.

“We presented our Felt map to council members so that they would know what was going on in their district.”
Bio
LinkedIn
More articles

Cartography Tips for Designing Web Maps

Search, filter, select — data discovery done right

Getting the most out of Felt’s new Workspaces

Teaching Spatial Analysis with Felt

Powerful new admin tools and a streamlined billing experience

Three key UI upgrades in Felt 2.0