Felt is continuing to deliver on our promise to be the best place to make a map on the internet. Part of that promise is giving users fast and efficient ways to take their data and design beautiful maps with it. Today we are launching Felt Style Language, an intuitive styling grammar that gives our users a massive amount of map design flexibility.
While many mapping languages exist, they can be complex to learn and frustrating to use. When our team sat down to create Felt Style Language, we knew we wanted to build something that enabled our users to stay focused on the powerful story they are telling, without getting lost in code complexity. Here’s what makes Felt Style Language stand out:
- Everyone can understand the properties; no mapping expertise needed.
- You don’t have to be a cartographer to have a great looking map — cartographic design best practices are built-in.
- No custom filtering syntax–simply filter using mathematical filter expressions.
- Legends are generated automatically and update as you build your style.
- Popups are fully editable through details definition.
Keep reading to learn more about what makes Felt Style Language uniquely powerful and fun to use.
How Felt Styles Work
A Felt Style defines what data to draw, how to draw it, and in which order. It also defines how the data should be displayed in the legend and which attributes are shown when clicking a map item.
Felt Style Language is launching with two visualization types: simple and categorical. This is just the beginning. We are continuing to add exciting and intuitive design functionality every day.
Defining a Simple Style
Simple visualizations are those that show each feature in a dataset using the same style.
This is a similar style to the one you get when you upload a dataset to Felt and the map it produces:
This example allows us to describe the five main elements of a Felt Style Language visualization:
- <p-inline>type<p-inline>: Which defines the type of visualization you're applying to your map;
- <p-inline>config<p-inline>: Which contains a number of configuration options that apply to the given visualization type;
- <p-inline>style<p-inline>: Which describes how the data should be displayed on the map;
- <p-inline>label<p-inline>: Which describes how the data should be labeled;
- <p-inline>legend<p-inline>: Which describes how the legend should be shown. Notice that there aren’t any style options here. In order to create a good legend, item types and colors are inferred automatically from the other fields in the Felt Style definition.
Defining a Categorical Style
Categorical visualizations define a categorical attribute and a set of values to apply to each one of the different values of that attribute.
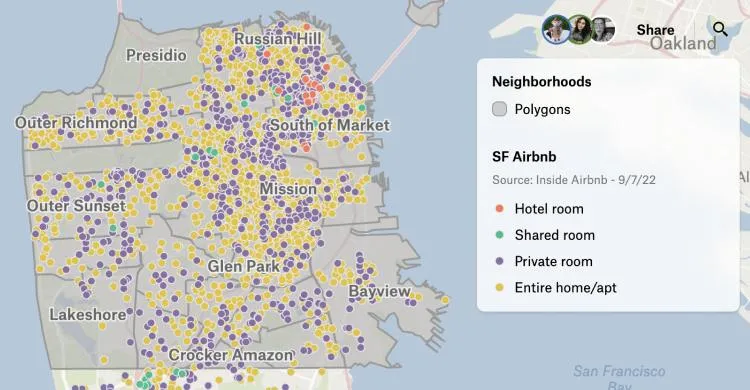
This example shows how easily we can define a categorical map:
- <p-inline>Type<p-inline> is set to <p-inline>categorical<p-inline>.
- The <p-inline>config<p-inline> block describes which <p-inline>attribute<p-inline> and <p-inline>categories<p-inline> we want to style on the map. By changing the order of the values in <p-inline>categories<p-inline> we are both defining how the legend should look like and the drawing order of <p-inline>categories<p-inline>. In this example, hotel rooms are rendered on top of shared rooms which are rendered on top of private rooms and entire home and apartments.
- The <p-inline>style<p-inline> and <p-inline>label<p-inline> blocks can contain the same properties as before but we can define a value for each category instead of a single one. When that happens, the first value is mapped to the first category, the second value to the second category, and so on.
Cartographic Best Practices, Built In
Simple and categorical styles’ defaults have cartographic best practices built in, saving users countless hours of design decisions. These defaults were established by Felt's in-house cartographer and ensure that no matter what data you bring into Felt, it will look great from the start.
One example of cartographic defaults at work is the proper size of point data at different zoom levels. Map makers spend countless hours struggling to correct fixed point sizes that are either too small when zoomed in, making them difficult to see, or too big when zoomed out, covering most of the map. This doesn’t happen in Felt:
If you add a point dataset and write a Felt Style that doesn’t contain the <p-inline>size<p-inline> property you will see that points grow bigger when zooming in and shrink when zooming out. Our cartographic defaults do the work for you. It’s not only <p-inline>size<p-inline> though, <p-inline>strokeWidth<p-inline> and <p-inline>fontSize<p-inline> are some of the other properties that adhere to cartographic best practices.
Felt Styles go a step further — we have a default layering order that ensures your map data will look great out of the box. As explained in this post, the visual hierarchy is an important part of what makes a map a beautiful map. With that in mind, by default, Felt renders points on top of lines and lines on top of polygons.
Finally, we've surfaced cartographic effects that historically have been hard to achieve, bringing them to the surface ensuring that even those with no cartographic expertise can still easily deliver a great looking map. For example, Felt Styling Language makes it easy to render important contextual information atop polygon data, rather than requiring the user to learn and apply this cartographic effect. In the map below, water bodies and roads appear atop neighborhood polygons.
Filtering Made Easy
One of the most complex aspects of other mapping languages is mastering custom filtering syntaxes. We want filtering to be easy for everyone to learn and apply to their map data in Felt. Rather than create a complex new syntax, we’ve simplified filtering by using mathematical language to describe filters.
Felt supports three different types of filters to allow you to create better styles:
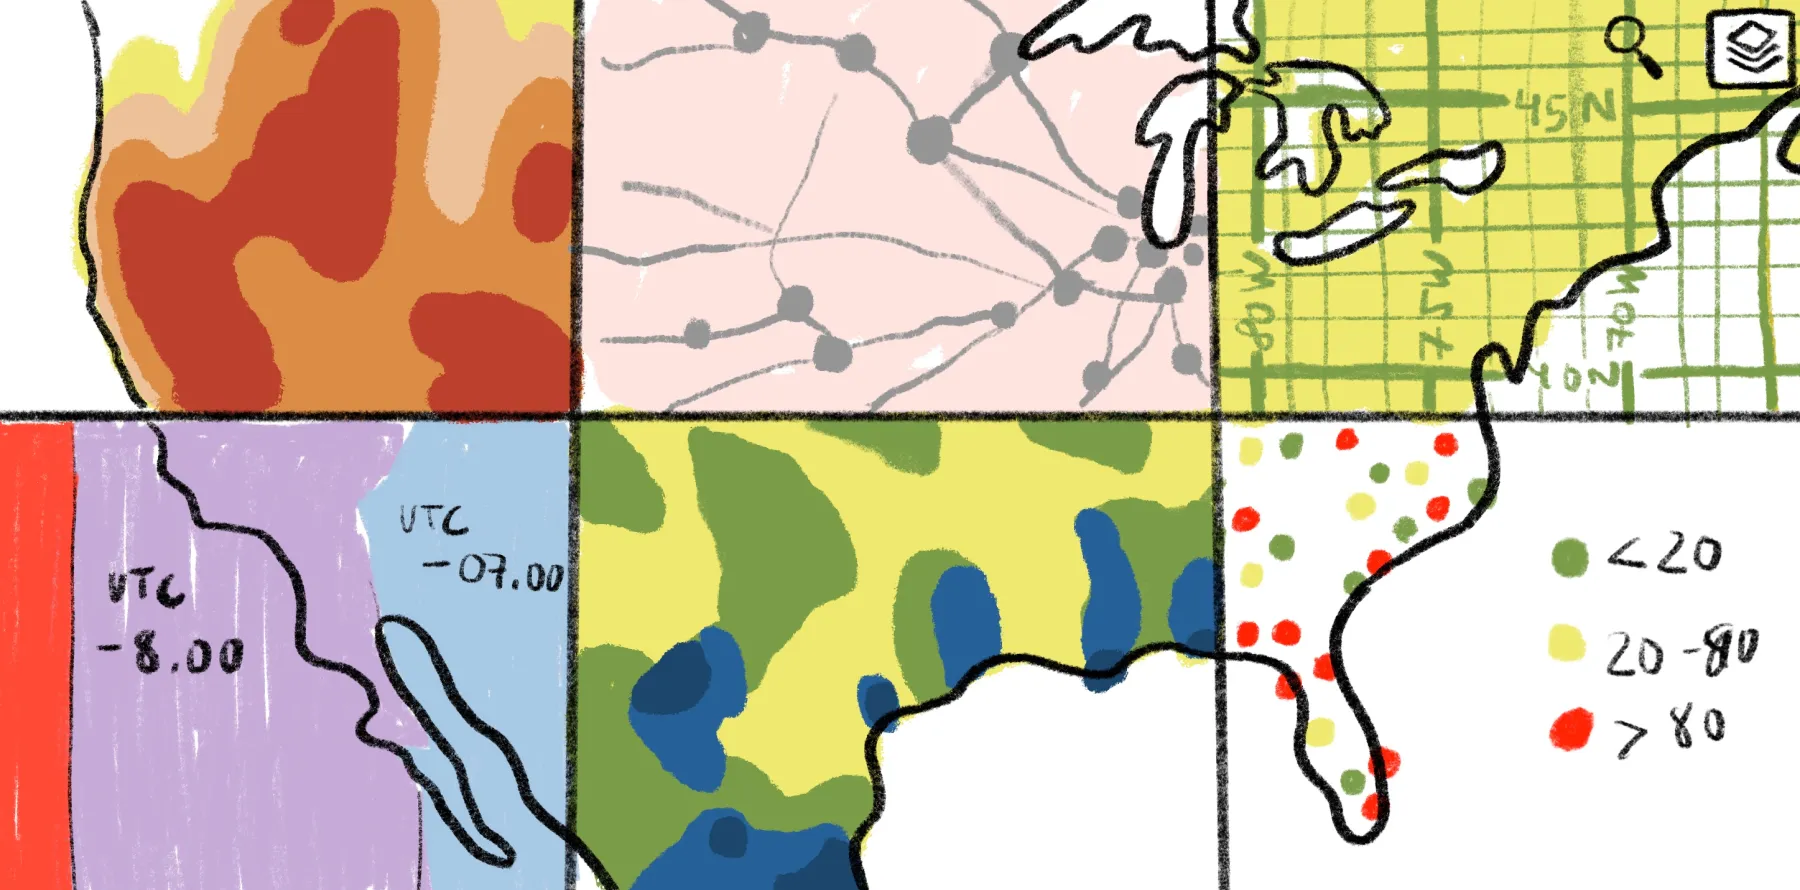
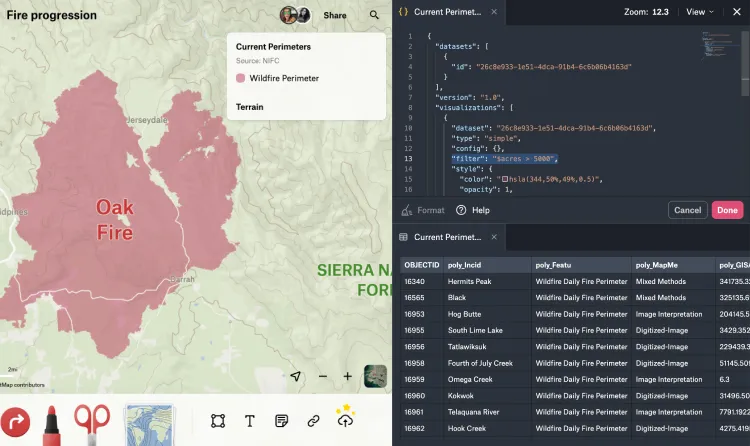
- Data filters: These are filters that apply to all the data a visualization applies to. <p-inline>$acres > 50000<p-inline> for example filters out all the items that contain a value in their <p-inline>acres<p-inline> attribute that’s less than <p-inline>50000<p-inline>. These filters allow you to create visualizations that apply only to subsets of your dataset.
- Zoom-based filters: These filters allow you to define the style of the data depending on the map’s zoom. A filter like <p-inline>6-8 : $acres >50000<p-inline>, <p-inline>9-20: $acres > 500<p-inline> will show the subset of items that have an <p-inline>acres<p-inline> value bigger than <p-inline>50000<p-inline> on zooms between <p-inline>6<p-inline> and <p-inline>8<p-inline>, and the subset of items that have an acres value bigger than <p-inline>500<p-inline> on zooms between <p-inline>9<p-inline> and <p-inline>20<p-inline>. These filters allow you to introduce items across multiple zoom levels giving importance to what really matters at each zoom level.
- Data-driven properties: These kind of filters allow you to define style values depending on a value of the map item being rendered. A data-driven property defined like <p-inline>$acres < 50000: 10<p-inline>, <p-inline>$acres > 50000: 25<p-inline> will set a style value to <p-inline>10<p-inline> if the map item being rendered has an <p-inline>acres<p-inline> value lower than <p-inline>50000<p-inline> and to <p-inline>25<p-inline> if the map item being rendered has an acres value higher than <p-inline>50000<p-inline>.
Automatically Generated Legends
Legends are an important part of a map: they explain what the symbols on the map mean and allow you to make sense of the data on display. Felt automatically generates legends for you using the defined style and geometry type of your dataset. In case you want to change them, the Felt Style Language also includes some options to customize how those legends are generated.
Editable Popups
All items in your layers are selectable and show their properties when selected but what if you want only to show some of them? Or what if you want to change the format of some of their values? Well, you can also do that with the Felt Style Language.
.webp)
The item details you see on the right are defined with just this snippet:
Just the Start of Styles
While accessible and fun, Felt Style Language is powerful and opens up endless map and data design possibilities. These highlights showcase only a fraction of its capabilities — and this is just the beginning. We will continue to expand the Felt Style Language visualization types for our users. We cannot wait to see what you are able to accomplish with it.
Compare Felt using AI