

.webp)
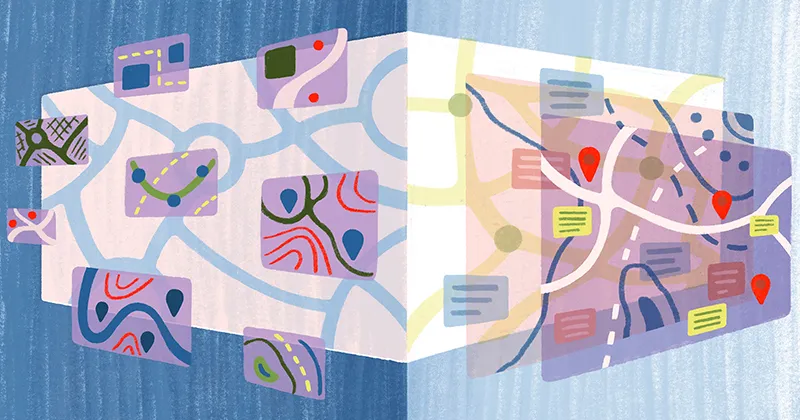
Felt’s interactive maps can be very performance-intensive, rendering thousands of elements on-screen at once. The fast performance of complex maps is one of the things our users love, and we pride ourselves on, and it’s one reason we recently switched our map element rendering from using SVGs with React, to using Canvas.
In this post, we’re going to explain:
- the problems we faced with SVG rendering
- how we went about the switchover
- some of the performance optimizations we use
- results showing the gains we achieved
This is the first part of a two-part series explaining Felt’s switch from SVGs to Canvas. Part 1 is focused on rendering and performance improvements. Part 2 dives into how we wrote an entirely new interaction handling system that lets us handle interactions on the canvas.
SVG: the OG of element rendering
Until now, we rendered our elements using a combination of SVGs (for things like polygons, lines, and routes) and DOM elements (for text, notes, links, and pins). This was all managed via React using an element structure roughly like this:
Each of those components would include some combination of rendering ability and interactions in the form of event handlers attached to DOM nodes. Then, whenever the element’s coordinates or the viewport changed, we would re-render the element.
That’s the theory at least, although as is the case with real-world applications, things tend to get a little more complicated.
Performance tricks and struggles
Asking React to create, diff, reconcile and update thousands of elements on every move of the mouse when panning or zooming the map gets slow, so we started to employ a series of tricks to get around this problem.
The most effective is to only ask React to re-draw map elements when the map viewport “settles”; that is when a pan, zoom, or fly-to was completed. In the intervening time, we would simply transform and scale the existing rendered elements to avoid the heavy work of re-drawing everything.
This is akin to animating a cartoon with animation cels. You can reuse parts that haven’t changed, meaning you don’t have to re-draw everything all the time.
This works quite well to improve speed, but still has problems, such as a very uneven performance profile. Dragging on panning was fast, until you stopped, at which point the map would redraw and could cause a noticeable delay.
Zooming with the mouse wheel or trackpad can lead to enormous differences in zoom levels and leave nasty visual artifacts. It may occur for just a fraction of a second, but it is still noticeable and jarring.
You also get other visual artifacts such as elements flickering when zooming out. This happens a lot on larger maps as the browser starts to exhaust GPU memory as it desperately tries to make sense of this constantly-changing document it’s being asked to draw.
Aside from rendering the raw element geometry, we render other things like selection frames, transform controls, control points and multiplayer presence frames. These things start to mount up, and cause some very uneven performance profiles.
For instance when you use Select All to select 1000 elements, React has to manage the addition of many thousands of SVGs to render everything we need, and sets up many thousands of event handlers.
We started to employ more and more React “tricks” to avoid re-renders, but these tricks start to give diminishing returns, at the same time adding more complexity to the code.
It’s worth remembering at this point that the DOM really isn’t designed for this kind of application, even though browsers do a very good job of it generally.
We decided that we should give Canvas rendering a try to see how it performed, and we ultimately ended up rewriting almost the entire elements system in the process.
Preparing for a big change
Although this was a big change, there are a number of things we had in place before we started that made it less risky than a traditional “rewrite”. In fact, it didn’t feel much like a rewrite at all because of these things.
Feature flags
In order to be able to integrate the code into the codebase continually, we have feature flags that let us switch certain features on and off for certain users. We also have added a client-side switch that let us quickly switch between Canvas and DOM rendering so we could compare the visuals and behavior manually.
End-to-end tests
We have a comprehensive suite of end-to-end tests, written in Playwright. These cover the core element interactions in Felt like creating, editing, and deleting each element type, as well as some more specific, edge-case tests.
Fortunately, the vast majority of these tests were written without relying on specific DOM elements. Instead, they interacted with the map based on pixel positions on screen.
We used the feature flags to run the end-to-end tests against the DOM and Canvas versions so we knew we hadn’t broken anything, and knew what was still left to implement.
Performance benchmarks
We also use Playwright to run a battery of performance benchmarks that interact with obscenely complex maps, testing the performance to its fullest. This gives us an insight as to which elements have the largest effect on performance, and which interactions.
For each element type, we have benchmarks that cover:
- panning with the mouse
- panning programmatically (what we call a “fly-to”)
- zooming from high, medium and low zoom levels
- selecting and moving
And for each benchmark, we record the average FPS along with the 0th, 50th, 95th, and 100th percentiles for frame duration. This gives us a very detailed insight into the performance profile of each test.
These are run on every merge to main, and we also get high-level reports where we amalgamate the metrics into high-level performance scores. We can also run these against any PR commit by including <p-inline>bench<p-inline> in the commit message.
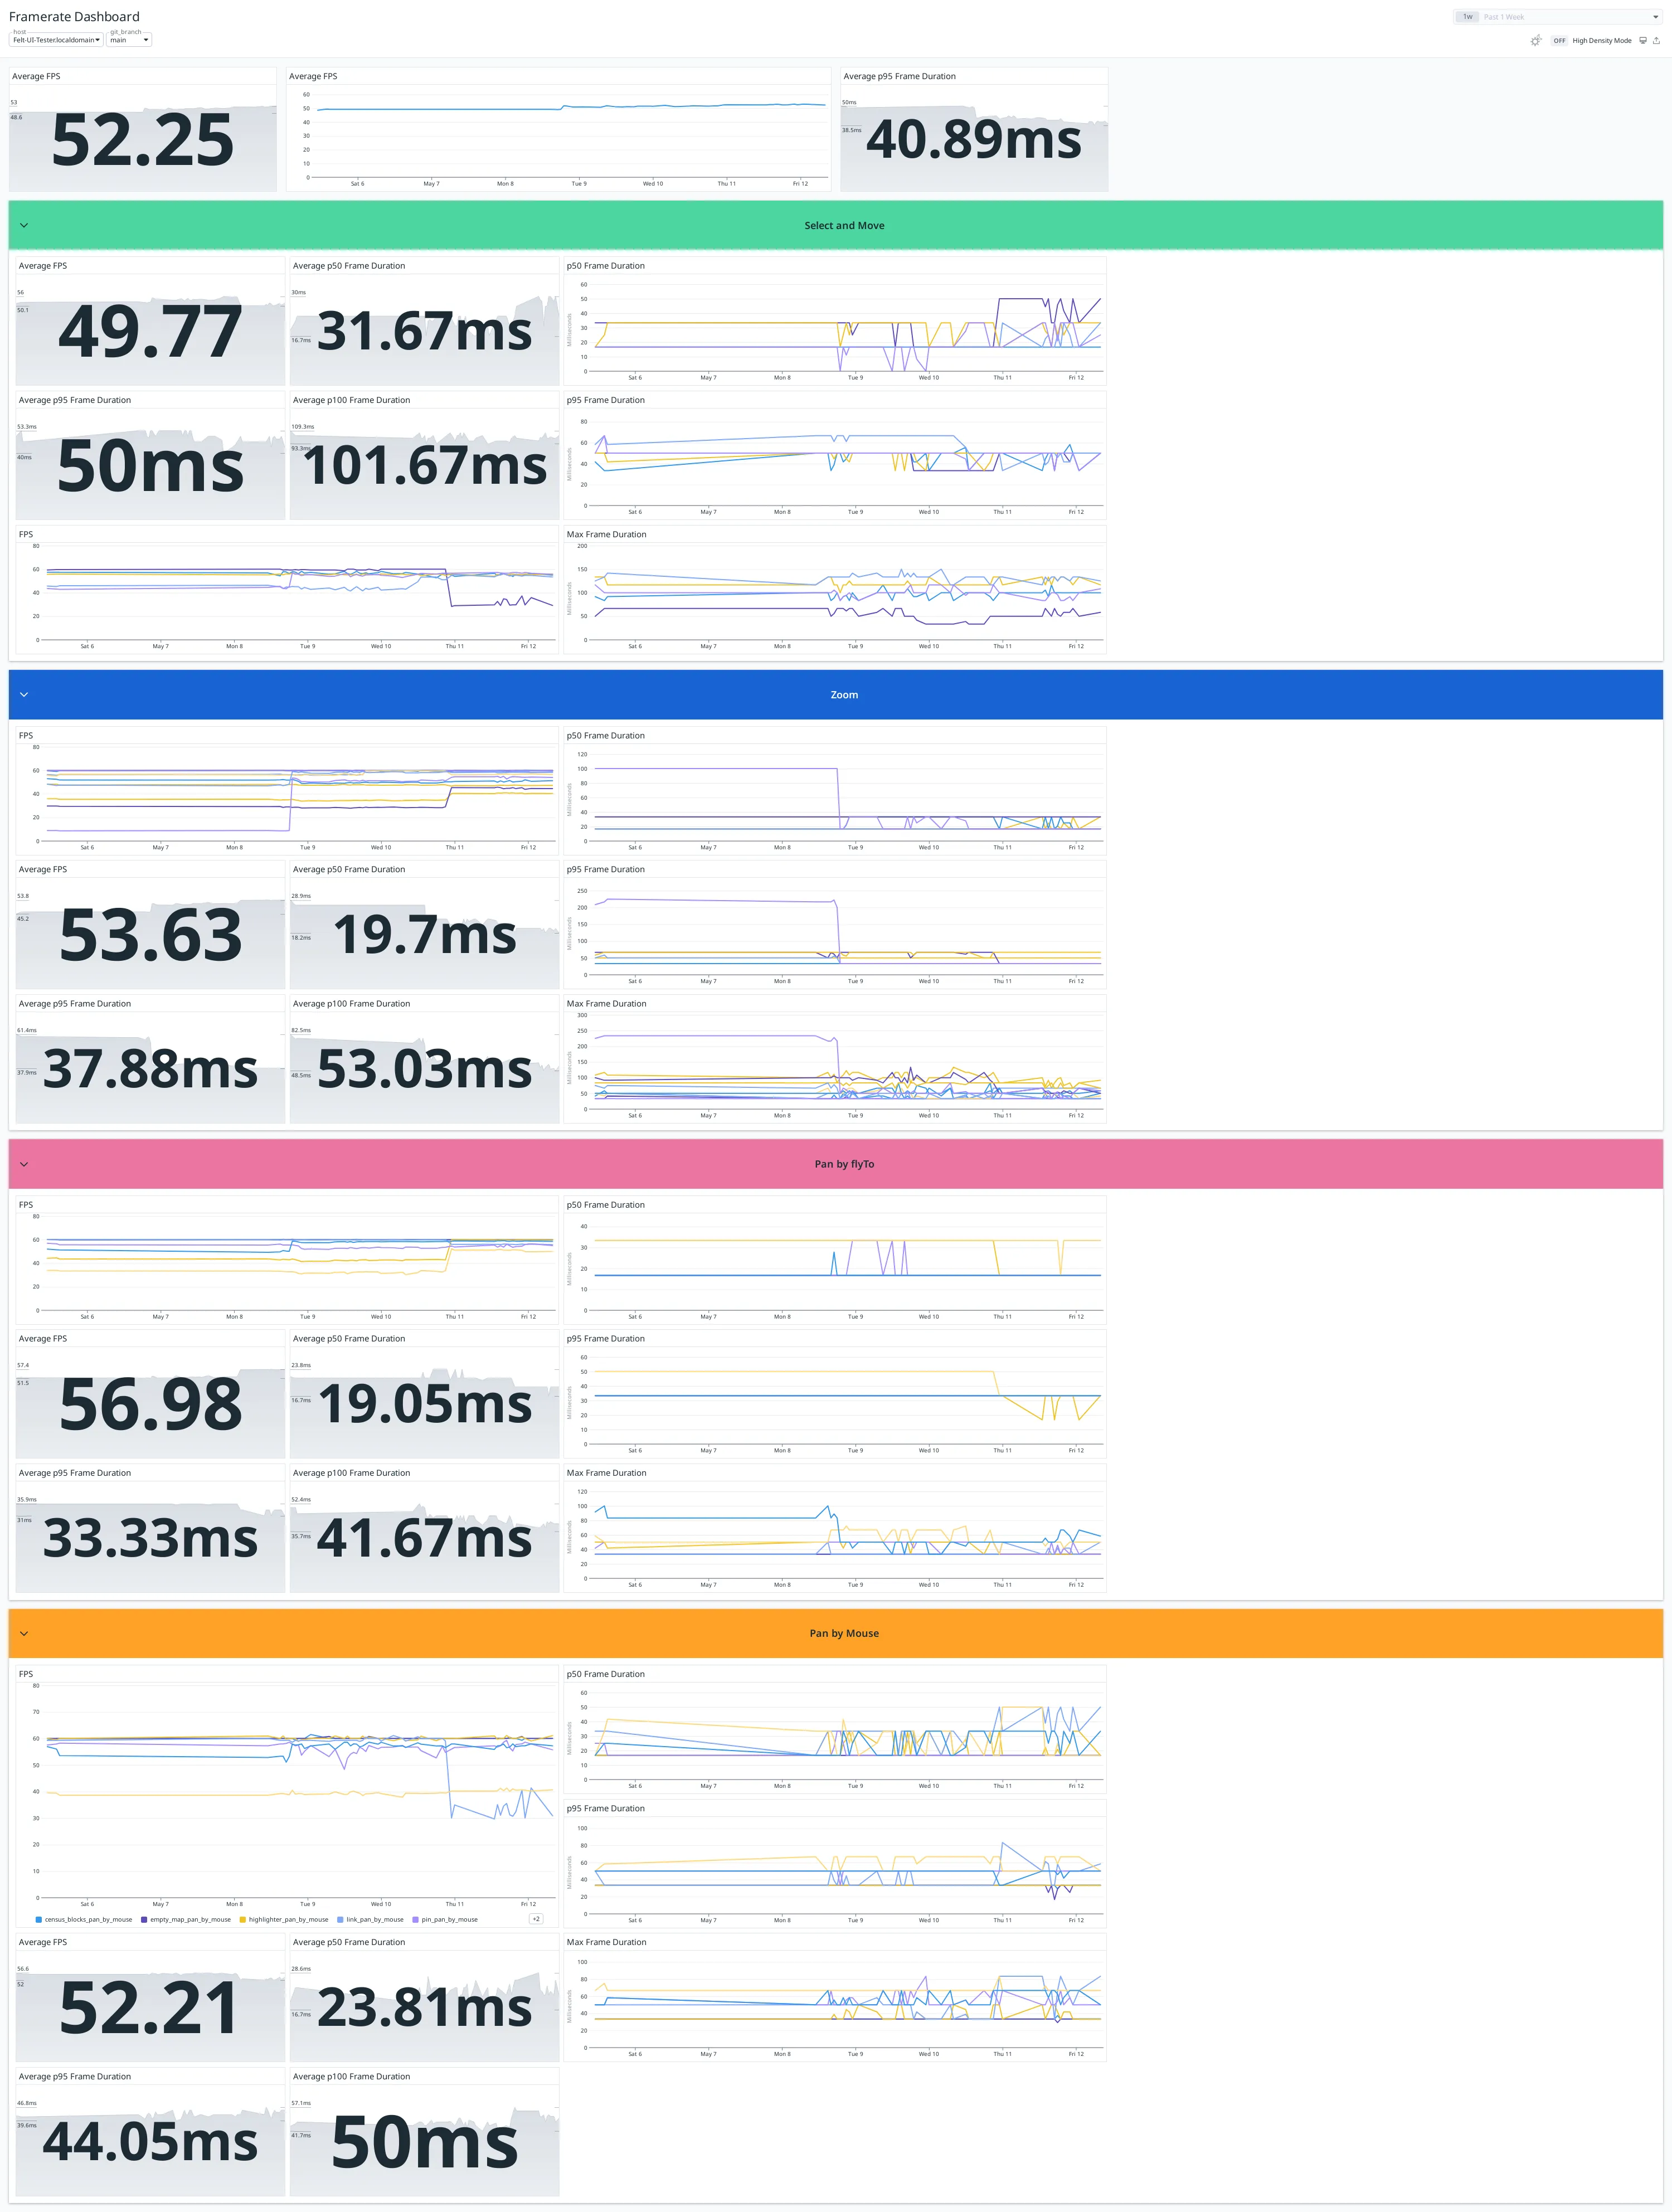
Here, you can see metrics and charts showing average frame rates and frame duration percentiles, grouped into overall (the top section), select and move, zoom, pan by fly-to, and pan by mouse.
In this screenshot, you can see a fairly broad performance improvement around halfway along the charts, and then a more complex one around three-quarters the way along where some metrics improved and some degraded.
Any regression or unexpected change is investigated by looking at the PR that introduced it.
Sometimes the answer isn’t clear-cut and we have to evaluate the trade-offs involved; we may permit a performance drop for an uncommon element in exchange for an improvement in a common element, for instance.
Supporting code
A lot of the things we need to render geographic elements on screen are not SVG-specific, so there was a lot of code that could be re-used. Some examples include:
- spatial indexes for fast spatial querying
- projections from world to screen space and vice versa
- geometry simplification
- calculating derived geometry (such as padded polygons, bounding boxes, etc.)
With all those things in place, we were in a good position to switch over.
How does Canvas rendering compare?
We started by looking at two of the slowest parts of Felt – pin rendering and large selections – to see how Canvas rendering compared.
Canvas rendering works very differently to the DOM and React. Instead of trying to get fast performance by avoiding redrawing things like a cartoon cel animation, the canvas redraws everything from scratch on every frame, like a painter with a brush with a blank canvas every time.
This sounds like it would be slower, but the canvas is very fast at drawing, as we shall see.
Pins
These are the most commonly-used element type in Felt, and were also one of the slowest, due to a strange quirk with how browsers deal with our SVG setup.
The browser was trying to be helpful by “grouping” pins together to try to avoid redrawing. But when you zoom in and out, those layers have to constantly be redrawn, because all the pins are moving relative to each other, which doesn’t happen with panning.
After implementing a basic proof-of-concept for canvas-rendered pins, we got our first benchmark results.
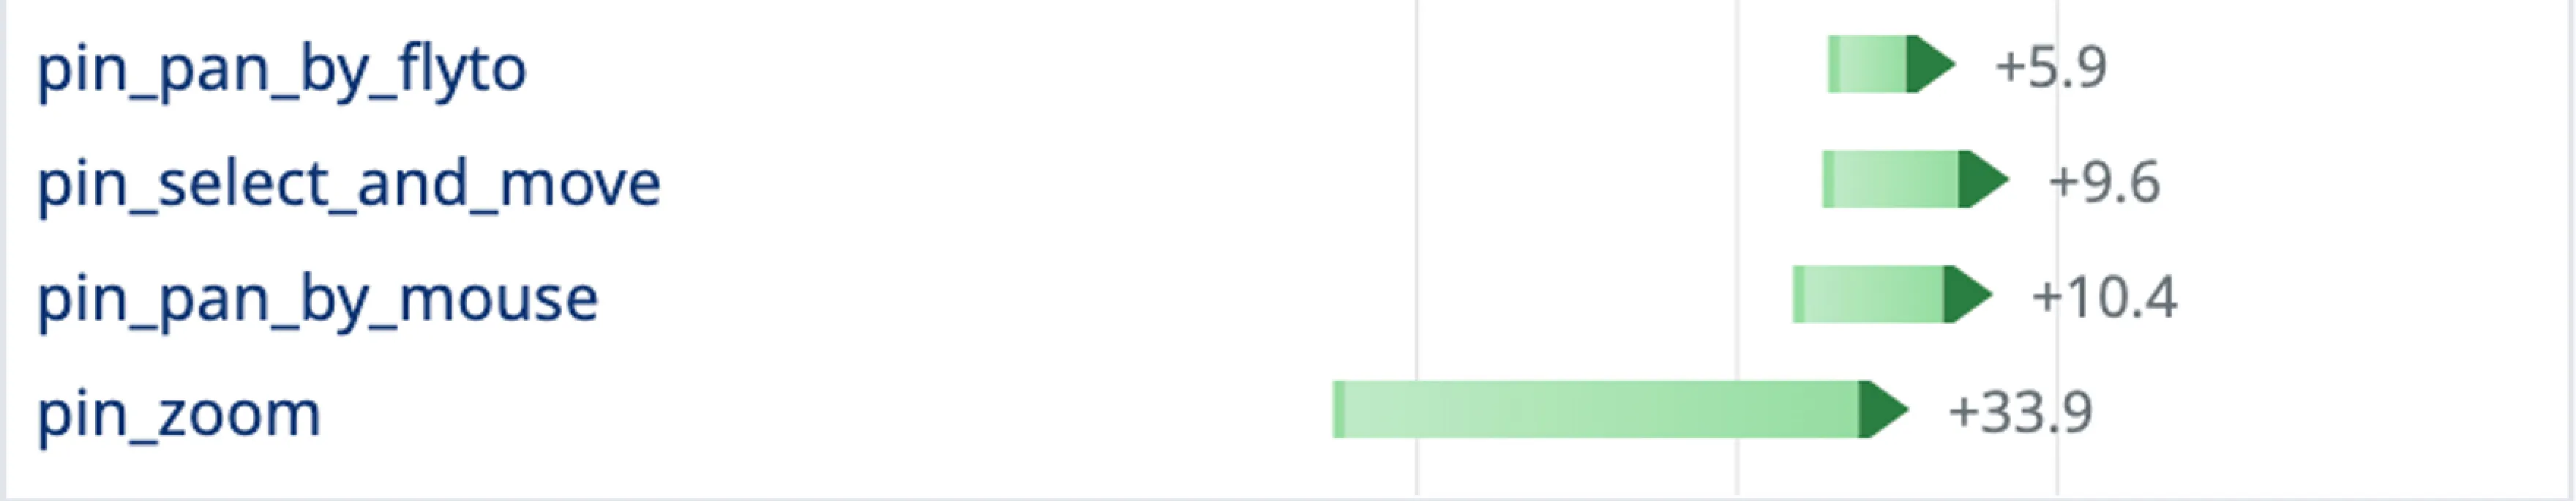
You can immediately see from this chart of FPS changes that this is an improvement! And, you can see particularly that the zooming issue is much improved.
Large element selections
As we mentioned earlier, large selections are slow with the SVG renderer, because there is a lot of overhead in drawing the selections in SVGs.
With the canvas, because there is no “bookkeeping” required to manage what is mounted in the DOM, reacting to changes in selections is much faster.
The following chart shows the approximate time taken when we do a Select All for all the pins in the pin benchmark.
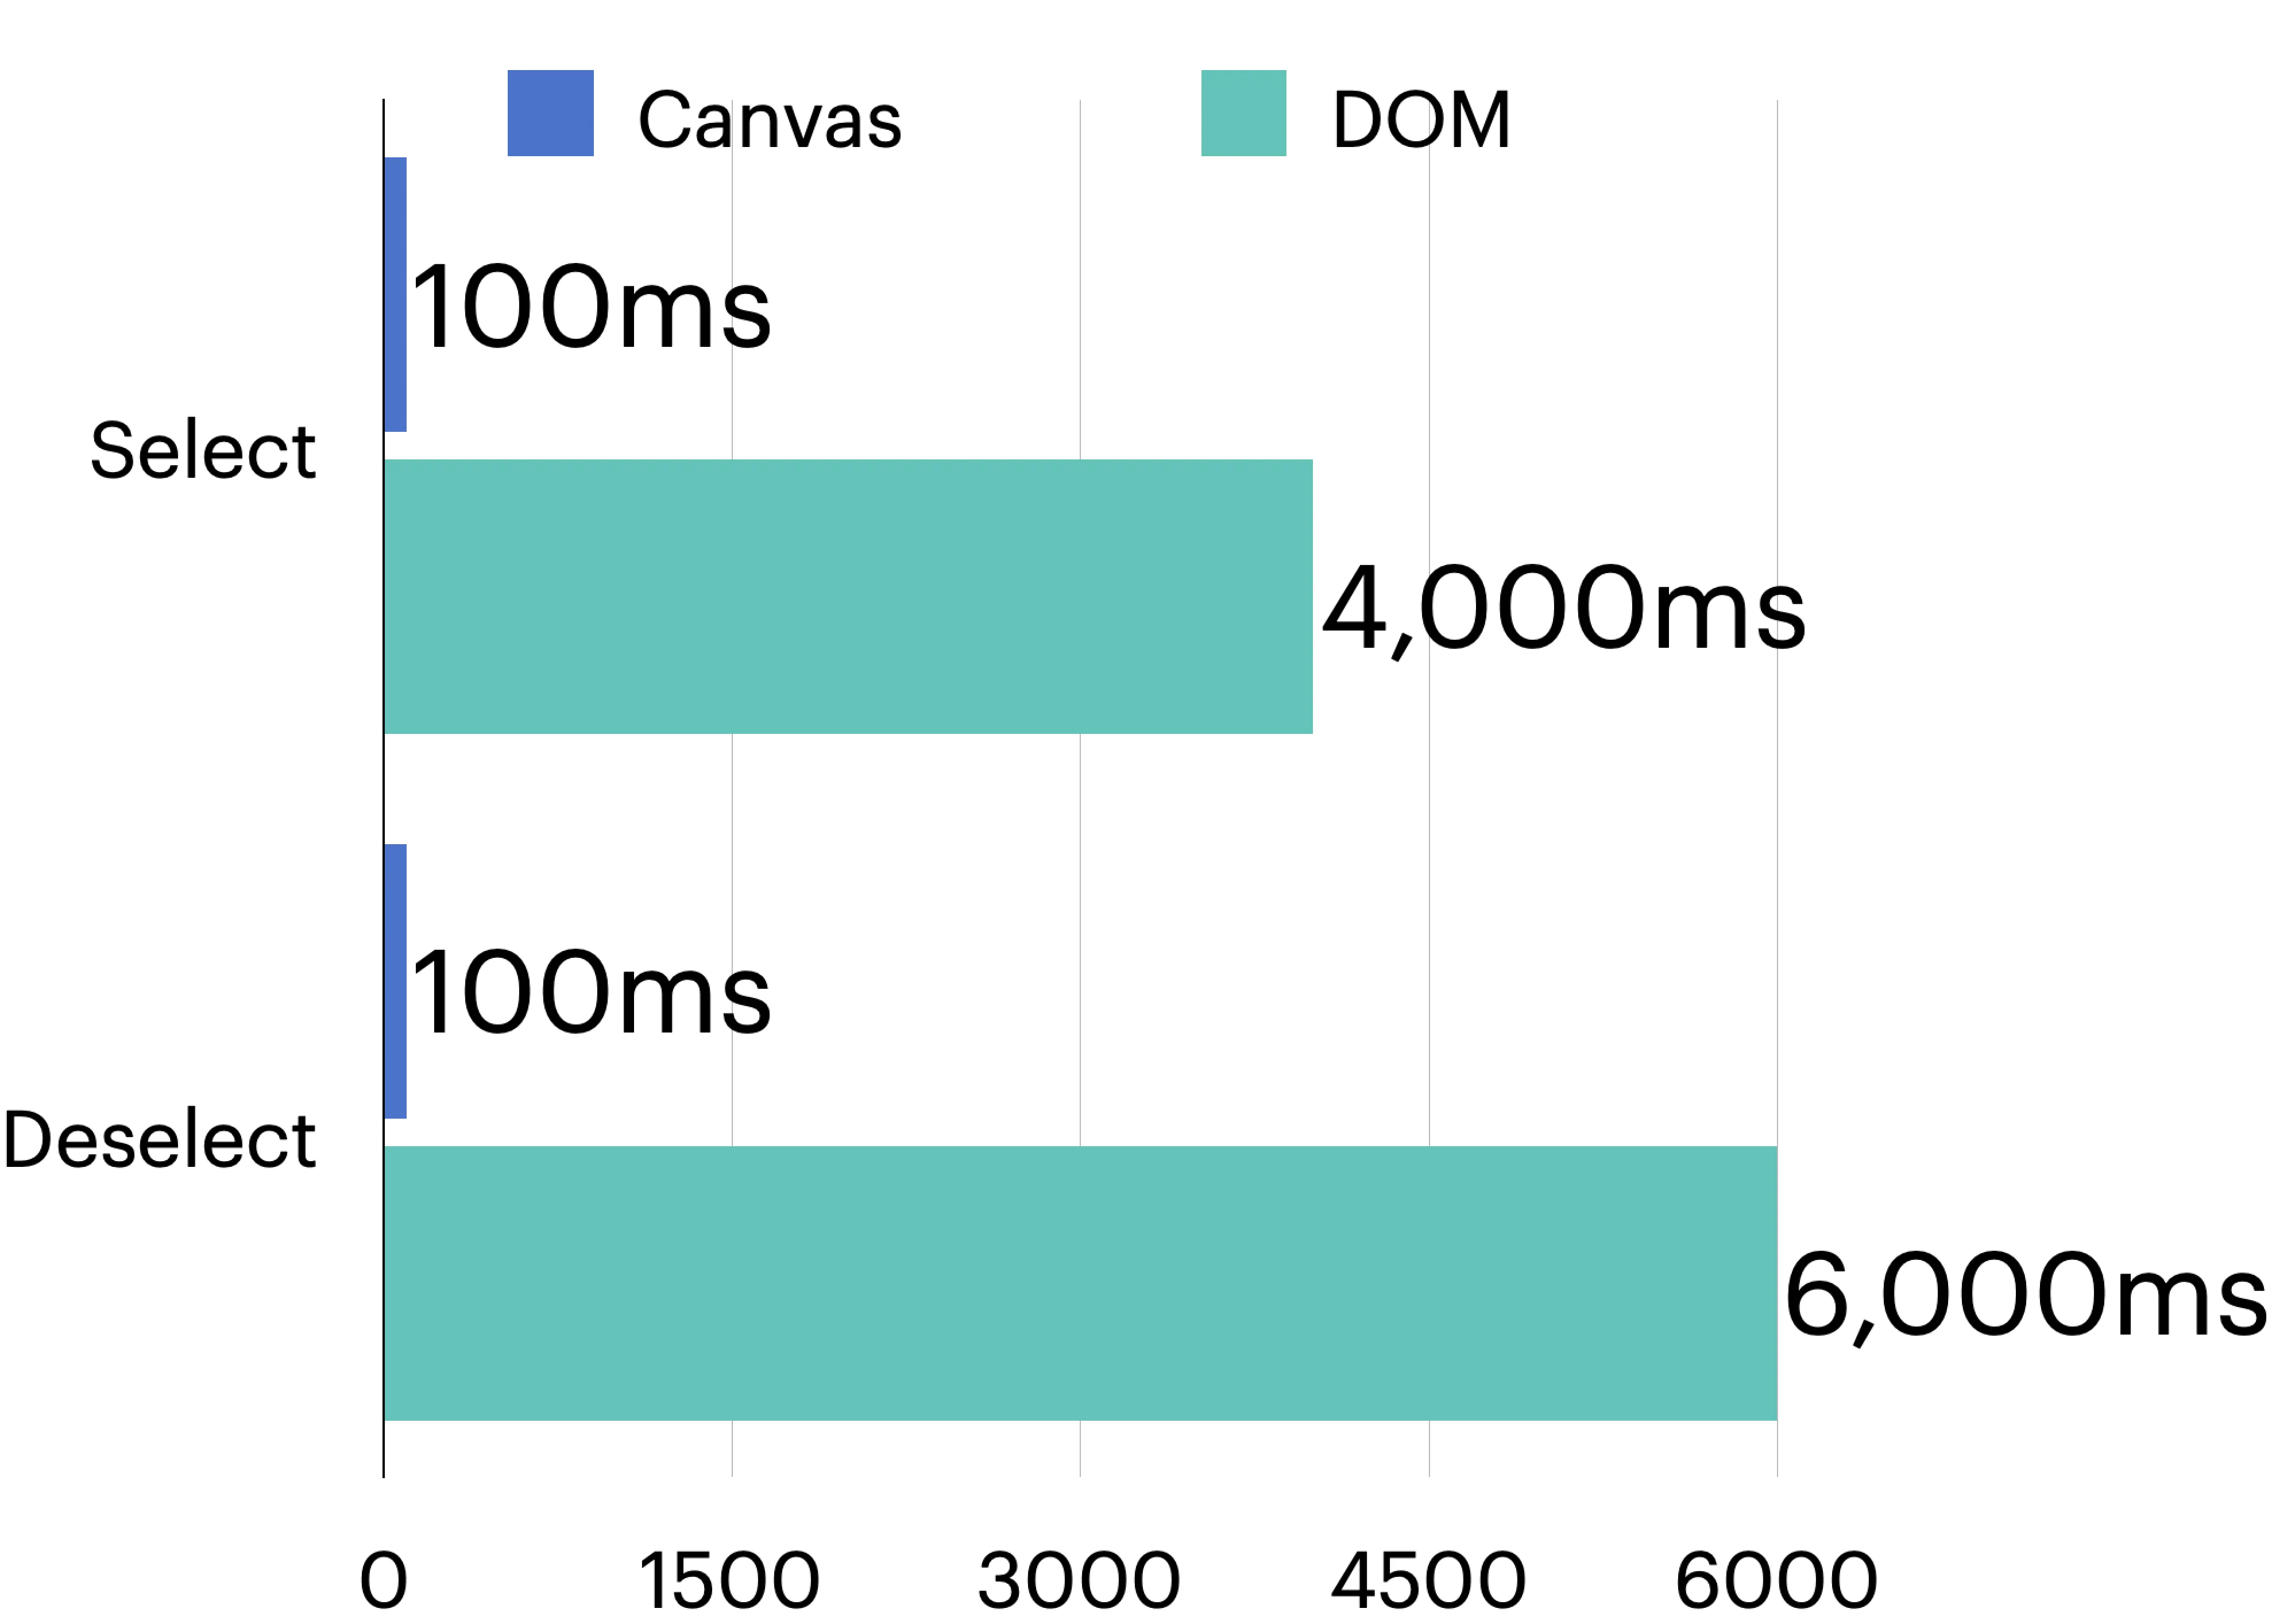
This makes a huge difference when working with very complex maps!
Even though not every single benchmark is improved with the canvas, the fact that we draw every single frame means a couple of things.
Firstly, we get a much more stable frame rate, regardless of what we’re doing on the map.
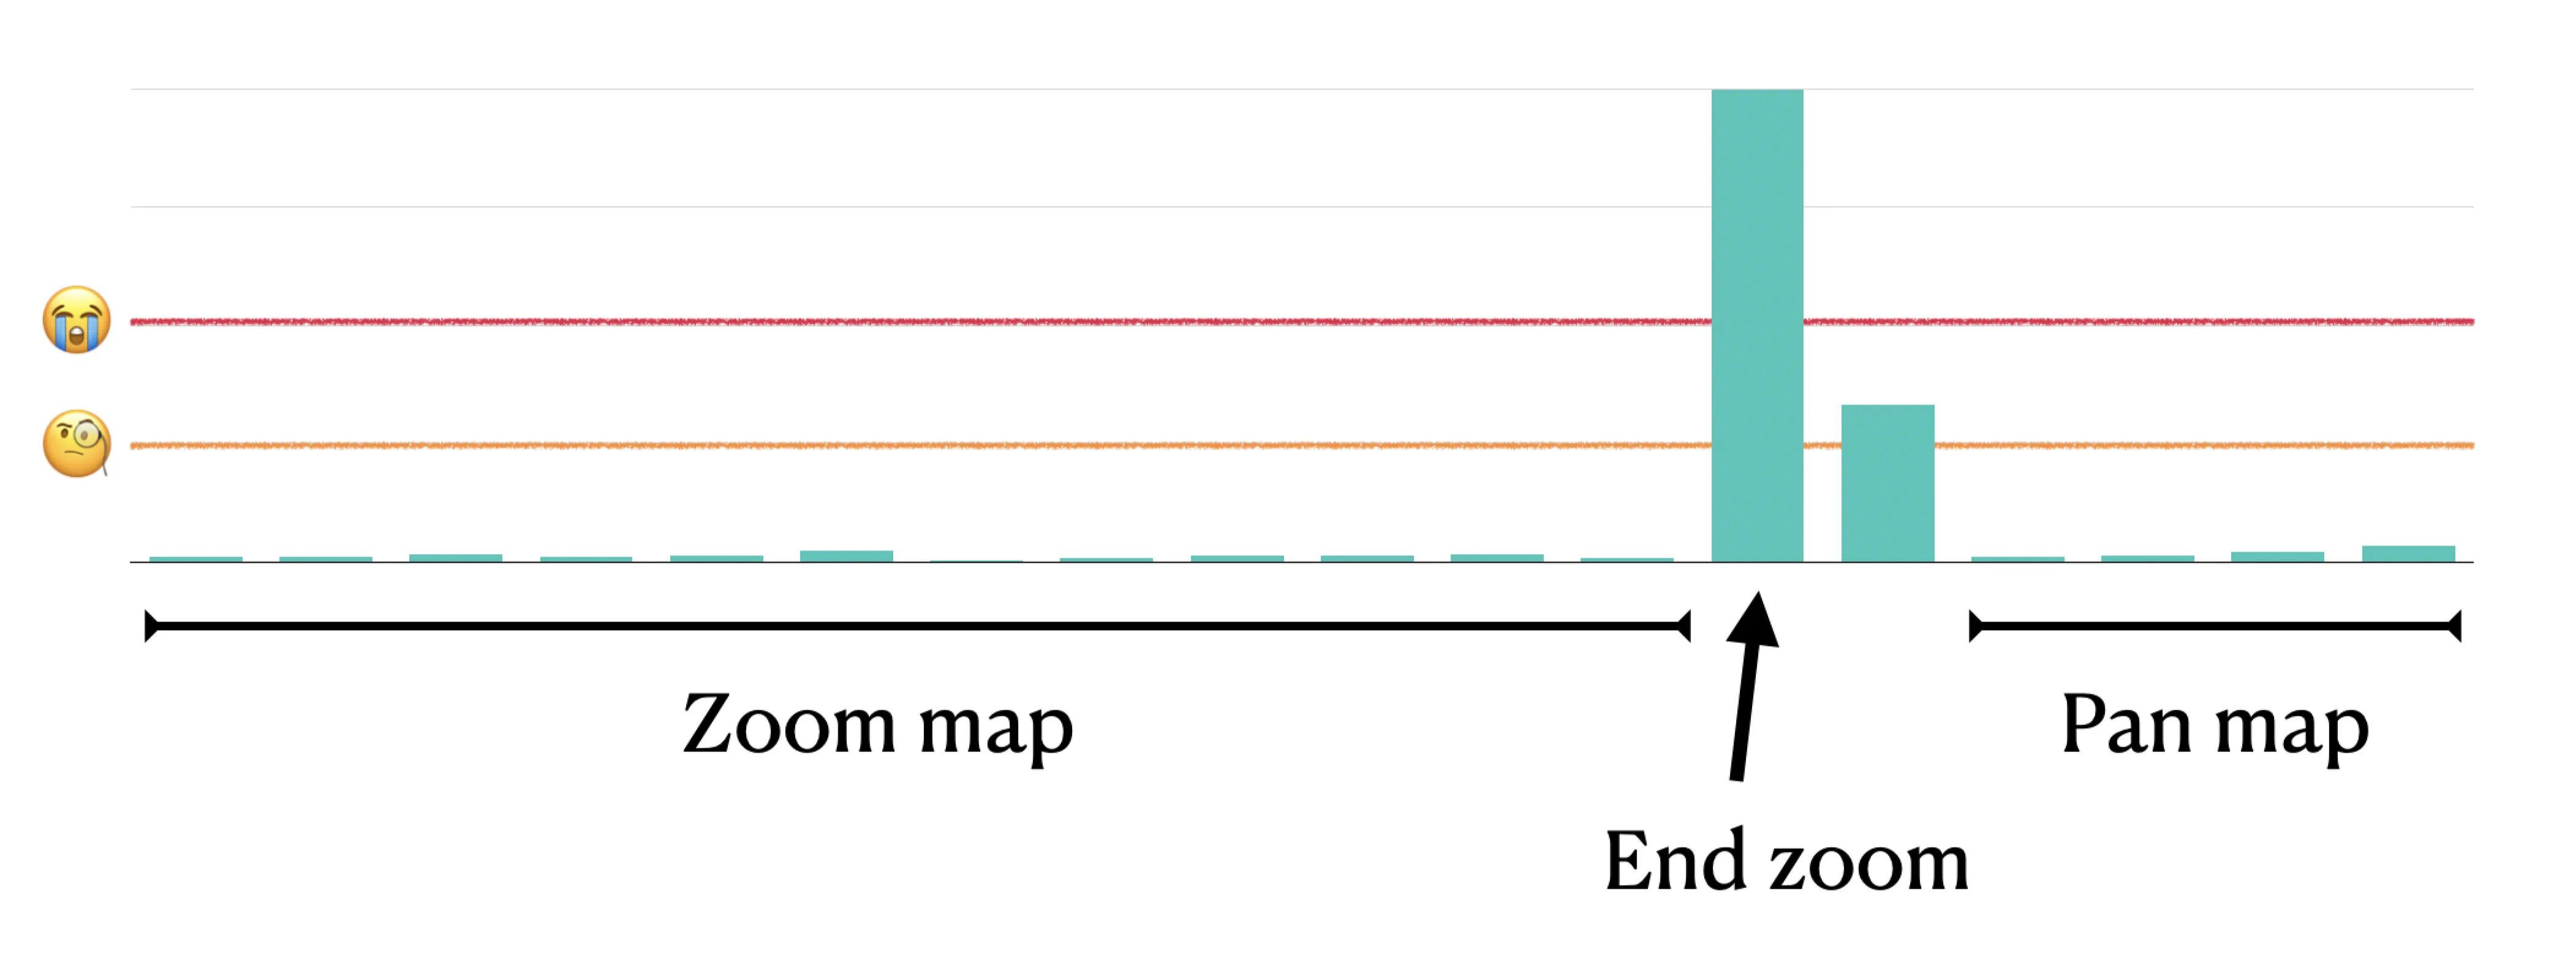
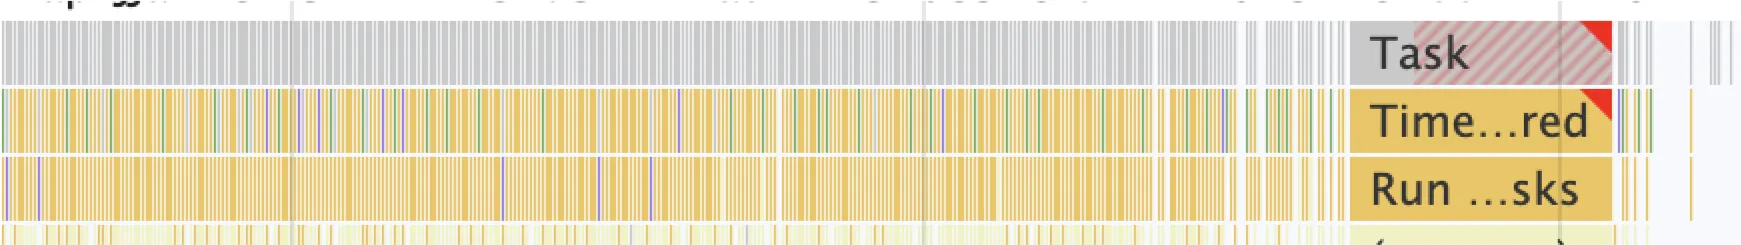
Remember our timeline from before, where ending the zoom resulted in a lot of extra work and redrawing? Here’s a real performance profile of an element-heavy map being zoomed in.
At the end, you can see one very long frame where everything is re-drawn and the browser is locked up.
Compare this with the canvas version.
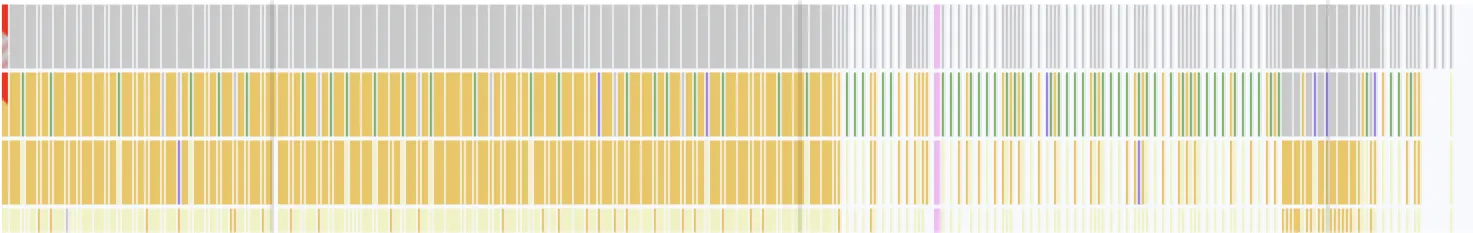
Although lots of the frames on the left take longer in the canvas, they’re still within the threshold of rendering at 60fps. But the big difference is that there is no single slow frame at the end of the zoom.
Drawing everything from scratch is often slower than the DOM version during pans or zooms, but a more consistent performance profile yields a better user experience, and an easier path to optimizing rendering. Also, we get a much better visual experience, as shown in these two videos showing zooming into a route.
Here’s what happens with our SVG renderer:
When we draw everything on every frame, we get a much better experience:
Optimizing rendering
While the raw performance of canvas is impressive, it still requires some performance optimizations to go really fast.
Here’s a quick run-down of some of the optimizations used in Felt to keep it as fast as possible.
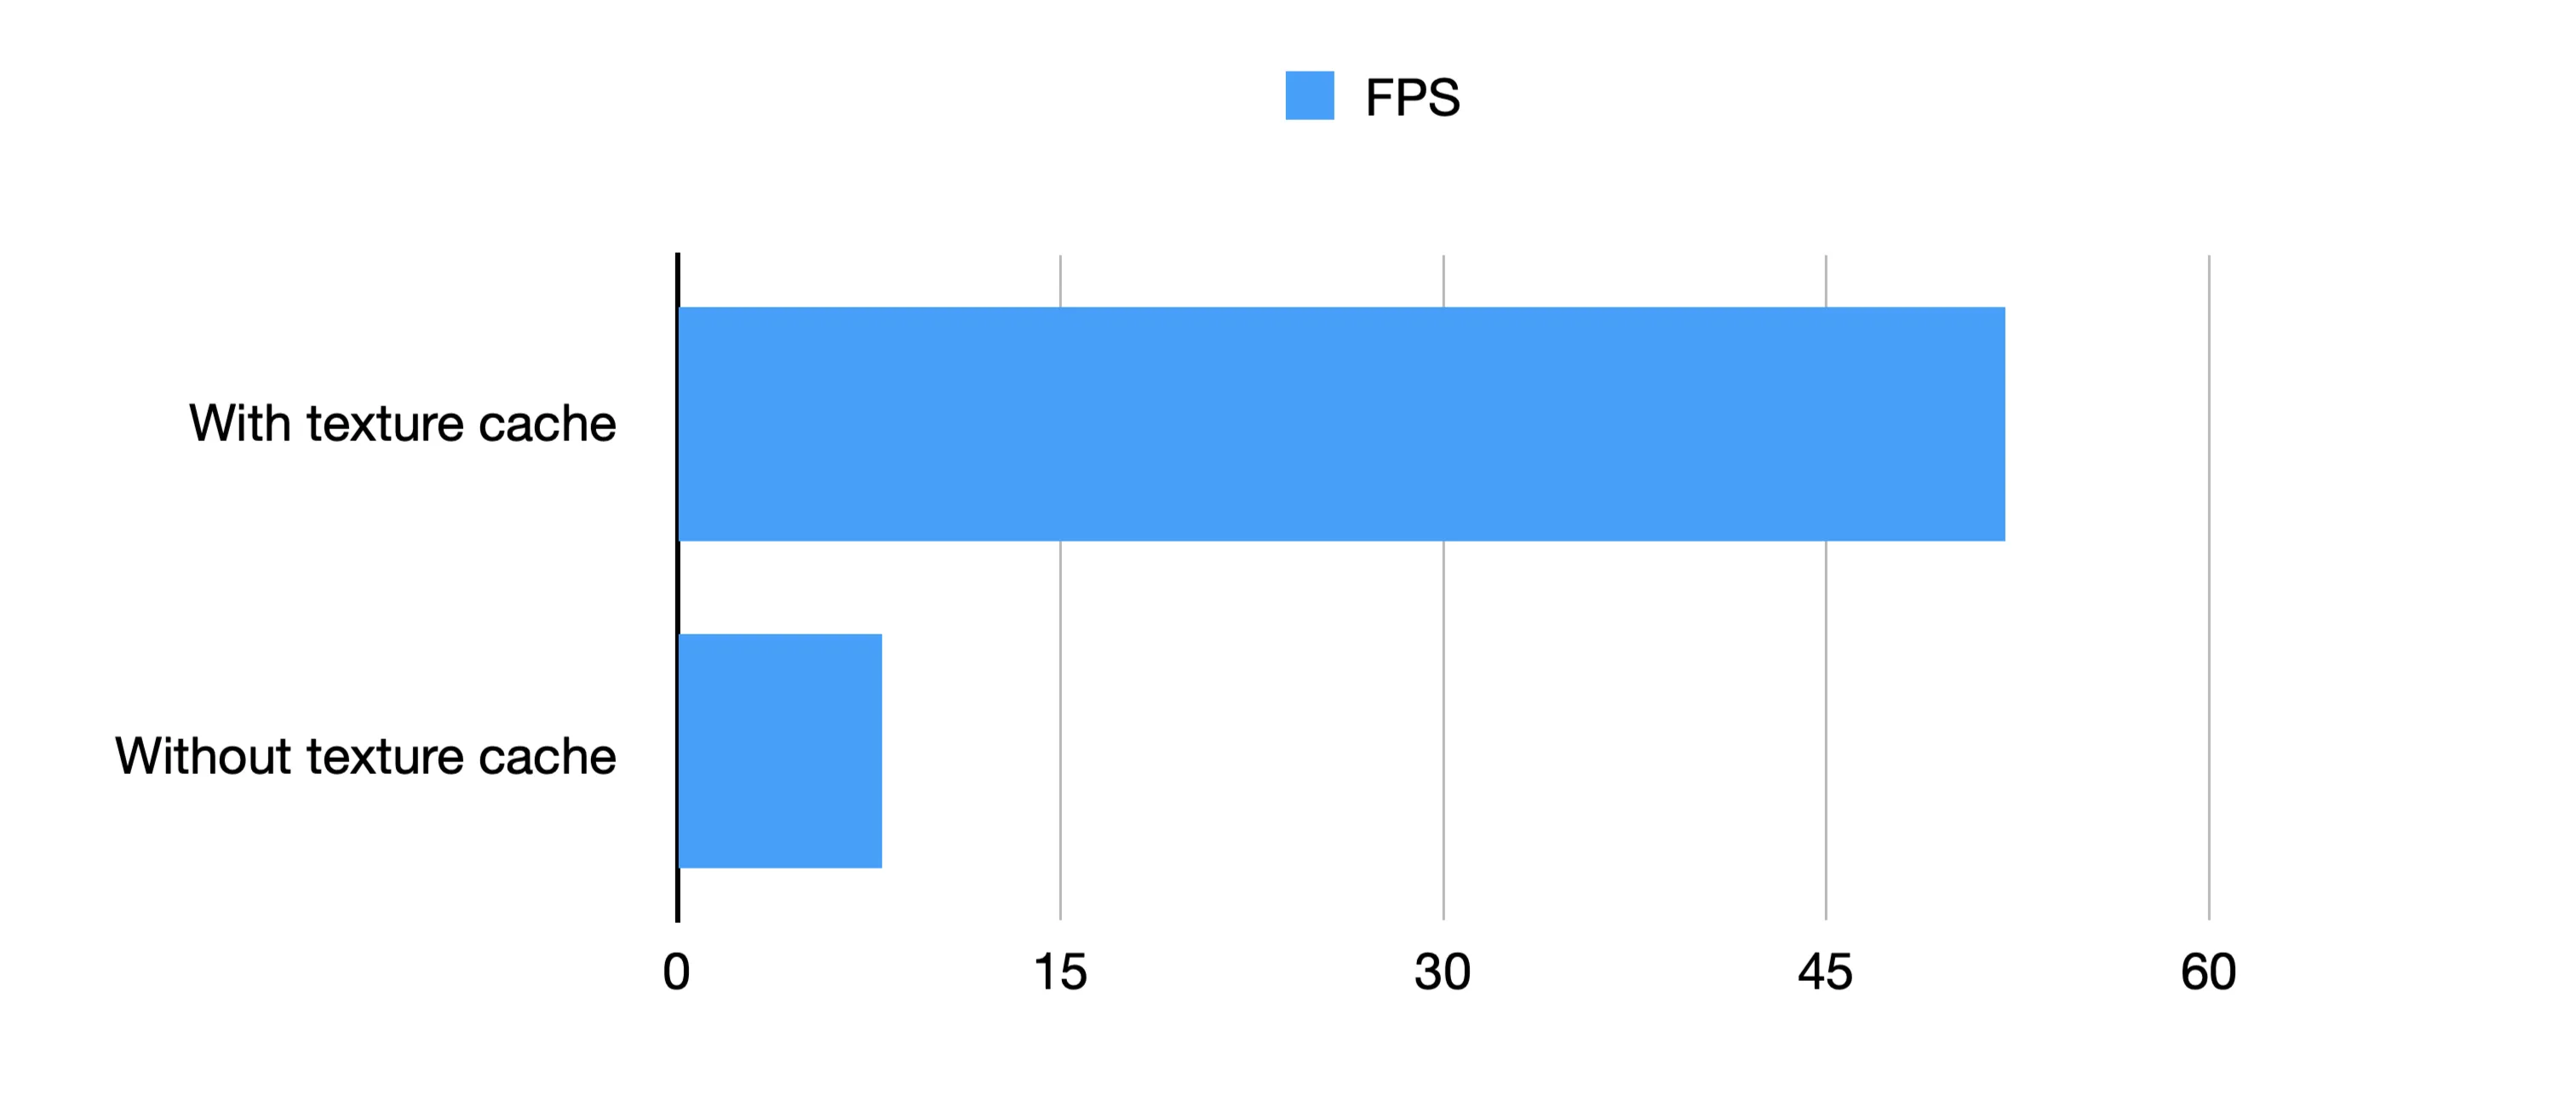
Caching text to textures
Rendering text in a canvas is relatively slow. When text is below a certain size on the screen, we use a rasterized version of the text, which is much faster to draw than drawing the glyphs from scratch.
This is achieved roughly like this:
If the desired font size is below a threshold, we obtain another texture canvas with that text rendered into it, scaled down. If the texture canvas doesn’t exist, we create it, draw the text to it, cache it and return it.
This led to a marked performance increase in our text rendering benchmarks:
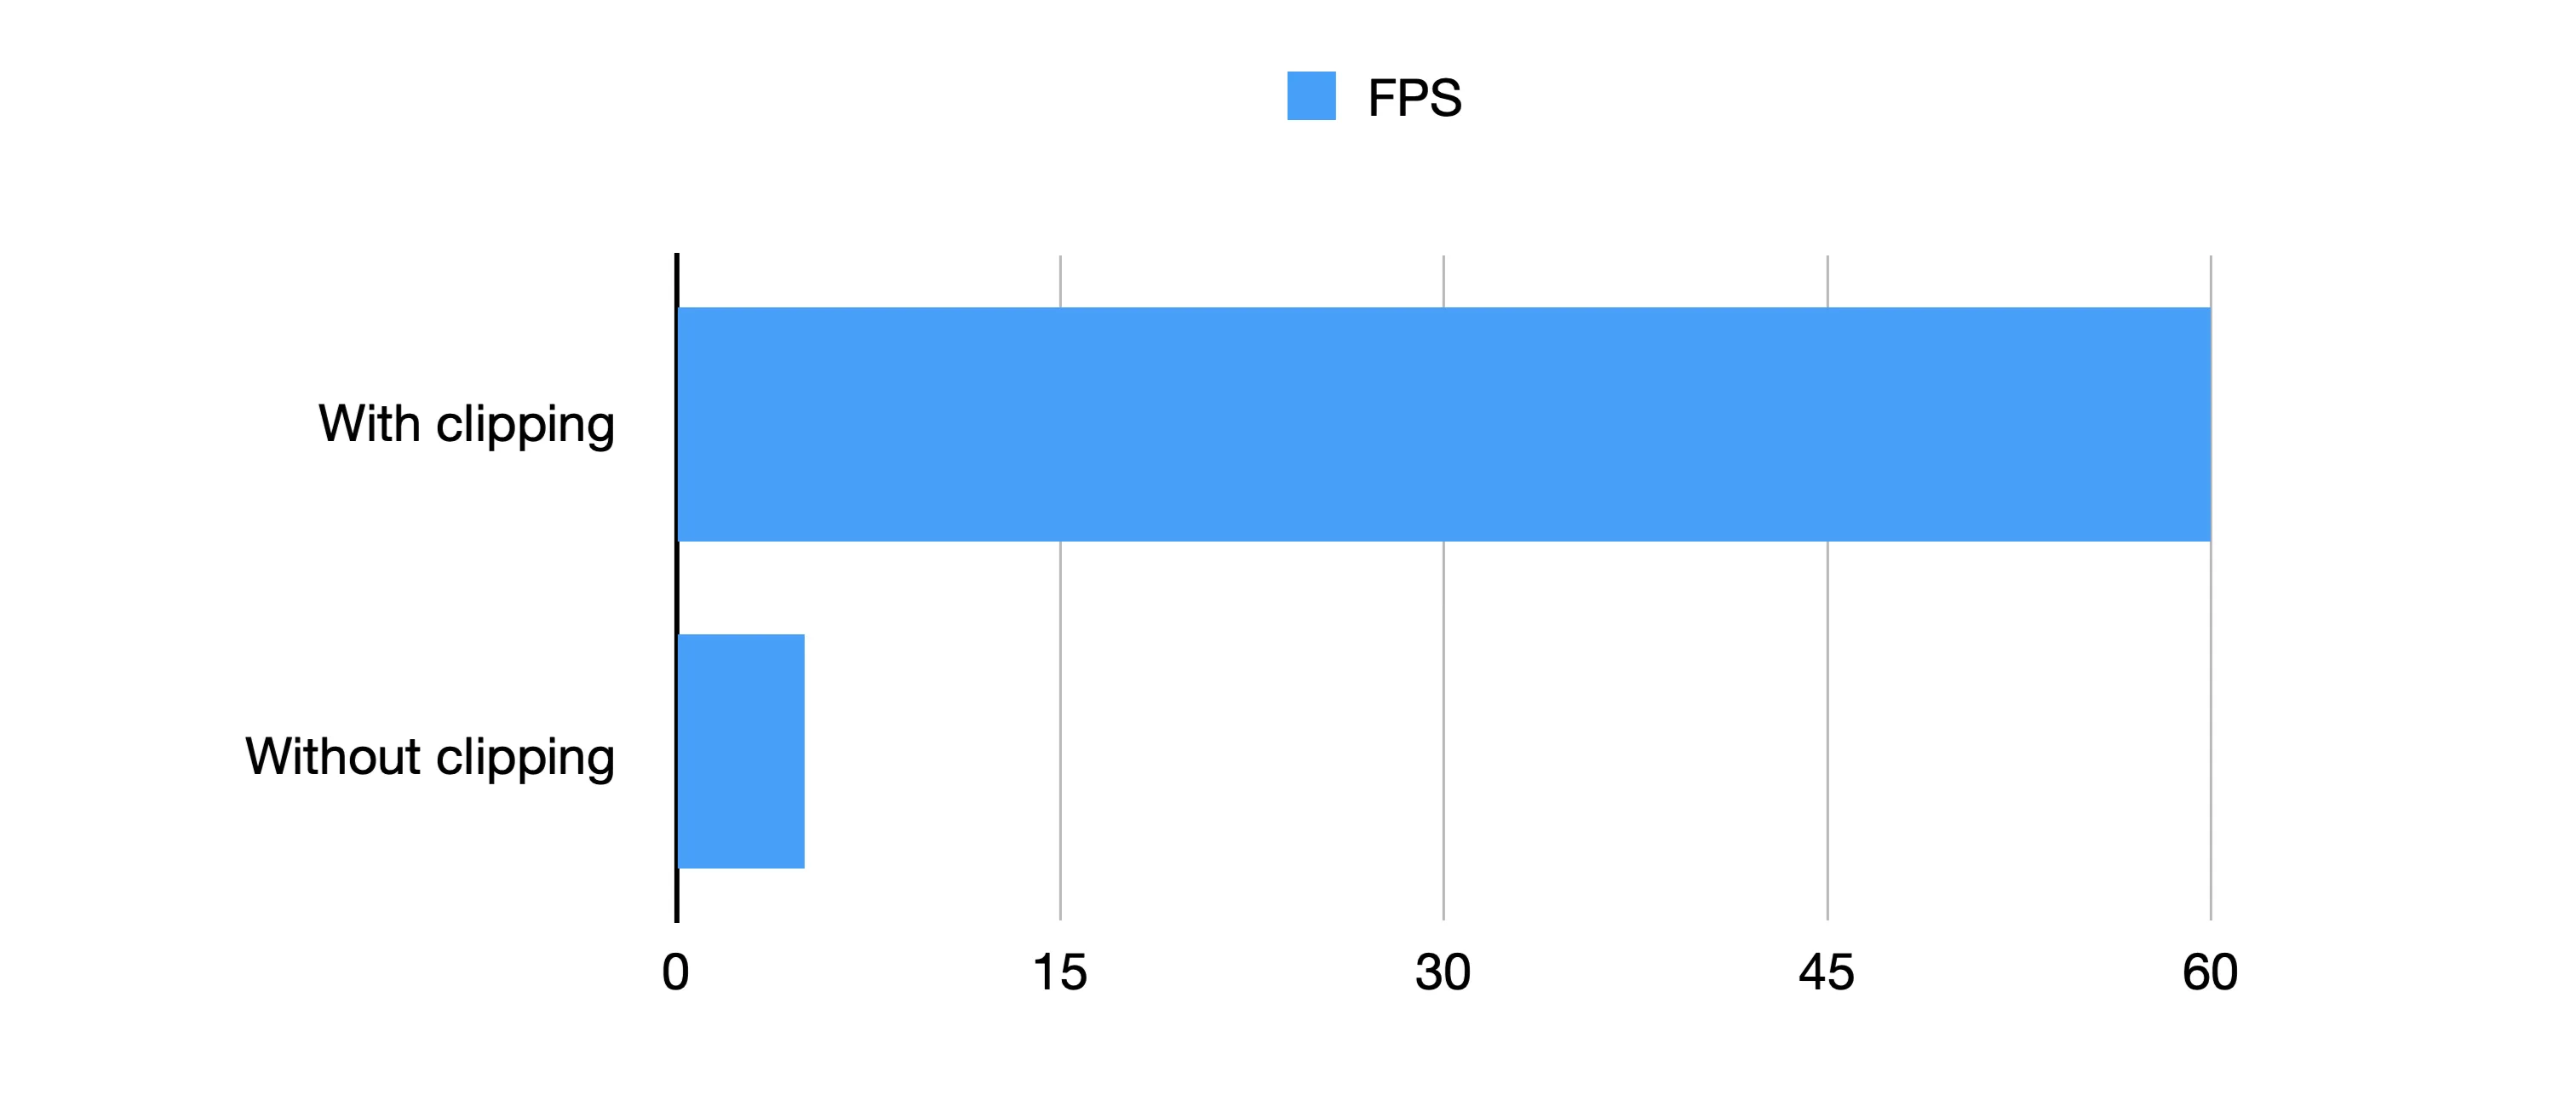
Viewport clipping long lines
Drawing long lines – especially those that are dotted or dashed – is very wasteful if the vast majority of the line is not on the screen.
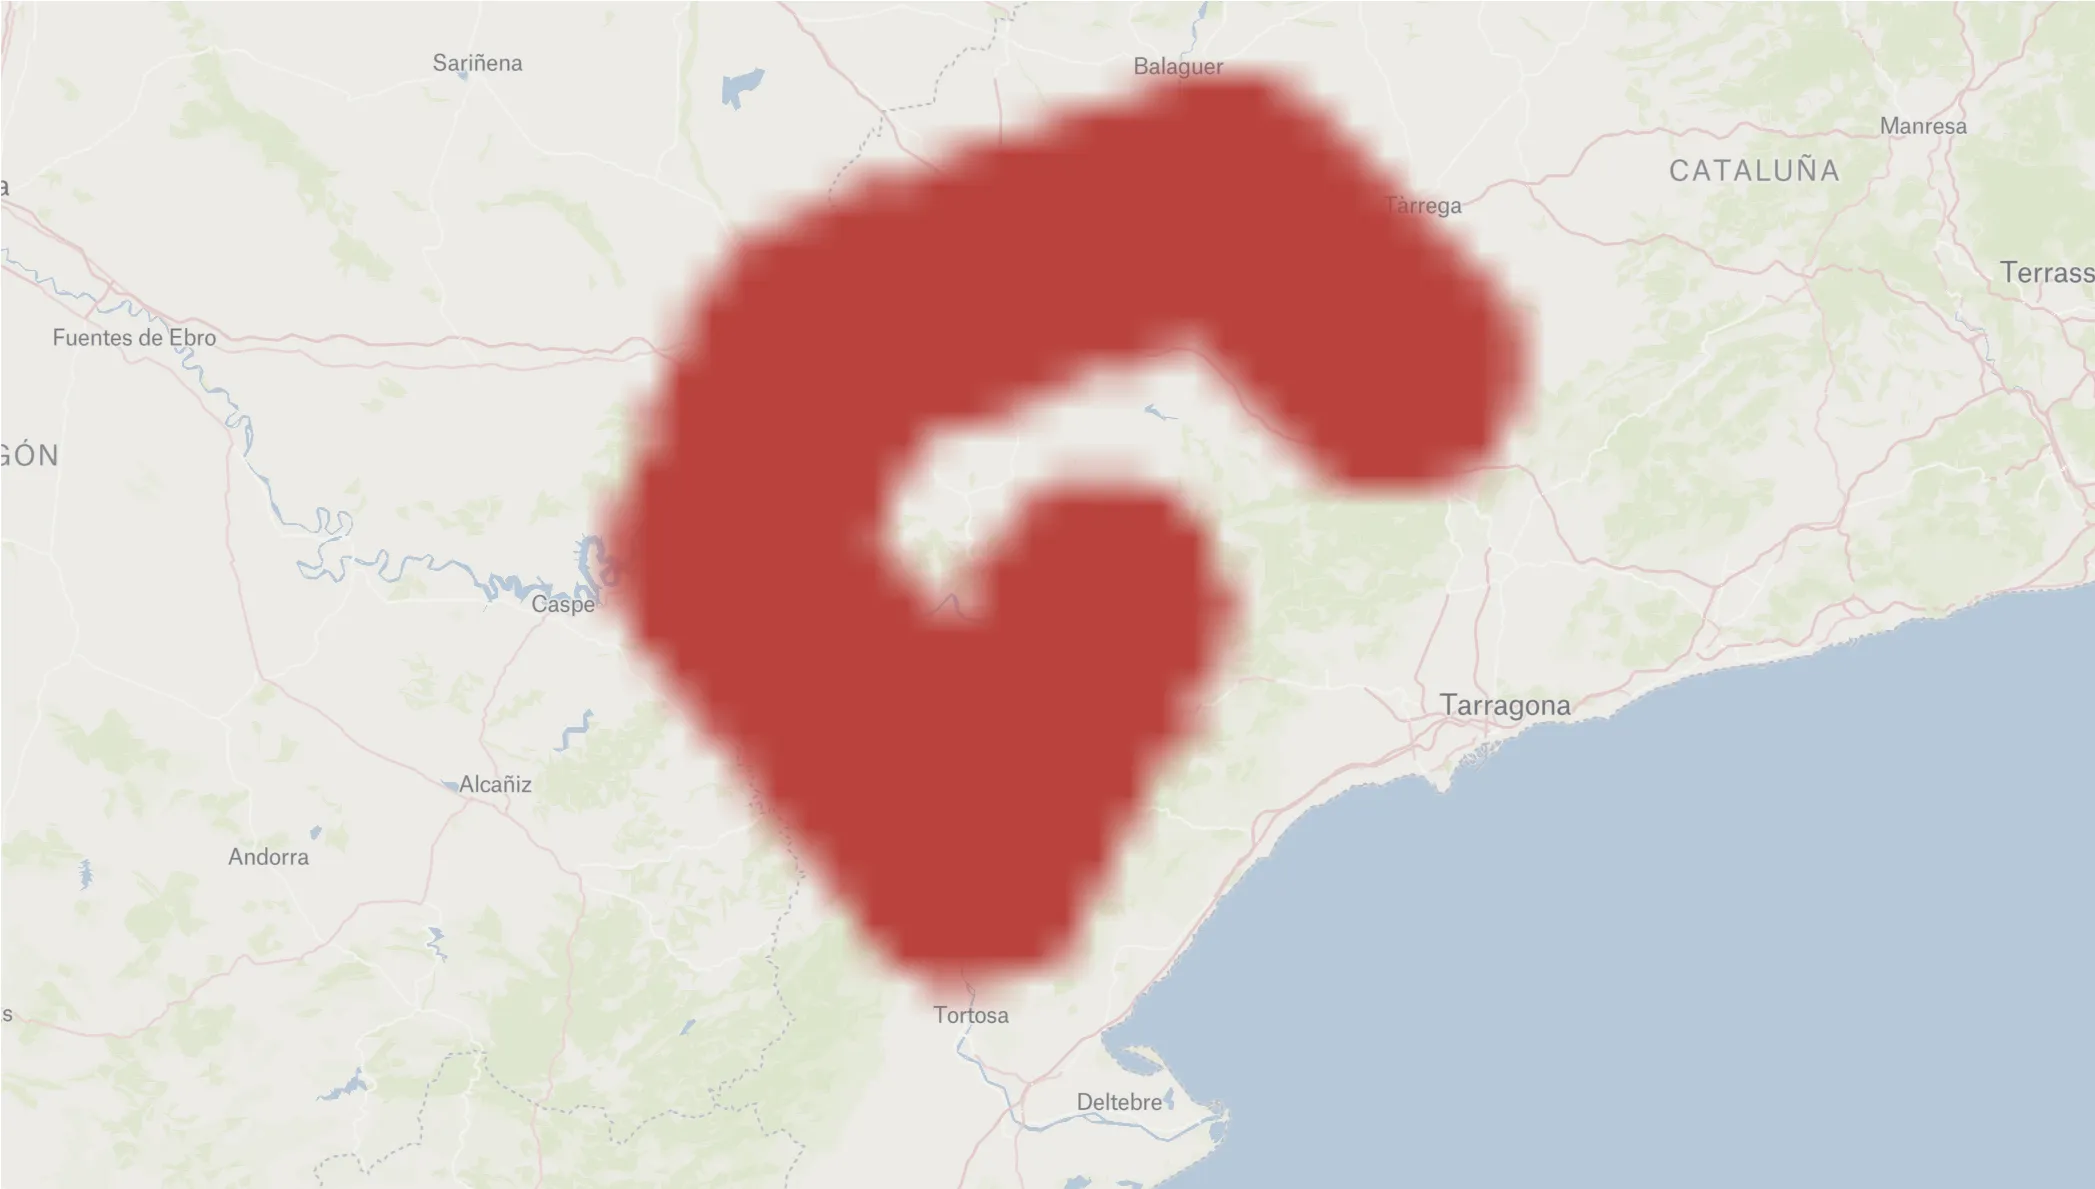
If you clip the outline of Russia with the Clip tool in Felt, then zoom right into one part of the border, there can be literally hundreds of kilometers of unused pixels having their dashes and dots meticulously calculated, only to be drawn way off-screen.
It turns out it’s far, far quicker to calculate which portion of the line is on screen by slicing up the line and discarding the off-screen parts and only rendering the on-screen parts than it is to draw the entire line.
Caching projected shapes as <in-line>Path2Ds<in-line>
A lot of work when rendering elements is spent converting world coordinates to screen coordinates. Once this is done, we can cache that projected geometry to a <in-line>Path2D<in-line>, then just translate and scale it before painting it.
Going back to the painting analogy, it’s a bit like keeping a stencil - although you still have to paint the line, you haven’t got to work out how to draw the actual shape.
For this, we use a lot of <in-line>WeakMaps<in-line> to avoid memory leaks and complex cache invalidation code:
This means that we don’t have to check if the coordinates have changed or limit the size of the cache. As soon as an element’s coordinates are replaced, its cache entry becomes dereferenced and will be garbage collected.
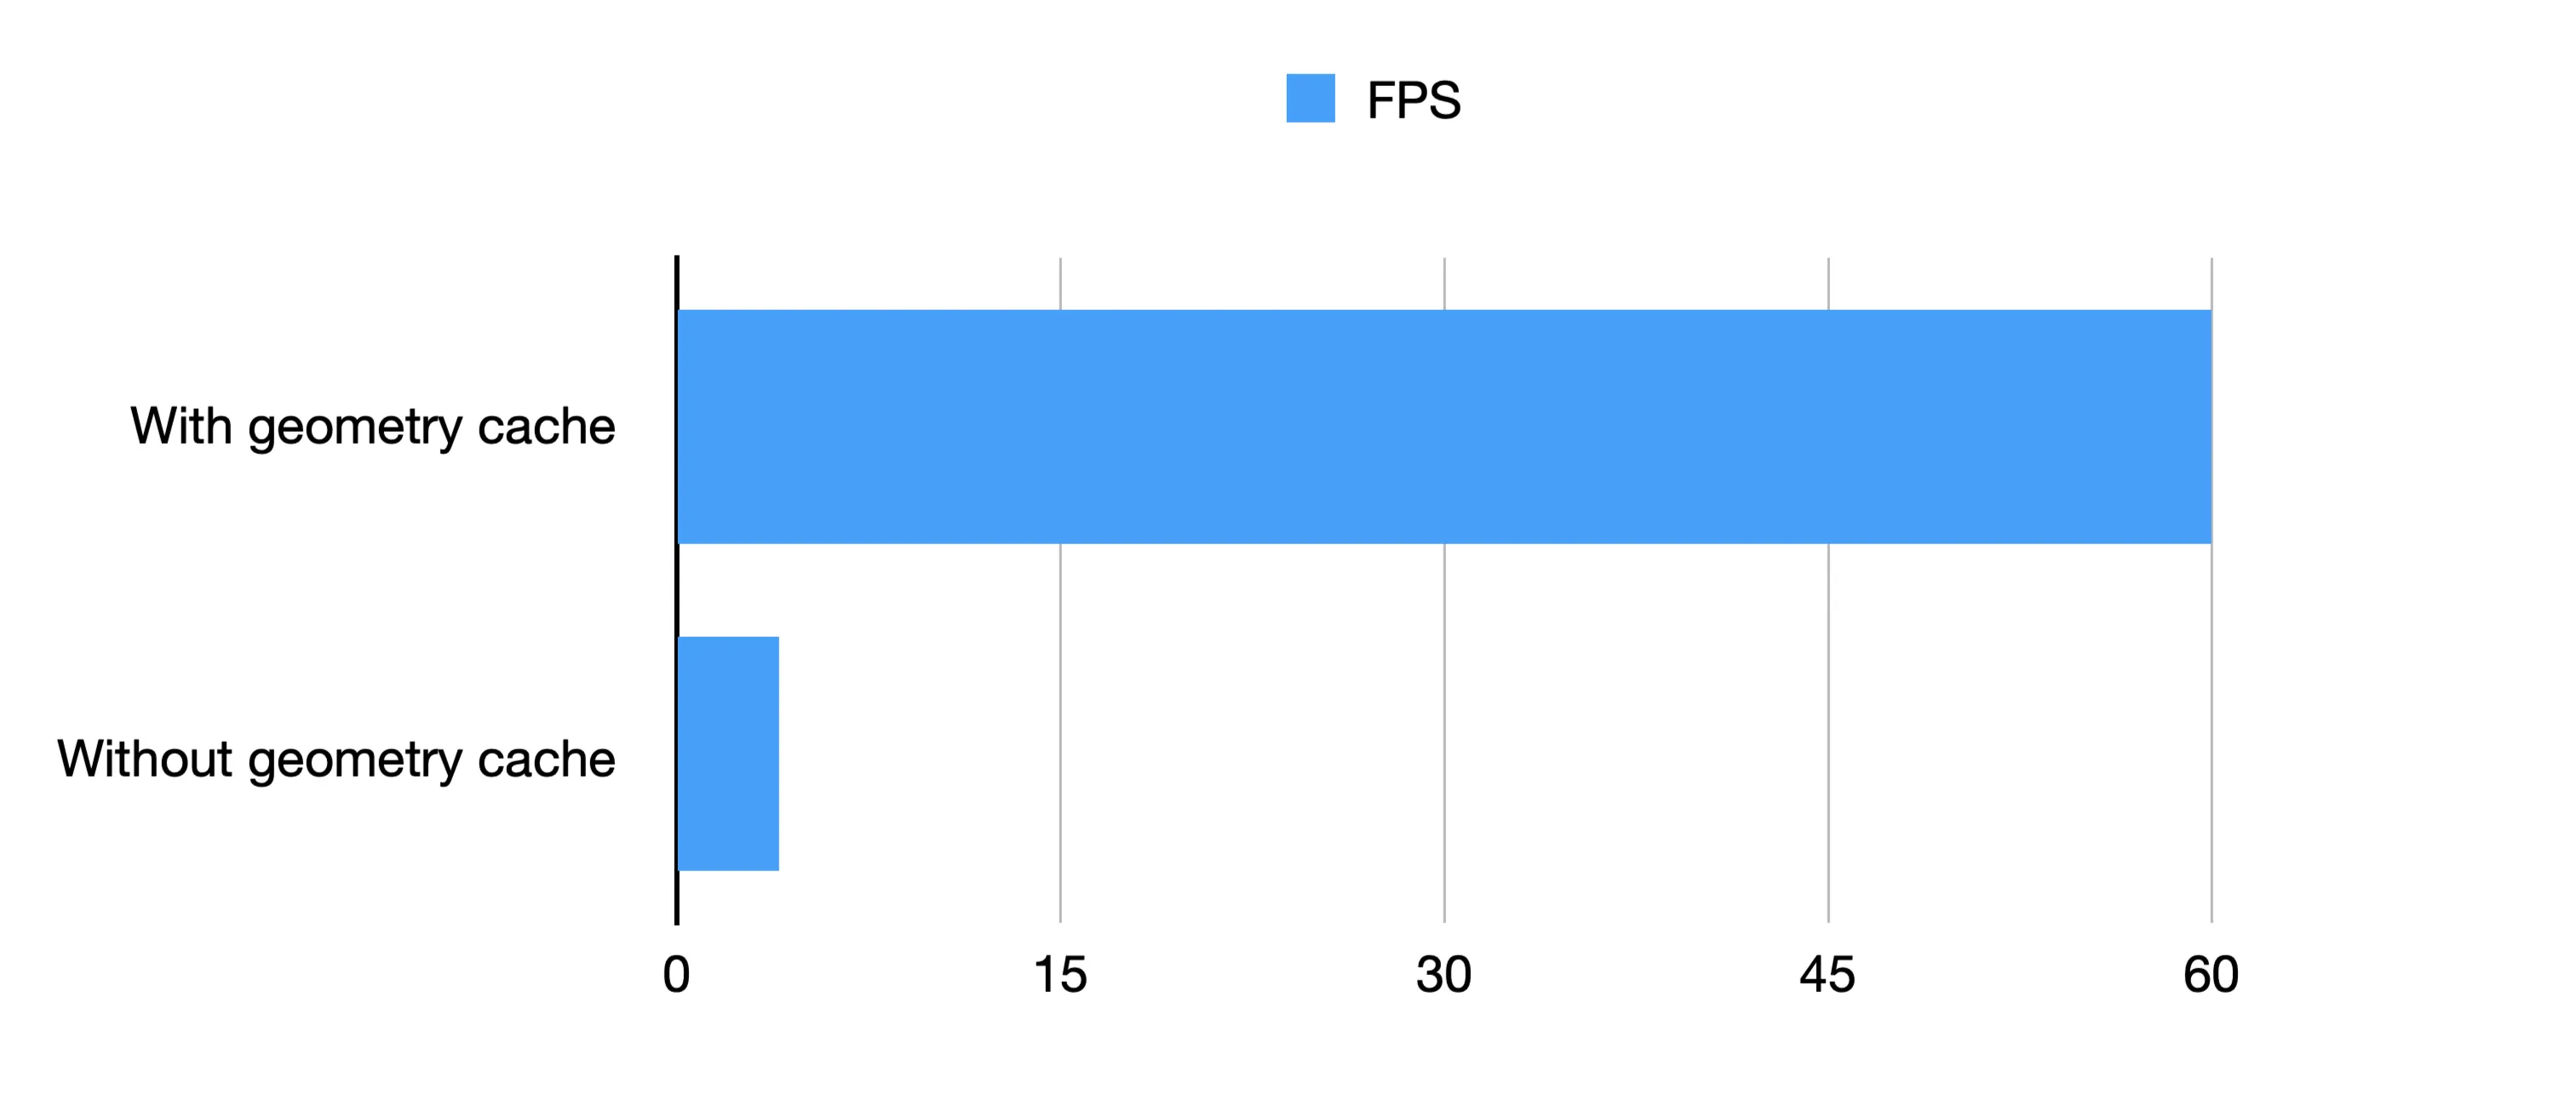
We also use this technique for various derived coordinates, such as bounding boxes. Using the element’s coordinates as the cache key saves a lot of hassle and lets us use caches more aggressively.
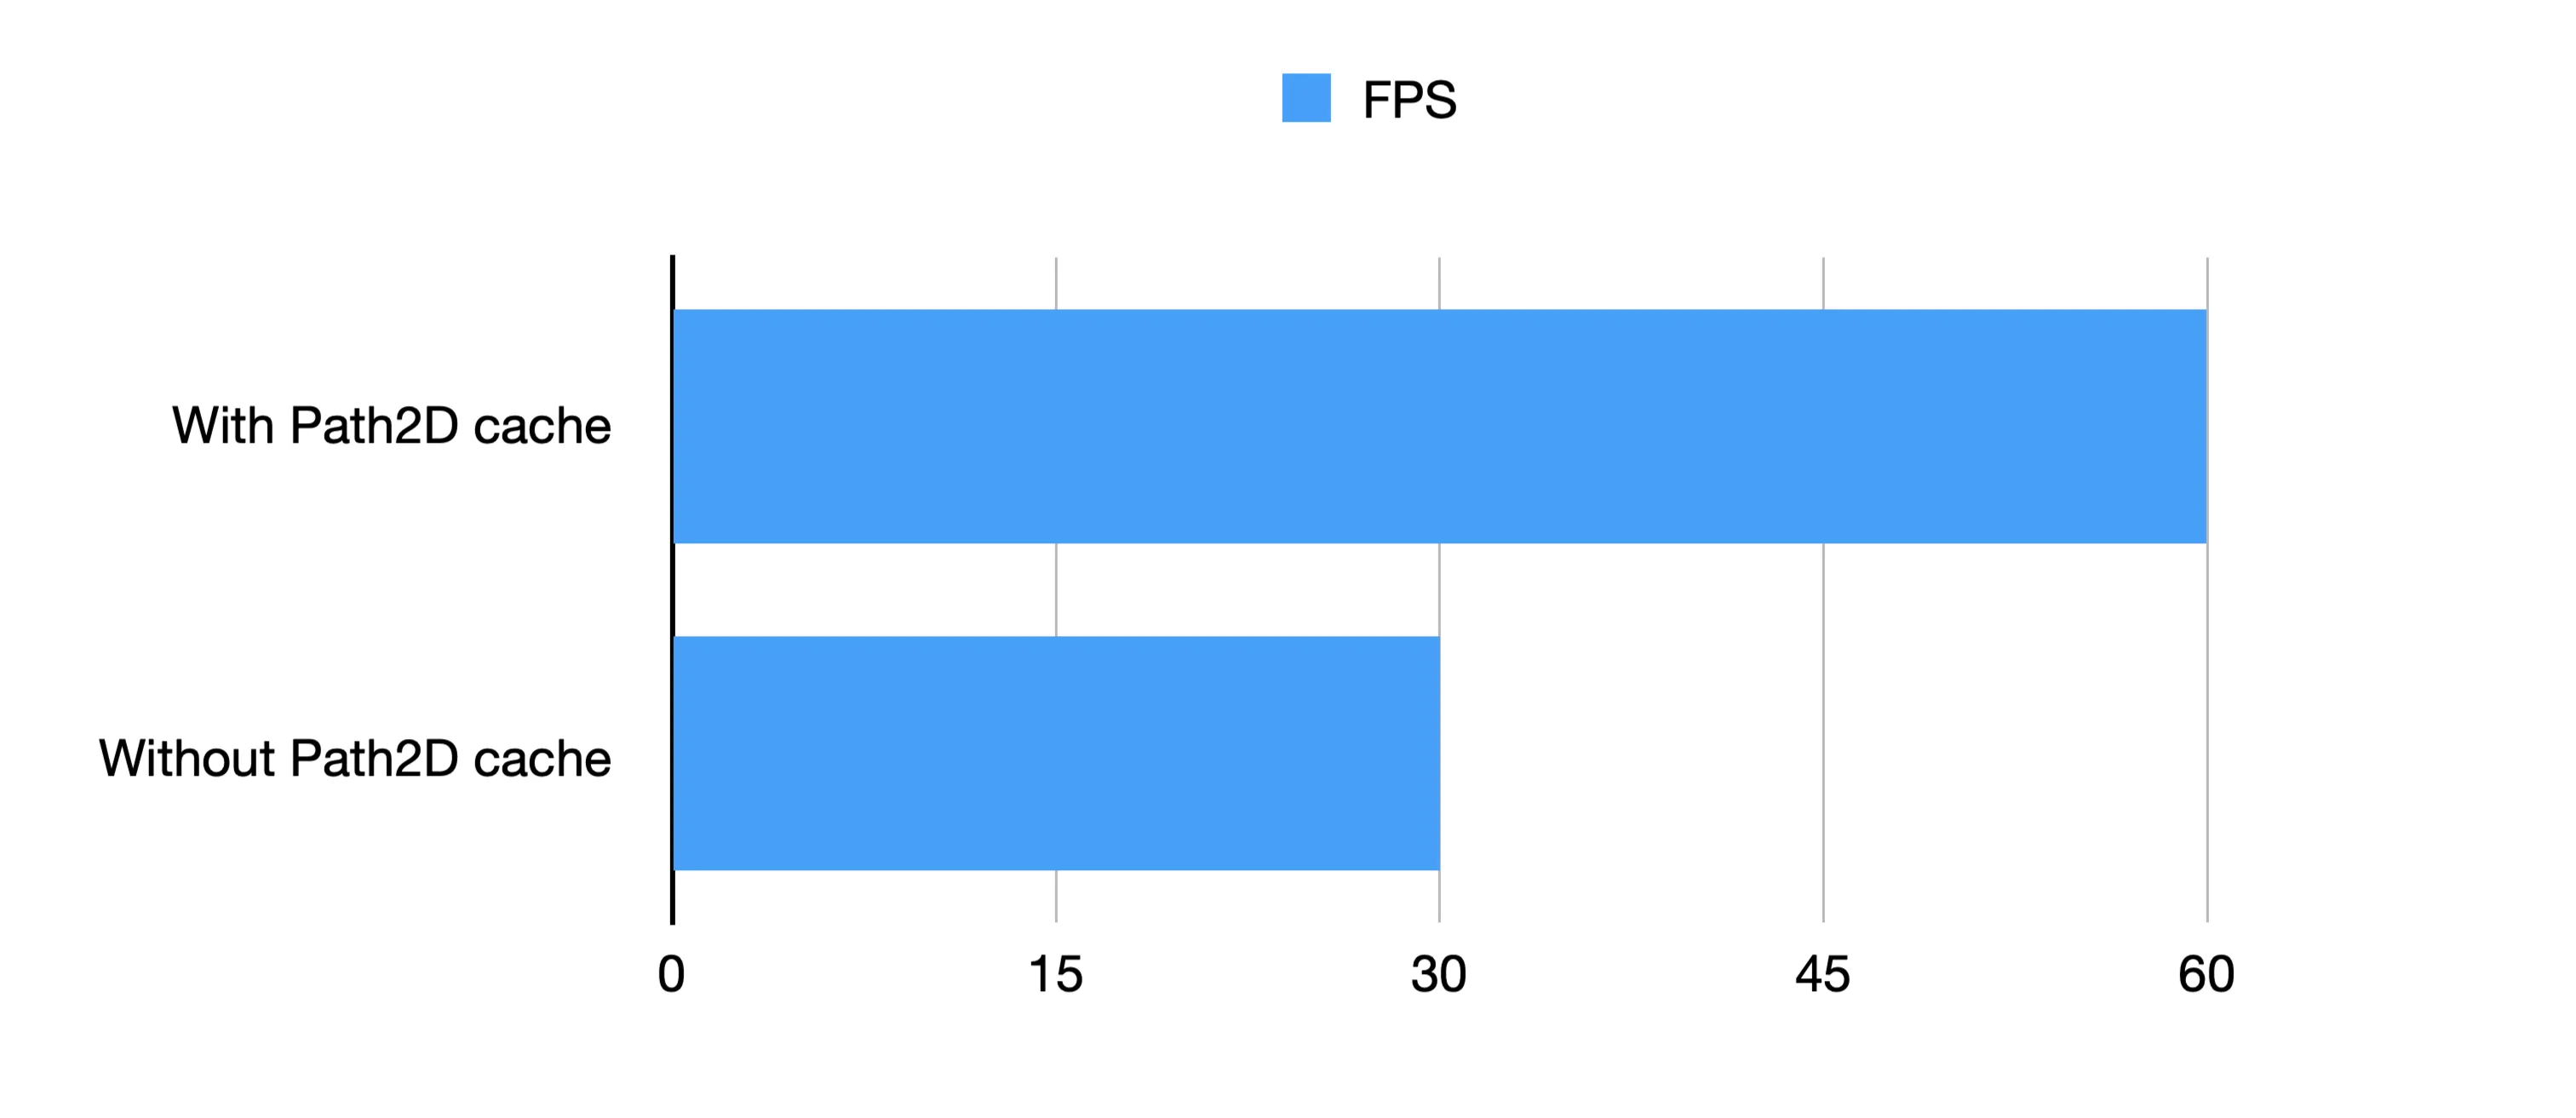
If we combine this with caching other geometry calculations we get an even more stark contrast:
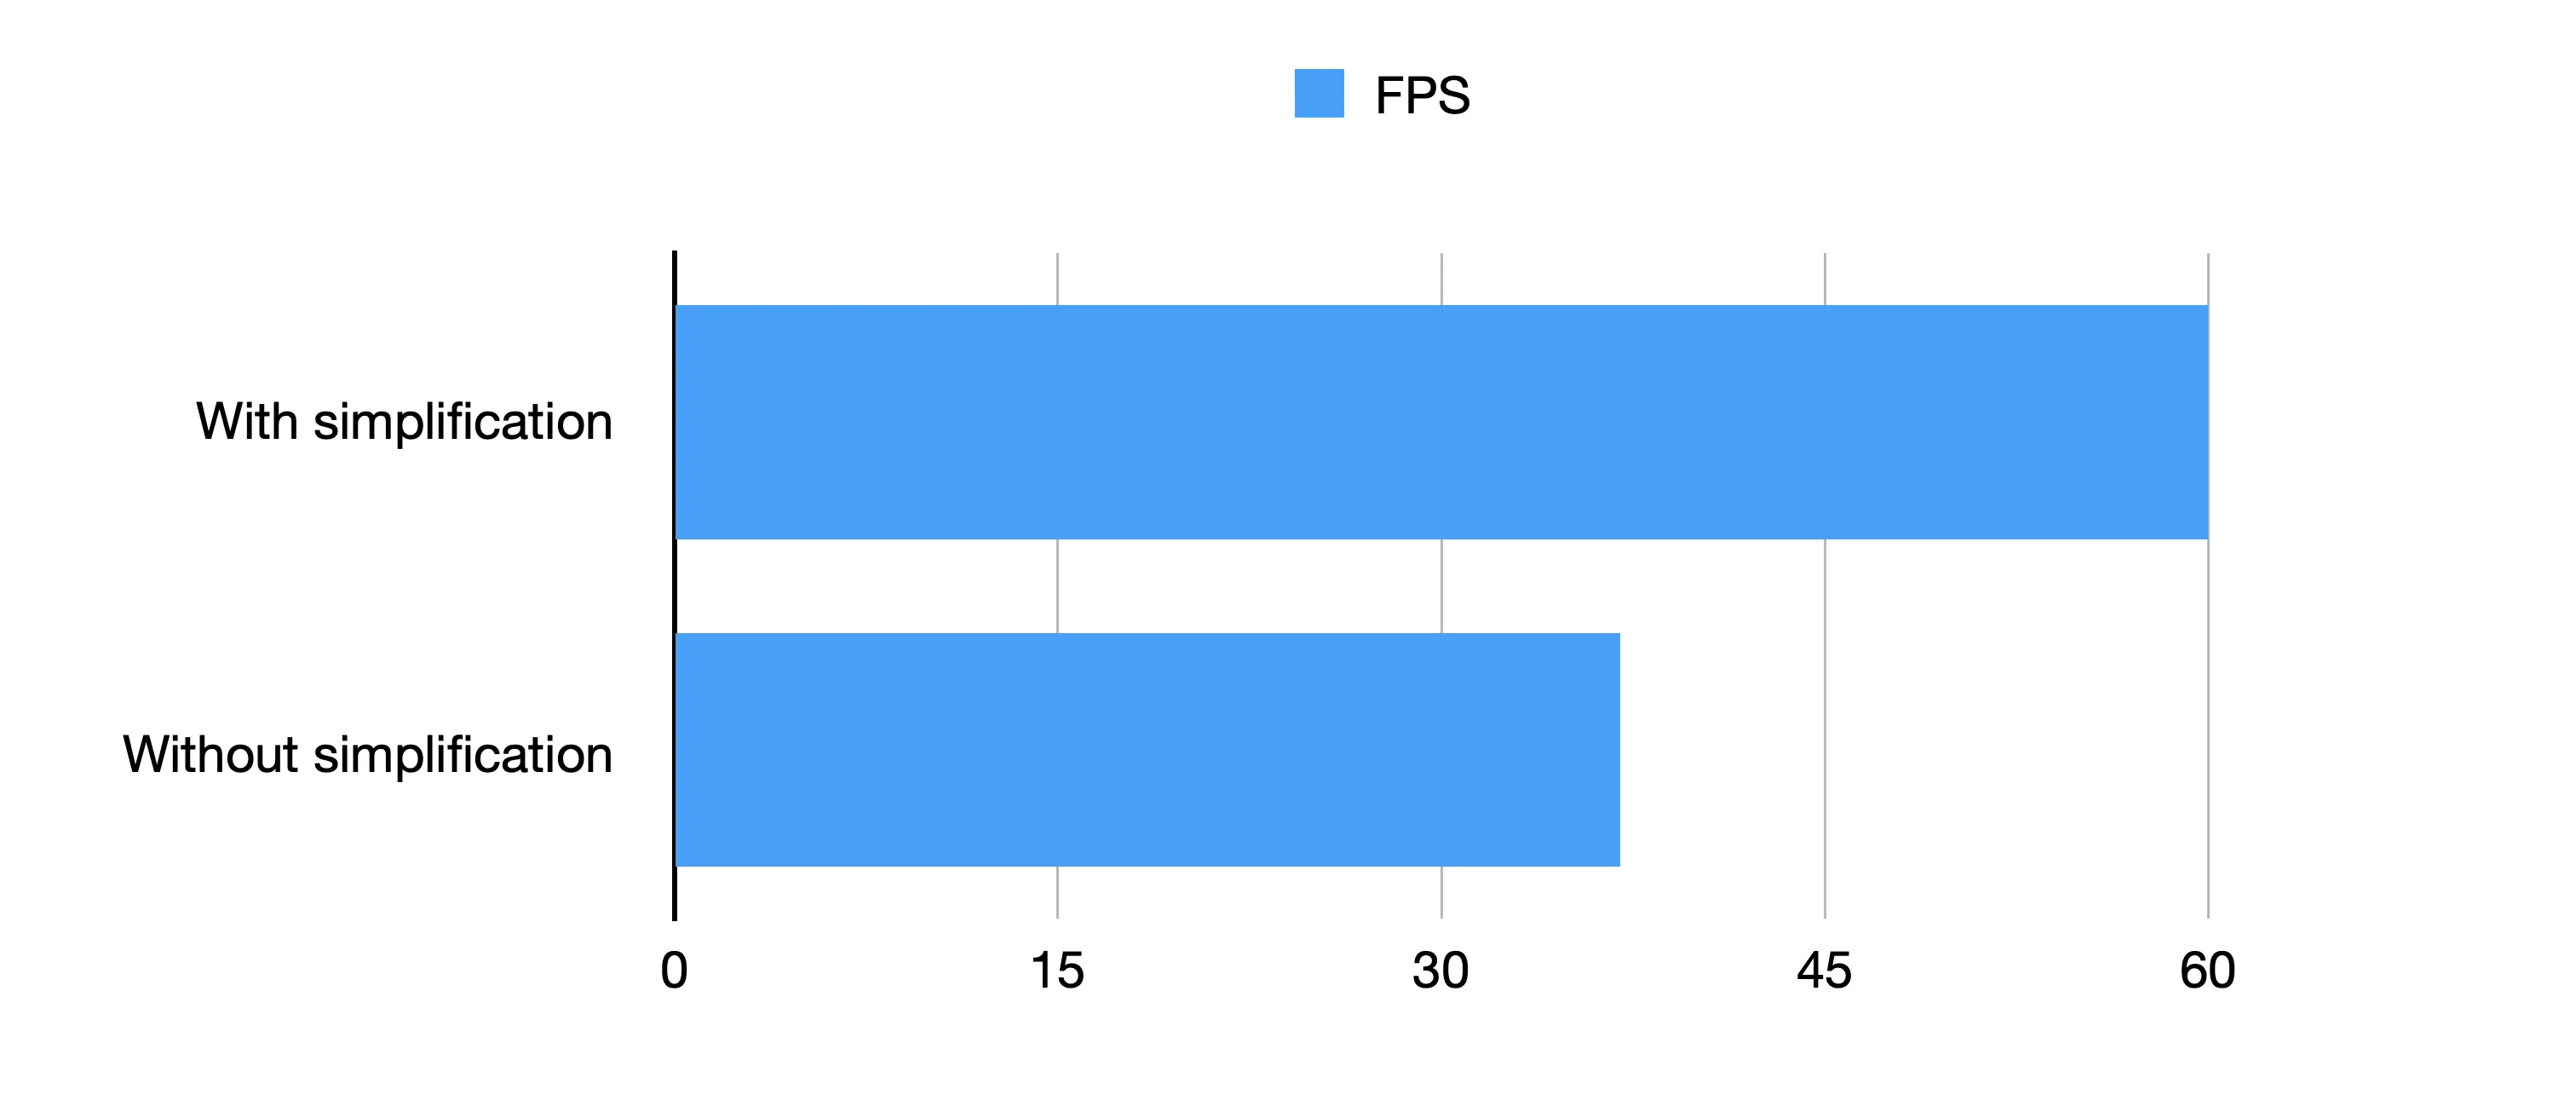
Rendering lower detail versions of elements at low zoom levels
Routes are a good example of this. When you plot a route, it can easily have tens or hundreds of thousands of vertices. If you’re planning a road trip across the US, for instance, we have to store every coordinate of every curve and junction in the road!
But when you’re very zoomed out, you’re not going to see all those curves.
To that end, we can use the above techniques together to avoid a lot of unnecessary rendering work.
Up Next
This ended up being an almost complete rewrite of all the element rendering in Felt. Ultimately, what made it possible was having a comprehensive suite of end-to-end tests, performance benchmarks, and a strong desire to deliver the absolute best experience to our users.
With any big change like this, one of the best things you can hope for is that no one complains; and that’s what happened here!
Aside from our objective benchmarks, we have had several reports of maps being faster and more responsive than before. This has been especially noticeable on lower-end devices and mobiles. In some cases, complex maps would refuse to load on mobiles and now not only load fine but are smooth to interact with.
From here, we will continue to push our performance forward to make sure Felt remains the best place to work with maps.
For more insights, check out From SVG to Canvas – Part 2: A new way of building interactions where I dive deep into how we replaced the React-based event-handling system with an entirely new approach, that allowed us to add a feature that had been our nemesis with the SVG-based renderer, or check out our other blog posts here.
Compare Felt using AI


