37° 48' 15.7068'' N, 122° 16' 15.9996'' W
cloud-native gis has arrived
37° 48' 15.7068'' N, 122° 16' 15.9996'' W
cloud-native gis has arrived
37° 48' 15.7068'' N, 122° 16' 15.9996'' W
cloud-native gis has arrived
37° 48' 15.7068'' N, 122° 16' 15.9996'' W
cloud-native gis has arrived
37° 48' 15.7068'' N, 122° 16' 15.9996'' W
cloud-native gis has arrived
37° 48' 15.7068'' N, 122° 16' 15.9996'' W
cloud-native gis has arrived
37° 48' 15.7068'' N, 122° 16' 15.9996'' W
cloud-native gis has arrived
37° 48' 15.7068'' N, 122° 16' 15.9996'' W
cloud-native gis has arrived
37° 48' 15.7068'' N, 122° 16' 15.9996'' W
cloud-native gis has arrived
37° 48' 15.7068'' N, 122° 16' 15.9996'' W
cloud-native gis has arrived
Maps
Case Study
Case Study: How Sharetown tackles logistics with Felt
Sharetown, a logistics company specializing in large & bulky item returns, uses Felt to manage orders across the U.S.

Mapping Challenges

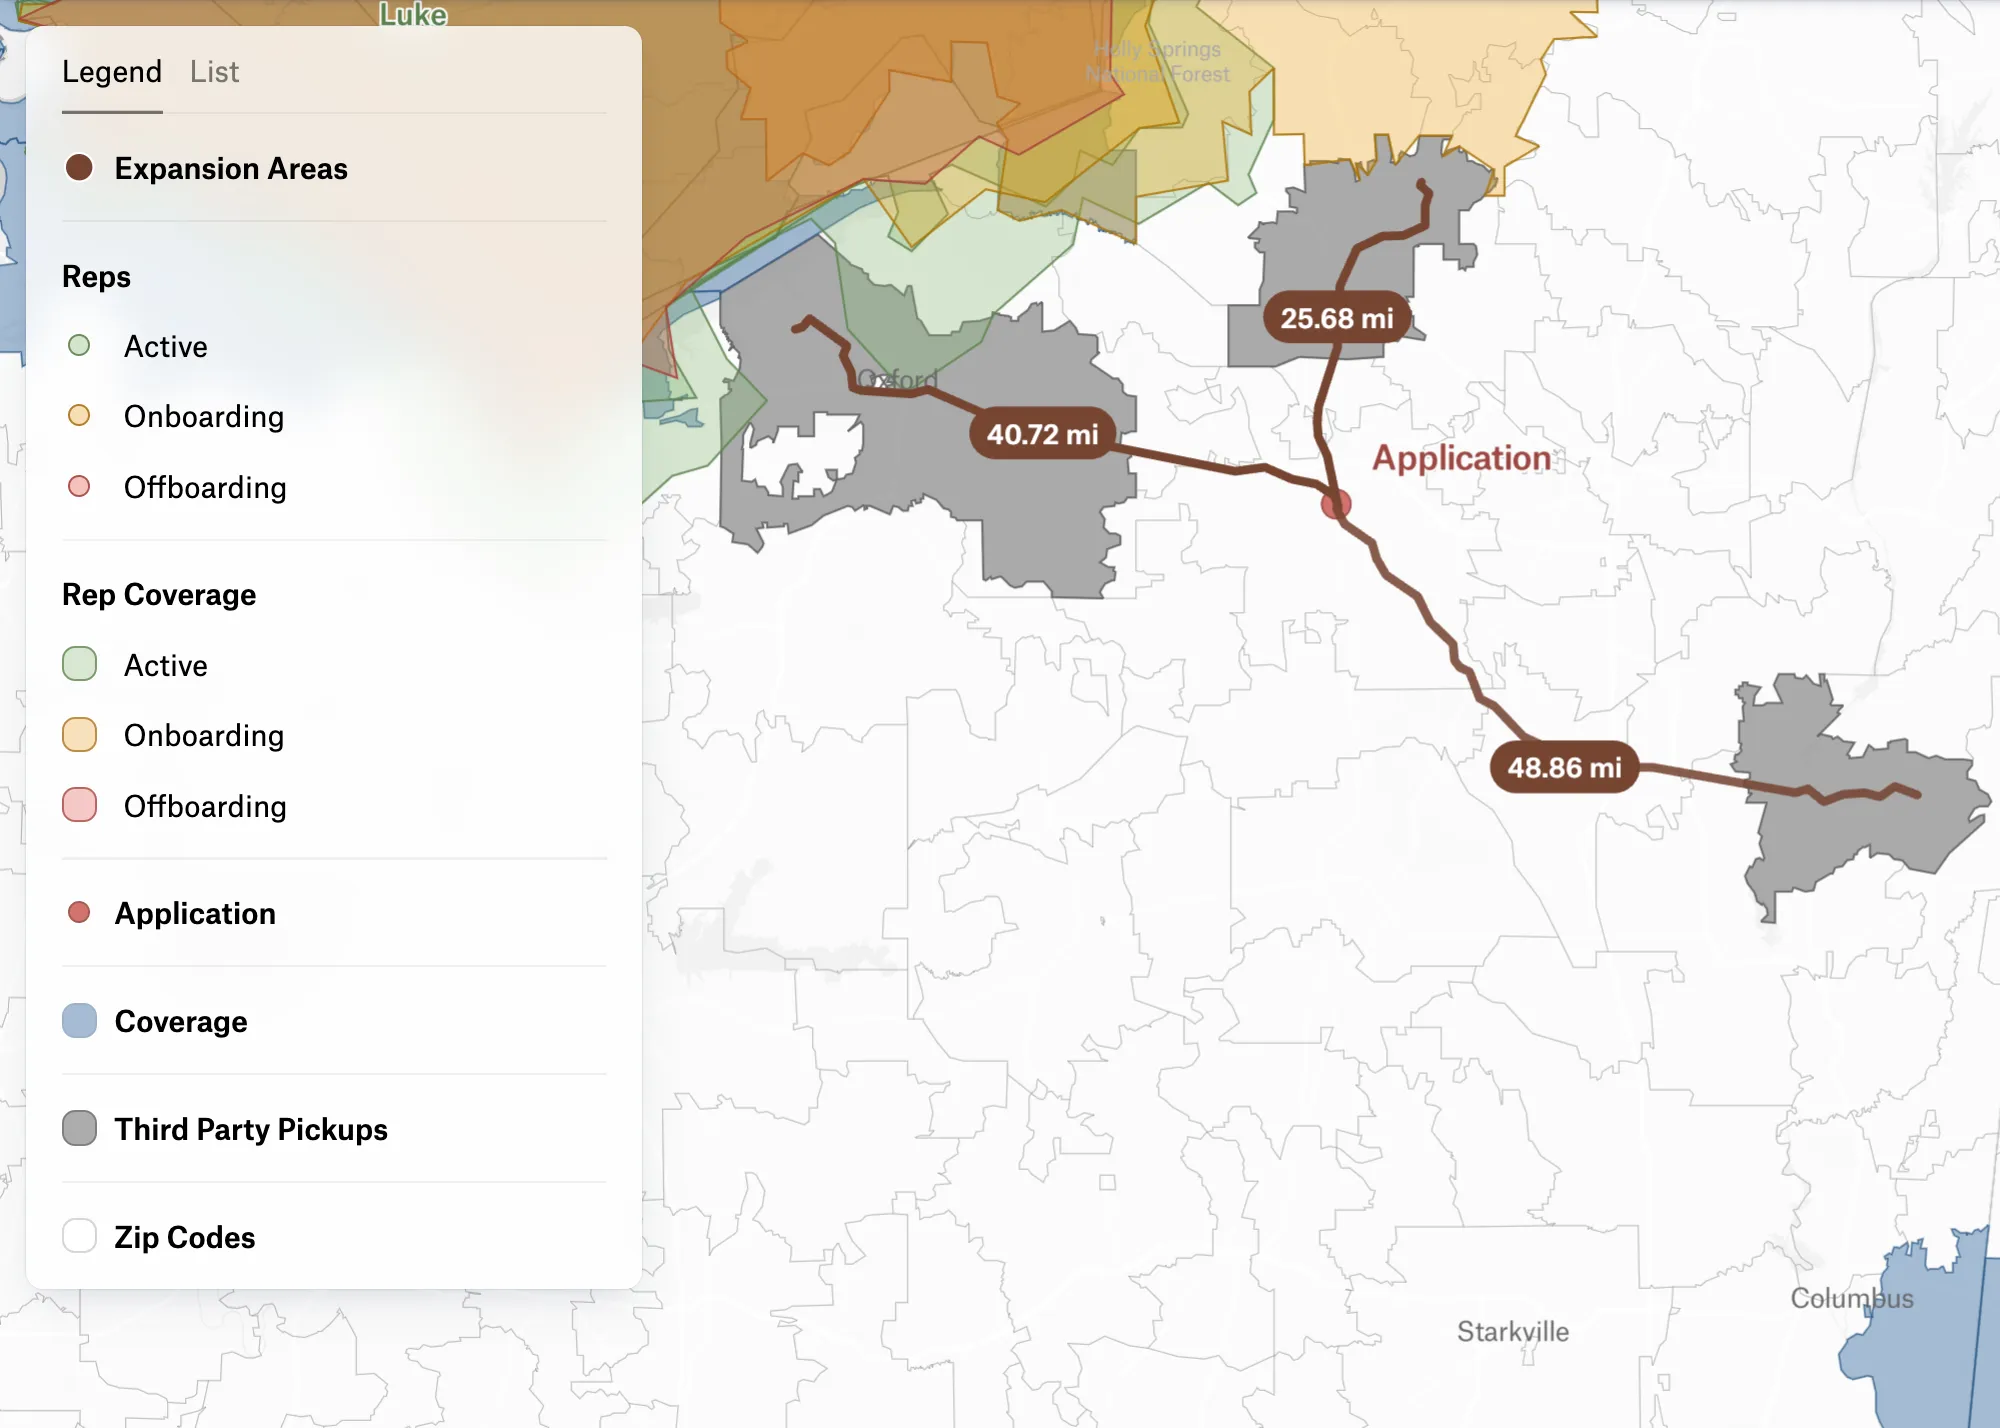
Managing return orders across the U.S. with thousands of reps in the field is an operational feat that brings up complex logistics challenges Sharetown must tackle. The sales management team needs to see Sharetown's service coverage areas to manage order load, proactively identify bottlenecks in the areas they service, and decide where to invest in more coverage. The recruiting team needs to onboard new field reps that continue to expand their nation-wide service coverage.

Mapping the service coverage along with data for all of their field reps was becoming a pain point for the Sharetown team. Before trying Felt, the tool being used was slowing them down. When they tried loading their datasets the product would lock up, causing delays in answering these business critical questions.

Solution

The team found Felt and quickly started visualizing their data. They created a national map for the sales team and update it with new data on a daily basis.

They use Felt’s Upload Anything tool to visualize their coverage networks along with isodistances (custom buffers using road networks) around their reps to see the operational reach for each rep. These layers are styled on the map based on coverage type and rep status.

The sales management team views the map regularly to see the latest in coverage. Sales managers interact with the legend to filter the data, which lets them visually isolate specific coverage types and rep statuses. As each sales manager explores the data, their legend filters are only applied to their view. Different sales managers can view the map at the same time but filter it differently, and this doesn’t change any underlying data or views for other teammates.

The recruiting team maps new applications by address and compares it to existing coverage layers. This allows them to find high-priority applications that will have the biggest impact for the business.

"It is super helpful to look at layers simultaneously to decide where to recruit." - Samantha McCorry, Recruiting Manager

"The Upload Anything feature just worked. The low barrier to entry and ease of use has been huge." - Christina Forker, Product Manager

Results

This map has become a critical part of the operational process for sales managers. Since creating the first version of this map 4 months ago, it has been viewed over 1,000 times. Three months after signing up, the map is now being viewed over 30 times a day by the team.

With Felt, the sales management team now has a visual source of truth, which allows them to explore the data and better understand their coverage across different territories.

Interested in Felt for your team? Chat with us!

"Felt allows us to become more efficient by looking at where our pickup requests come in." - Michelle Denna, VP of Sales
Bio
LinkedIn
More articles