July spotlight: 10 best Felt Community maps
Here is how Felts put maps to use lately — from Barbenheimer history to visualizing OvertureMaps data.

Here is how Felts put maps to use lately — from Barbenheimer history to visualizing Overture Maps Foundation data.
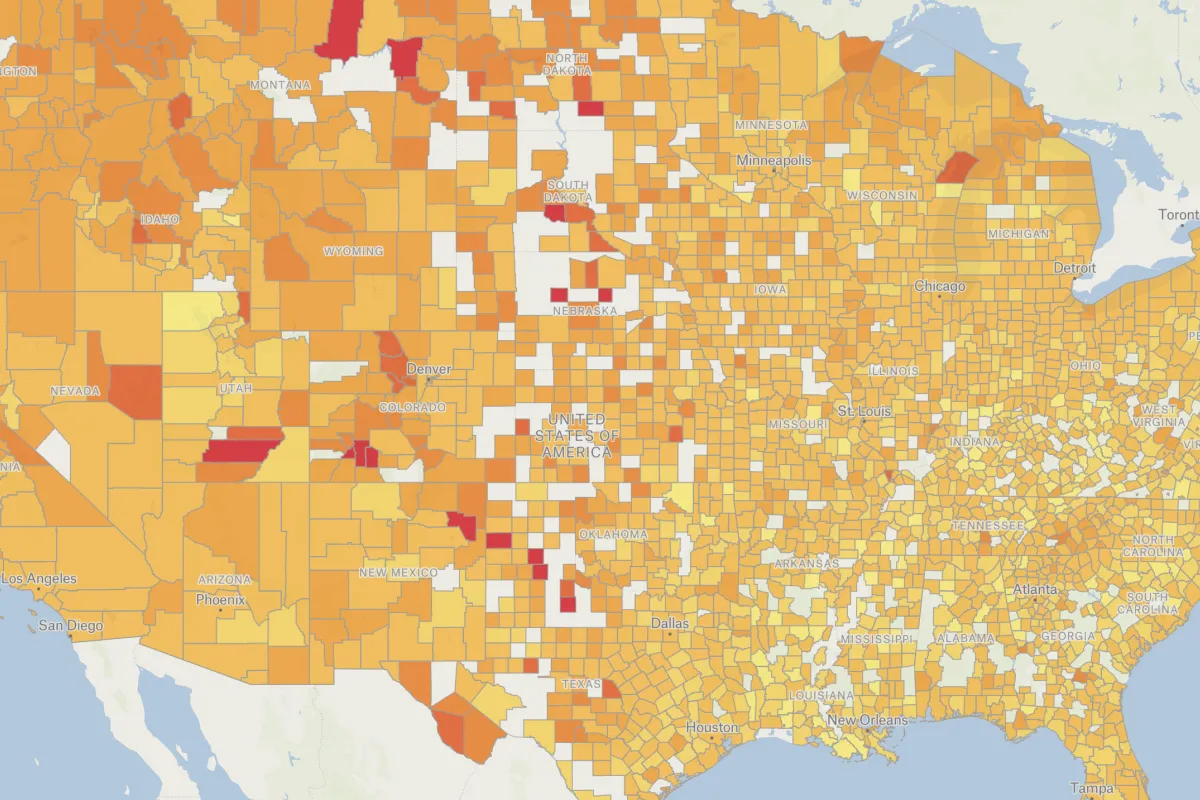
Coffee shops per capita
GIS analyst Shawn Taylor leveraged Overture Maps Foundation’s (OMF) exciting recent release of their first open map dataset to analyze coffee shops per capita. To narrow down the enormous Places of Interest dataset to coffee shops, Shawn used spatial SQL commands in DuckDB (code here), and then styled his map in Felt.
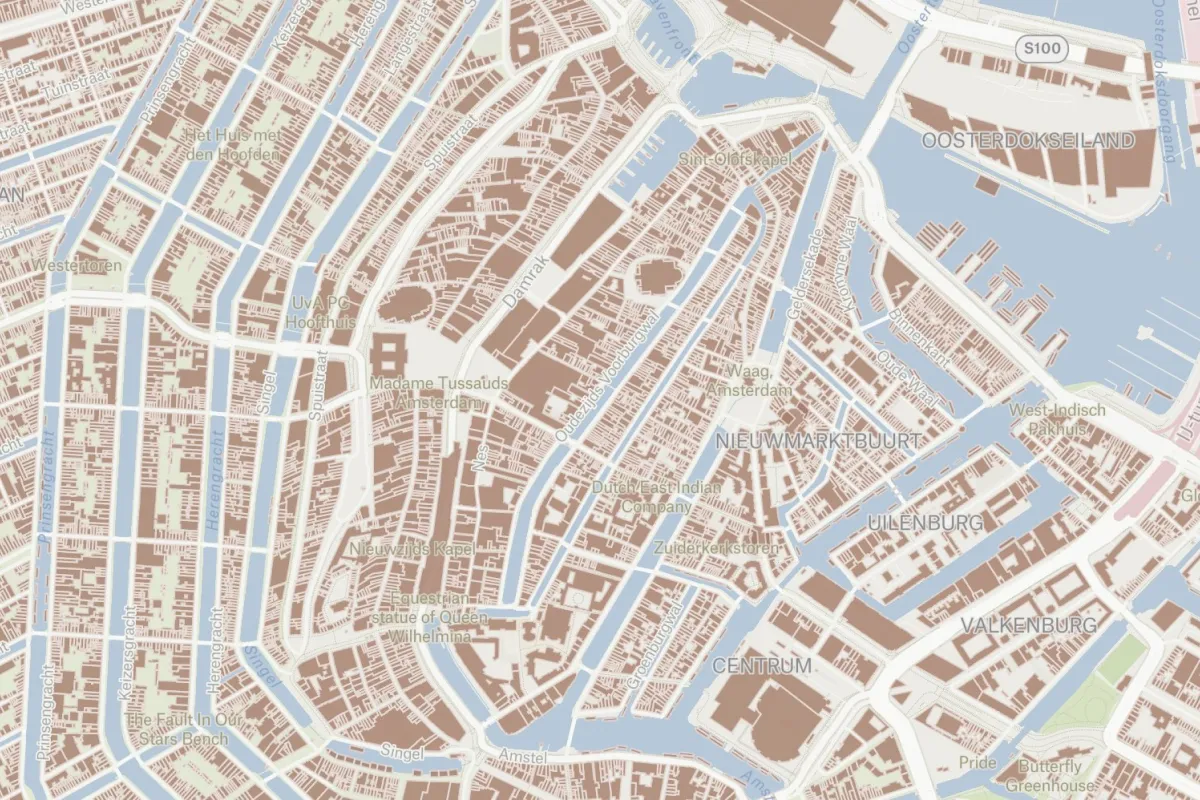
Buildings in the Netherlands
Geospatial Engineer Bert Temme took Overture Maps Foundation building footprints and visualized them in Felt to see what it looks like in his native Netherlands.
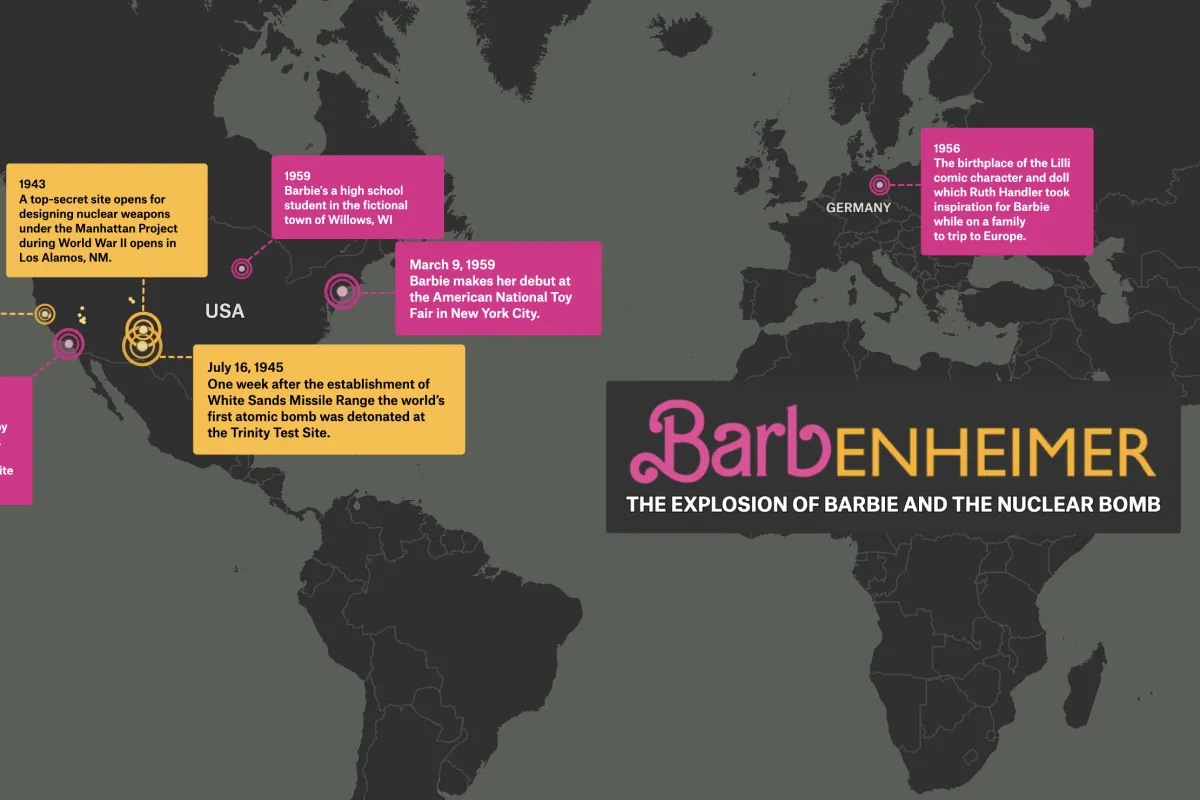
Barbenheimer
Felt’s in-house cartographer Mamata Akella created a map to tell the story behind two blockbuster movies coming out this July, Barbie and Oppenheimer. Did you know Japan was both the site of the first and second nuclear bomb attacks and the first place Barbie dolls were both manufactured and released?
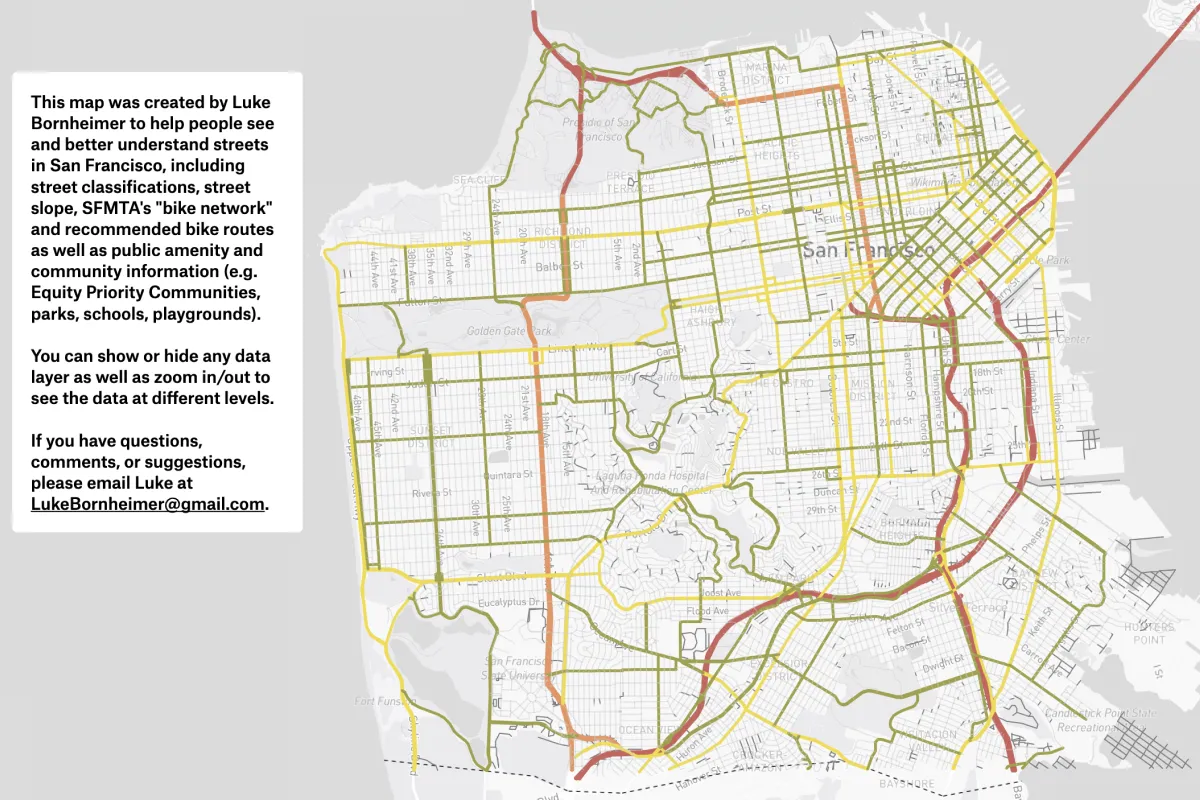
San Francisco Street Typology
To help people explore data related to San Francisco streets, sustainable transportation advocate Luke Bornheimer created a map using 25+ data sources, including street classifications, Slow Streets, Muni routes, street slope, and SFMTA’s “bike network” and recommended bike routes. Whether you want to see Slow Streets, SFMTA’s “bike network”, or a combination of those (or other street data), you can do it with this map.
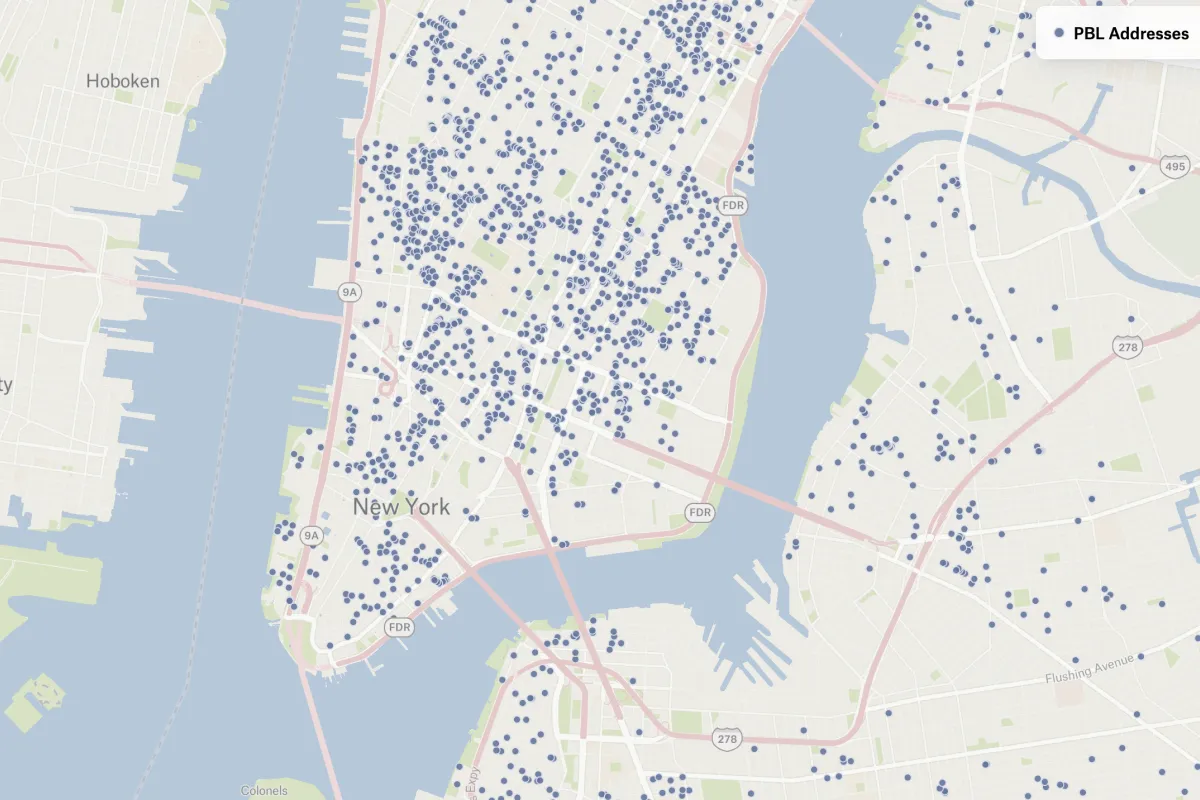
Where Airbnbs aren’t allowed
David Brand and Jaclyn Jeffrey-Wilensky (The Gothamist) used Felt to help New Yorkers find out if Airbnb is banned in their building or not.
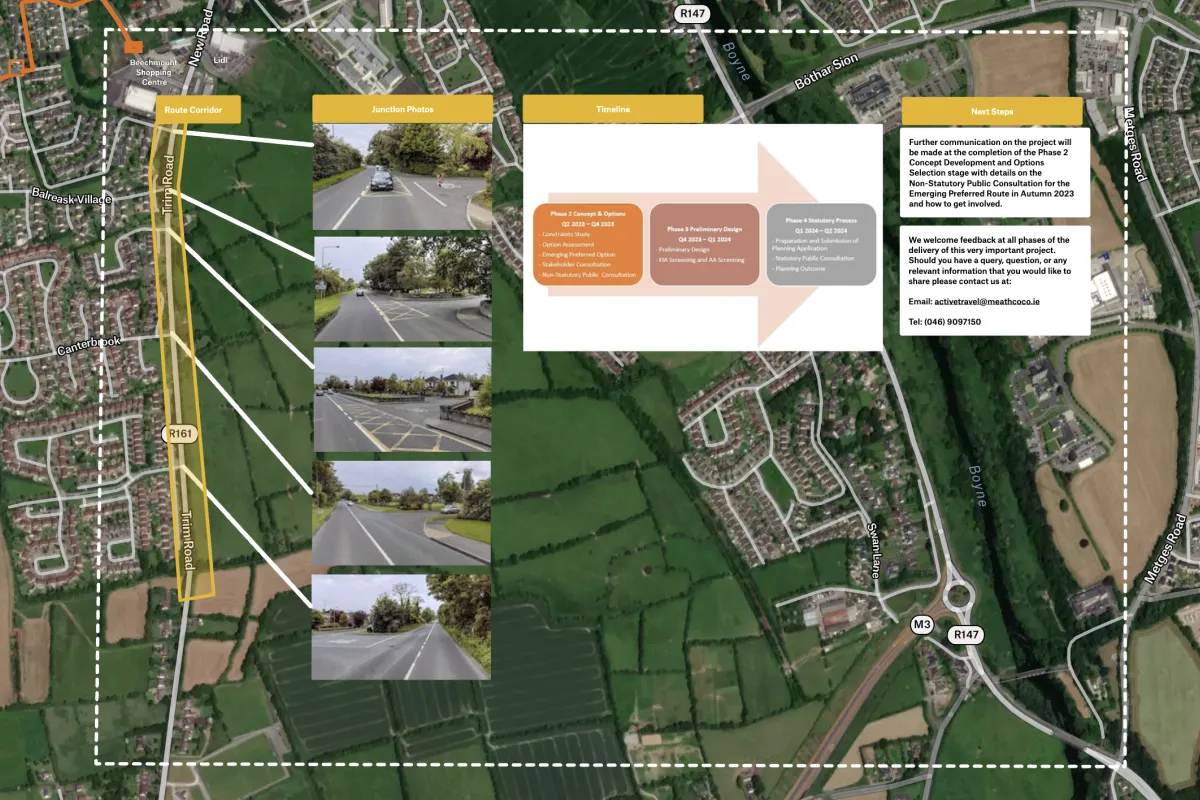
Cycling Routes in Navan Area
Navan Cycling Initiative, and Irish community-based group that aims to make cycling in Navan and surrounding areas safe, enjoyable, and popular, leveraged Felt to propose road improvements and develop a portion of the Navan Cycle Scheme.
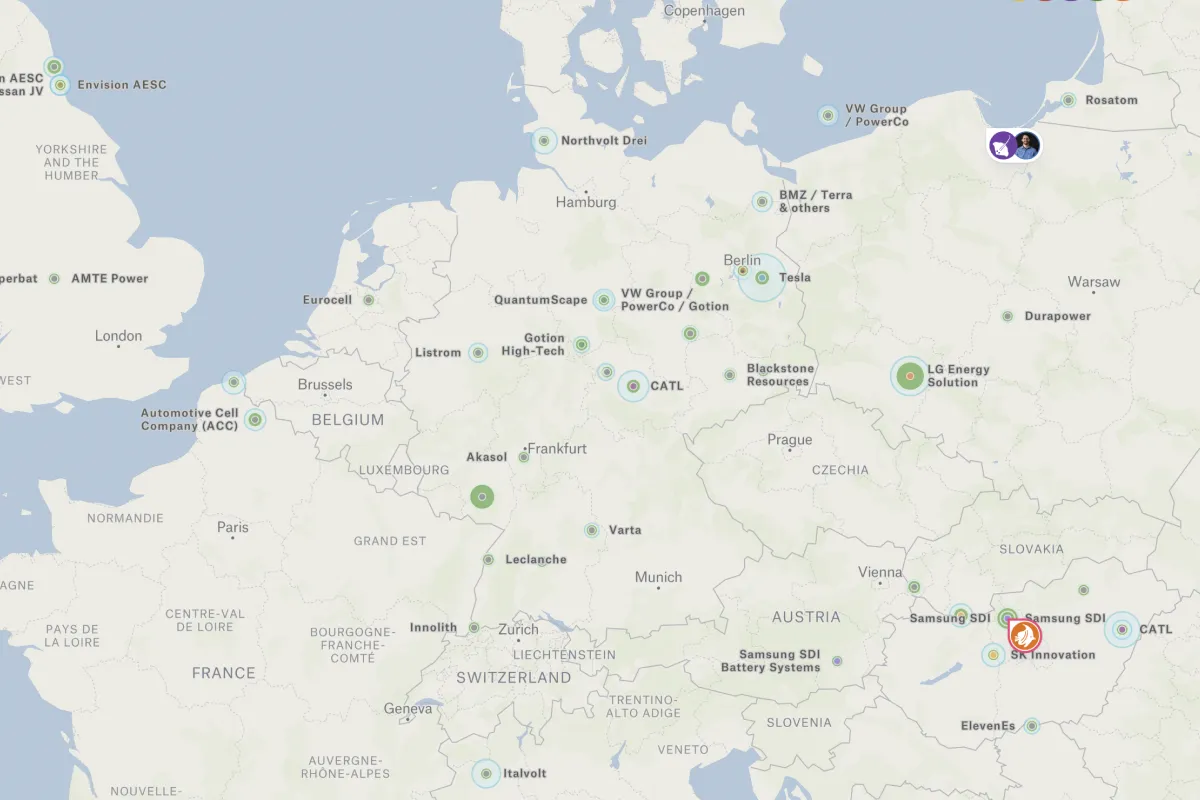
Global Battery Factory Database
David Rogers and Charlie Parker (Ratel Consulting) leveraged Felt to map a comprehensive battery factory database covering the OEM’s scaling up battery production capacity with new factories and industry trends in battery chemistry. To learn more, check out an accompanying blog post published in the Exponential Industry Substack.
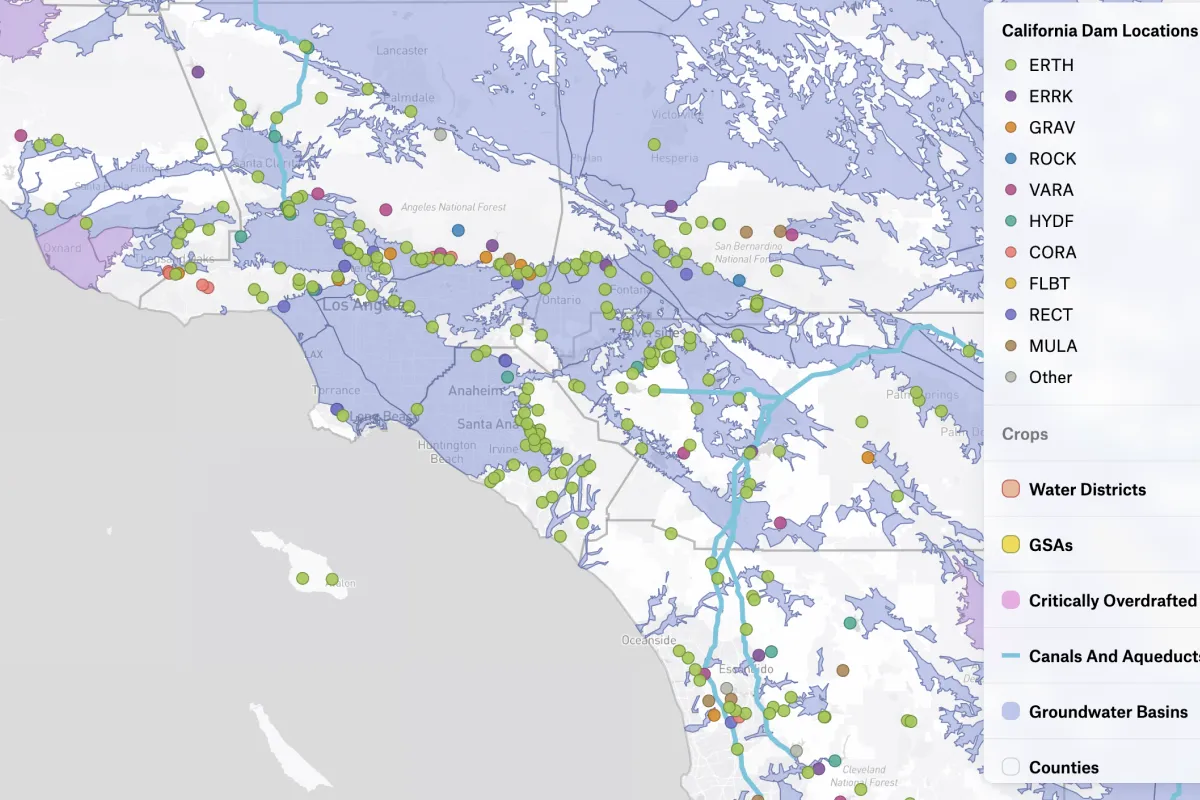
Water Infrastructure and Organization
Hydrogeologist Angelica Rodriguez-Arriaga created a map of water infrastructure in California. You can zoom in from state to local water applications or uses – think dams to fields and all in between!
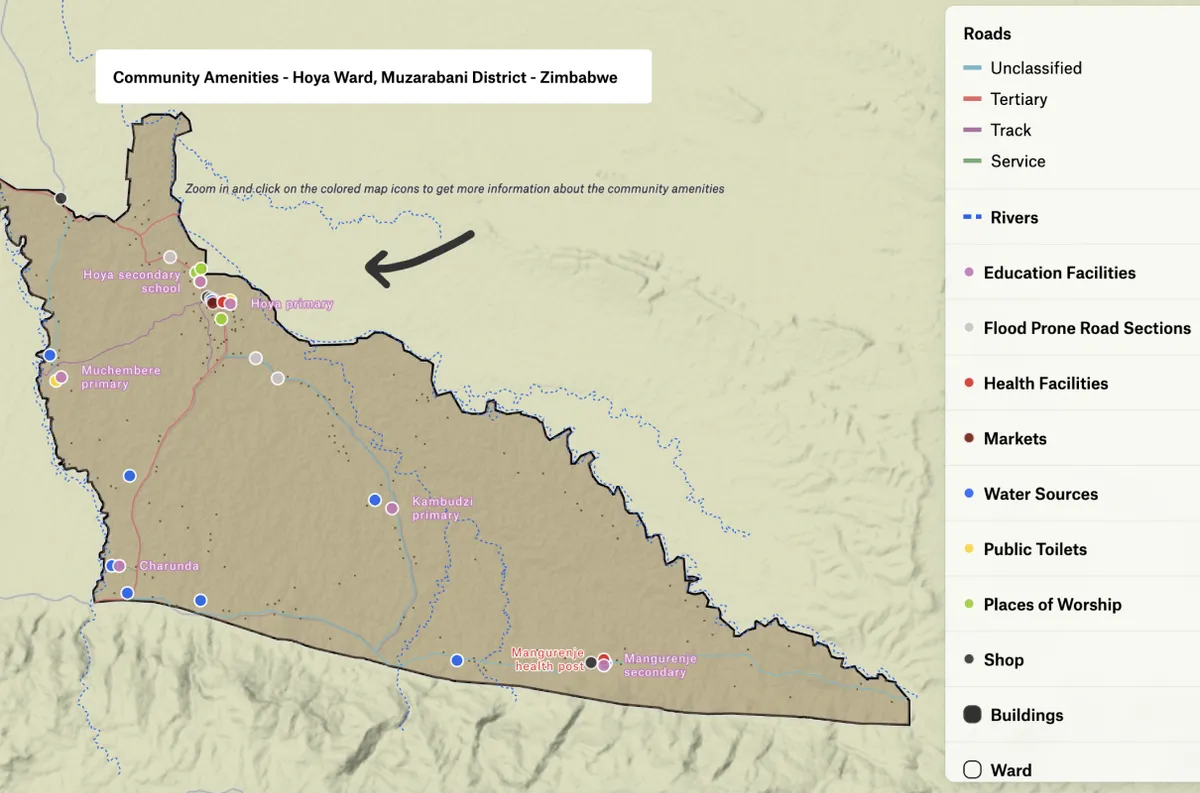
Community Amenities in Zimbabwe
Open Mapping Hub (Eastern and Southern Africa) used Felt to build an interactive map of Zimbabwe. The organization’s Anticipatory Response Program (ARP) aimed to create an asset for improved disaster management, so they came up with this map of the Hoya Ward, Muzarabani (located in Mashonaland Central province in Zimbabwe).
US Senators
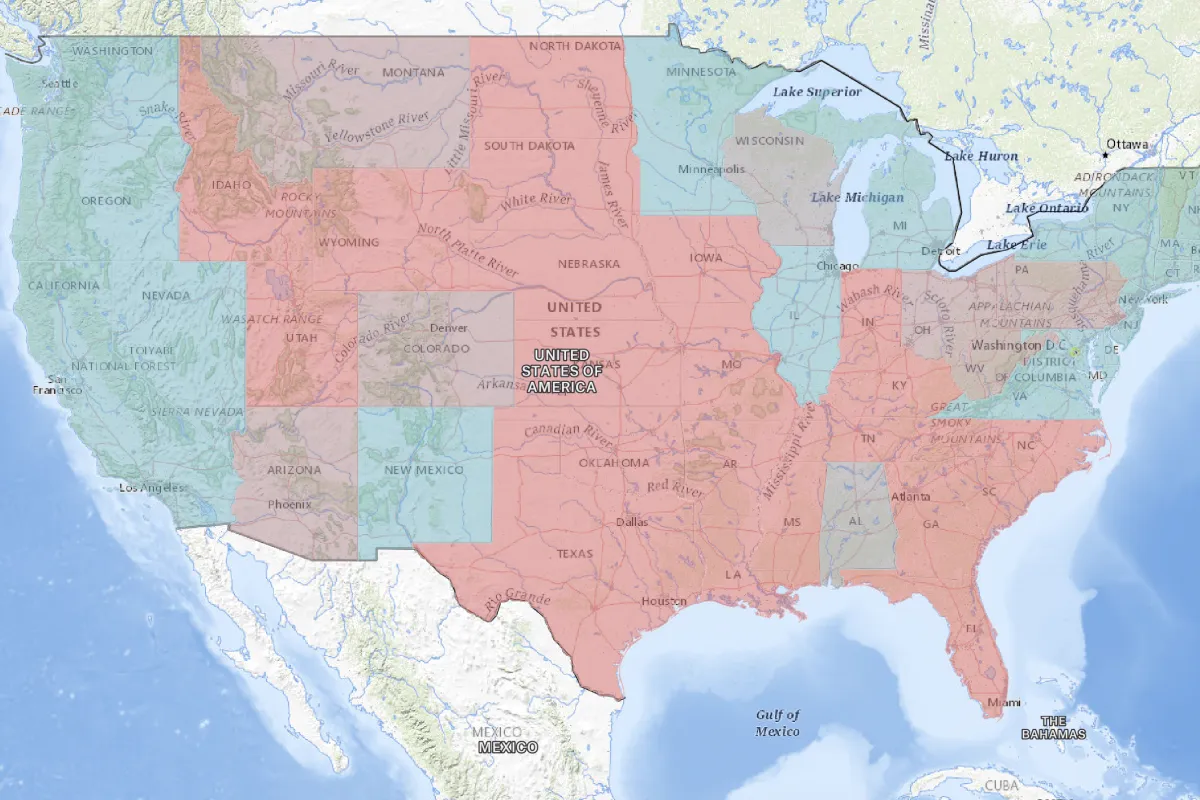
Software Developer Joseph Elfelt mapped the United States based on the party of each state’s senate seats party affiliation. The map utilizes hosted data from ArcGIS REST. Click on any state for attribute data.
Want to share your map and get featured?
Post your map on the Felt subreddit and get feedback from fellow mapmakers!