Redshift: for managing petabyte-scale data in the cloud
In the world of data analytics, Amazon’s fully managed, petabyte-scale data warehouse in the cloud is a go-to option for many — and for good reason. It works seamlessly with the rest of the Amazon Web Services infrastructure, has wide support across the industry. For those in the GIS industry, its native GEOGRAPHY and GEOMETRY datatype support makes working with geospatial data at scale a breeze. And now, you can connect directly with Felt for performant spatial apps & dashboard building.
Felt: Innovating the Mapping Landscape
At Felt, we're committed to pushing the boundaries of what's possible in geospatial technology. Our platform has been continuously evolving, introducing features that make mapping and spatial analysis more accessible and powerful than ever before. Today, we're thrilled to announce our latest innovation: direct integration with Redshift.
Connecting Redshift to Felt: A Simple Guide
Getting Redshift data visualized in Felt is now easier than ever. Here's how you can set it up in just a few steps:
- Create a new, read-only user on your Redshift database for Felt access.
- In Felt, click on the Library in the toolbar.
- Click "+ New Source" and select "Amazon Redshift".
- Enter your connection details, including host, port, database name, and credentials.
- Click "Connect", and voilà! You'll see a catalog of your data with previews.
- Make it live from the layer preview at a refresh cadence of your choice.
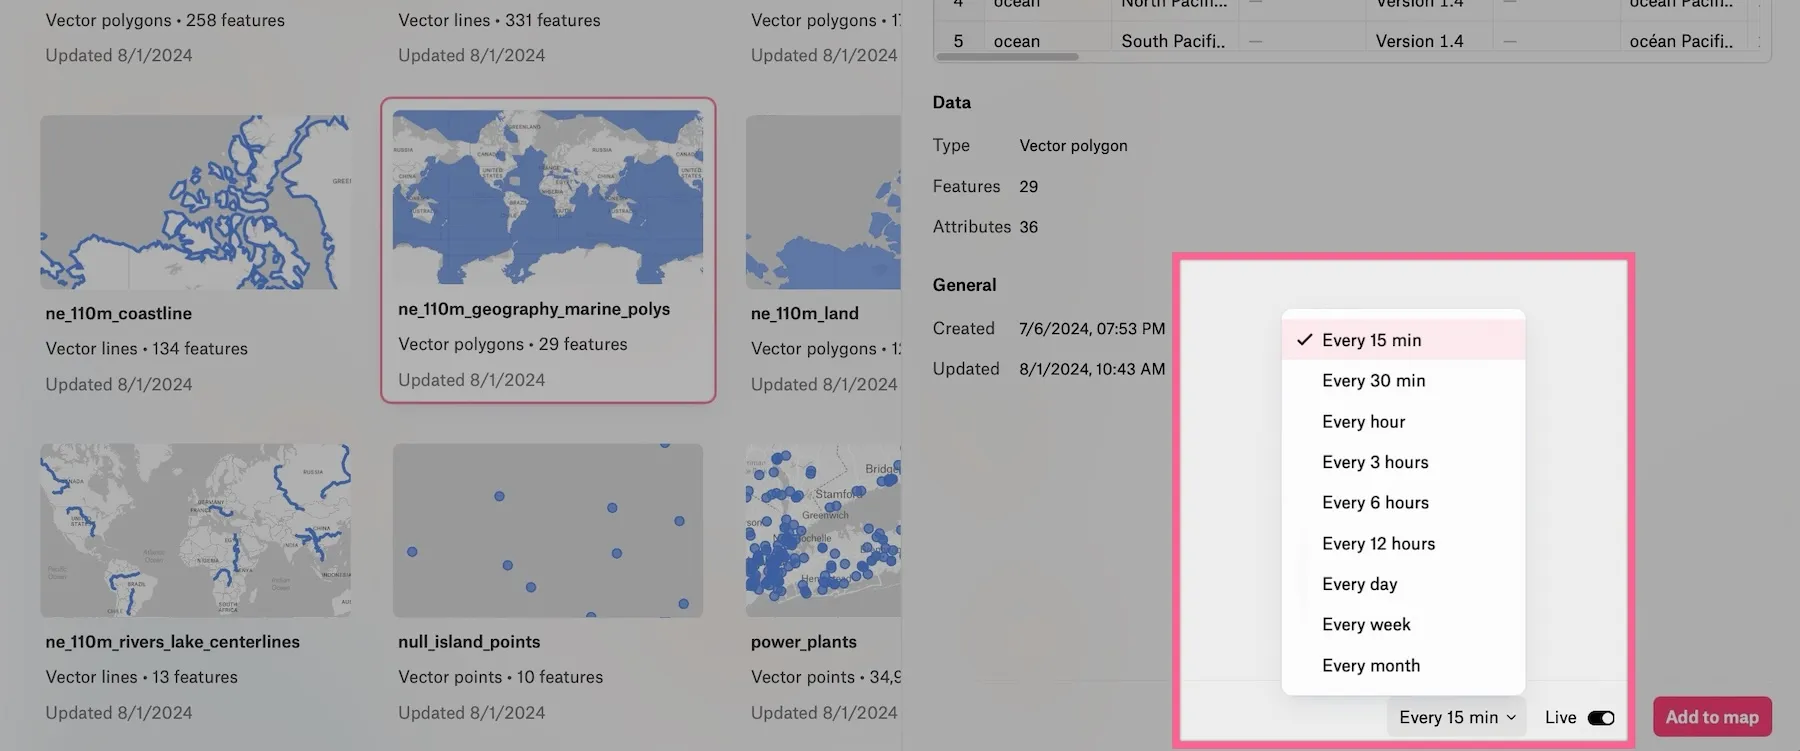
Once connected, you can easily add any of these layers to your spatial dashboards, bringing your dataset directly into your Felt workspace.
Unleashing the Power of Your Location Data with Components
But we didn't stop at just connecting your database. Felt's integration with Redshift unlocks a whole new world of possibilities, including our powerful Components feature. Components allow you to create interactive and informative dashboards that bring your Redshift data to life.
Here's what you can do:
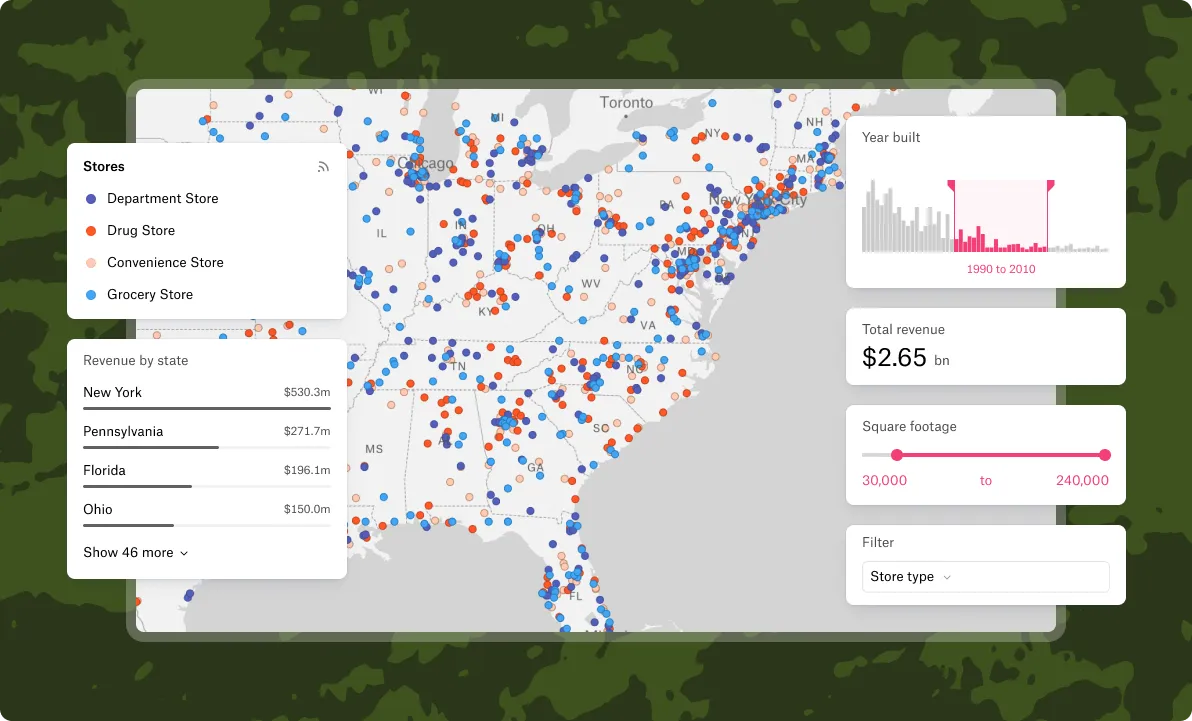
- Statistic Component: Quickly summarize numeric values into essential metrics. Whether you need to show the count of features or calculate sums, averages, minimums, maximums, or medians, this component provides instant insights.
- Bar Chart Component: Visualize and compare categories effortlessly. Perfect for comparing sales performance across different regions or visualizing user demographics.
- Histogram Component: Identify data patterns and trends by displaying frequency distributions. Great for understanding the spread of data points, such as age distributions or elevation profiles.
- Filter Component: Drill down into your data with on-the-fly filtering. Use dropdown menus for categorical data or sliders for numeric ranges, allowing users to focus on the most relevant information.
- Time Series Component: Explore spatial trends over time with an intuitive time slider. Ideal for tracking changes in your data across different time periods, from hourly traffic patterns to yearly temperature variations.
Unlike business intelligence tools like Tableau, Felt’s Components were built from the ground up to handle spatial data analysis. These components work seamlessly with your Redshift data tables, updating in real-time as you pan and zoom your map or apply filters. This dynamic interaction between your database and Felt's visualization tools opens up new avenues for insight and decision-making.
Compare Felt using AI