Most of us have used mapping applications like Google Earth or Apple Maps which let you pan and zoom around the globe; or even design tools like Figma and Photoshop which let you jump around and draw on 2d artboards. Whether it’s a map or an illustration, we like to refer to this design pattern as a “canvas UI”, mimicking the experience of moving around and manipulating a physical canvas.
In this article, I’ll share a bit about how we built a special canvas from the ground up to power Felt’s geospatial drawing tools. We’ll cover some core concepts around canvas UIs and coordinate systems, talk a bit about gestures and viewport transformations, and lastly discuss some of the tricks we use to make our maps feel lightning fast.
Terminology
There’s a lot going on in a canvas UI like Felt, so it’s important to settle on some terminology to start:
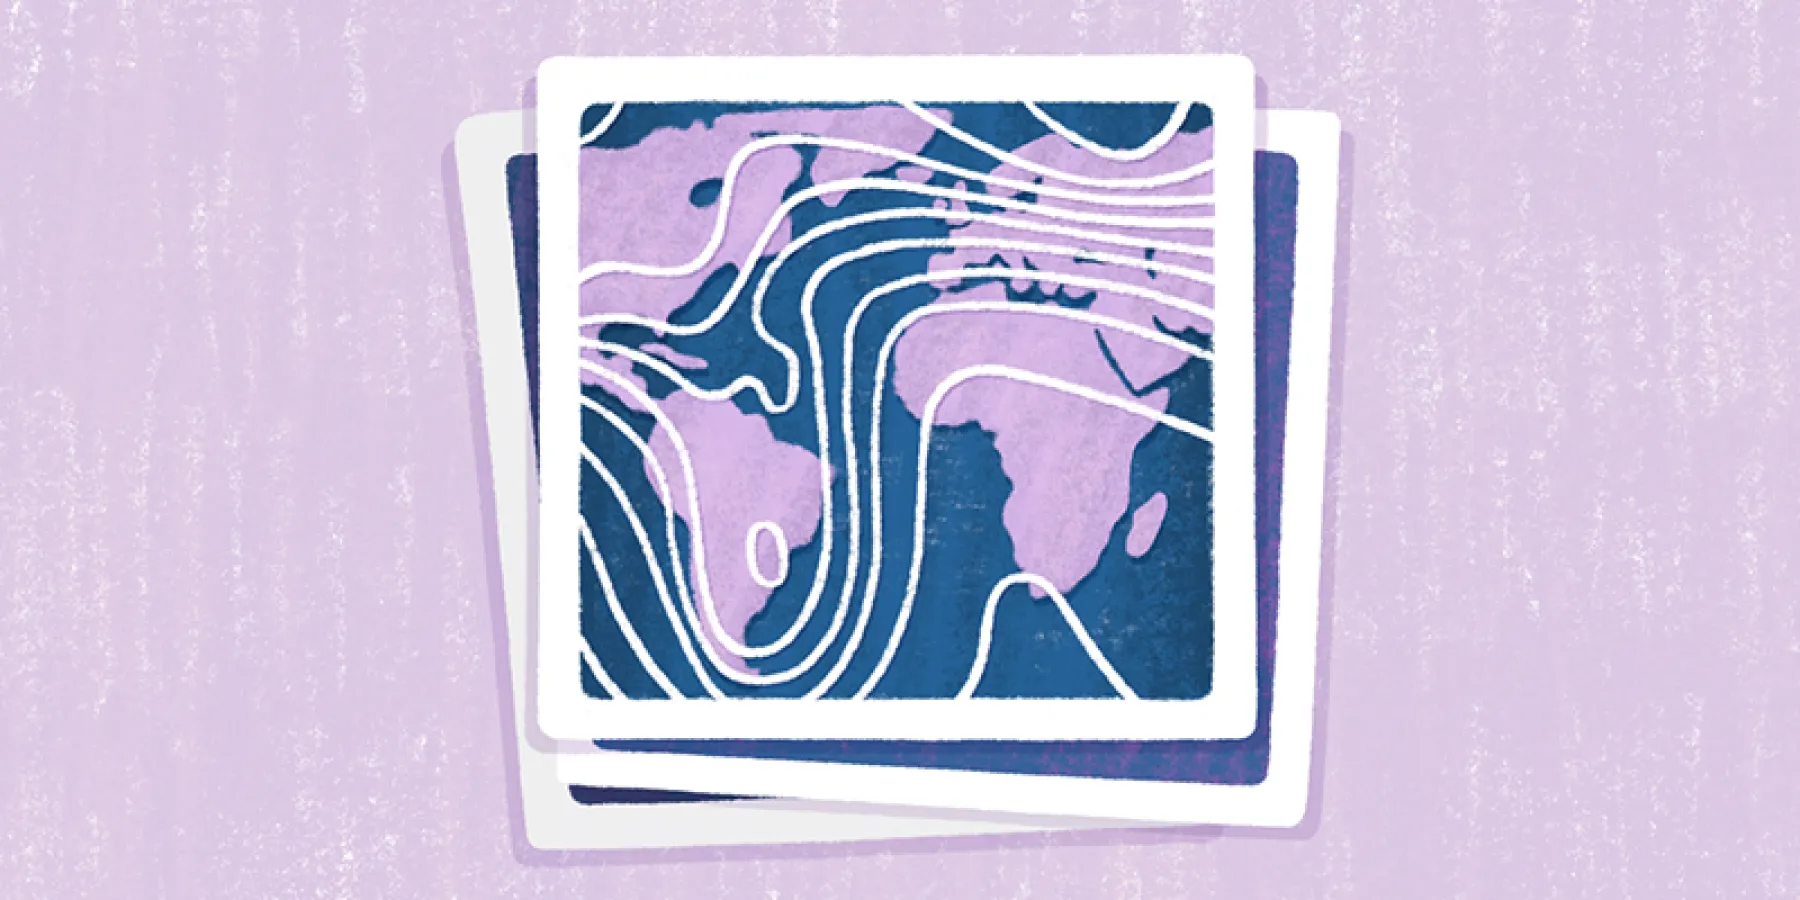
First we have the canvas itself, referring in our case to the two-dimensional representation of the world map as a whole, including any shapes drawn by the user.
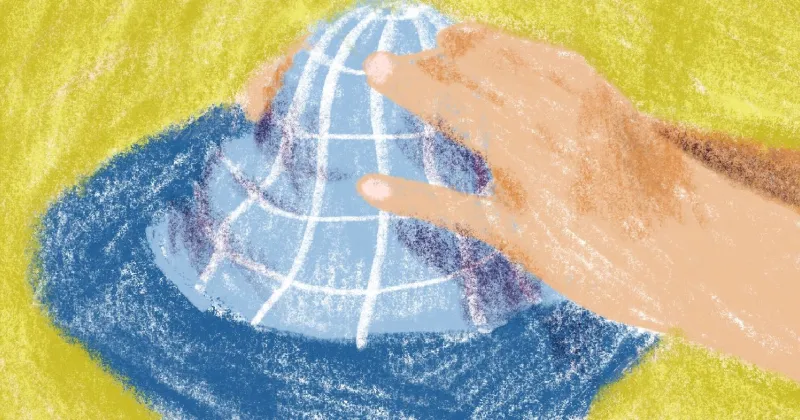
Next, we have the viewport, which refers to the region of the canvas that is visible to the user at any given moment. The current viewport is determined by the geographic coordinate (latitude and longitude) that sits at the center of the viewport, and a numeric value indicating the current zoom level. Along with the viewport size, the center coordinate and zoom level are referred to as the viewport state. Users can affect the viewport state by panning or zooming around the canvas with a variety of gestures, or resizing their browser window.
Note: zoom levels follow an exponential scale, since maps require a relatively very wide range of zoom levels from global to street-level
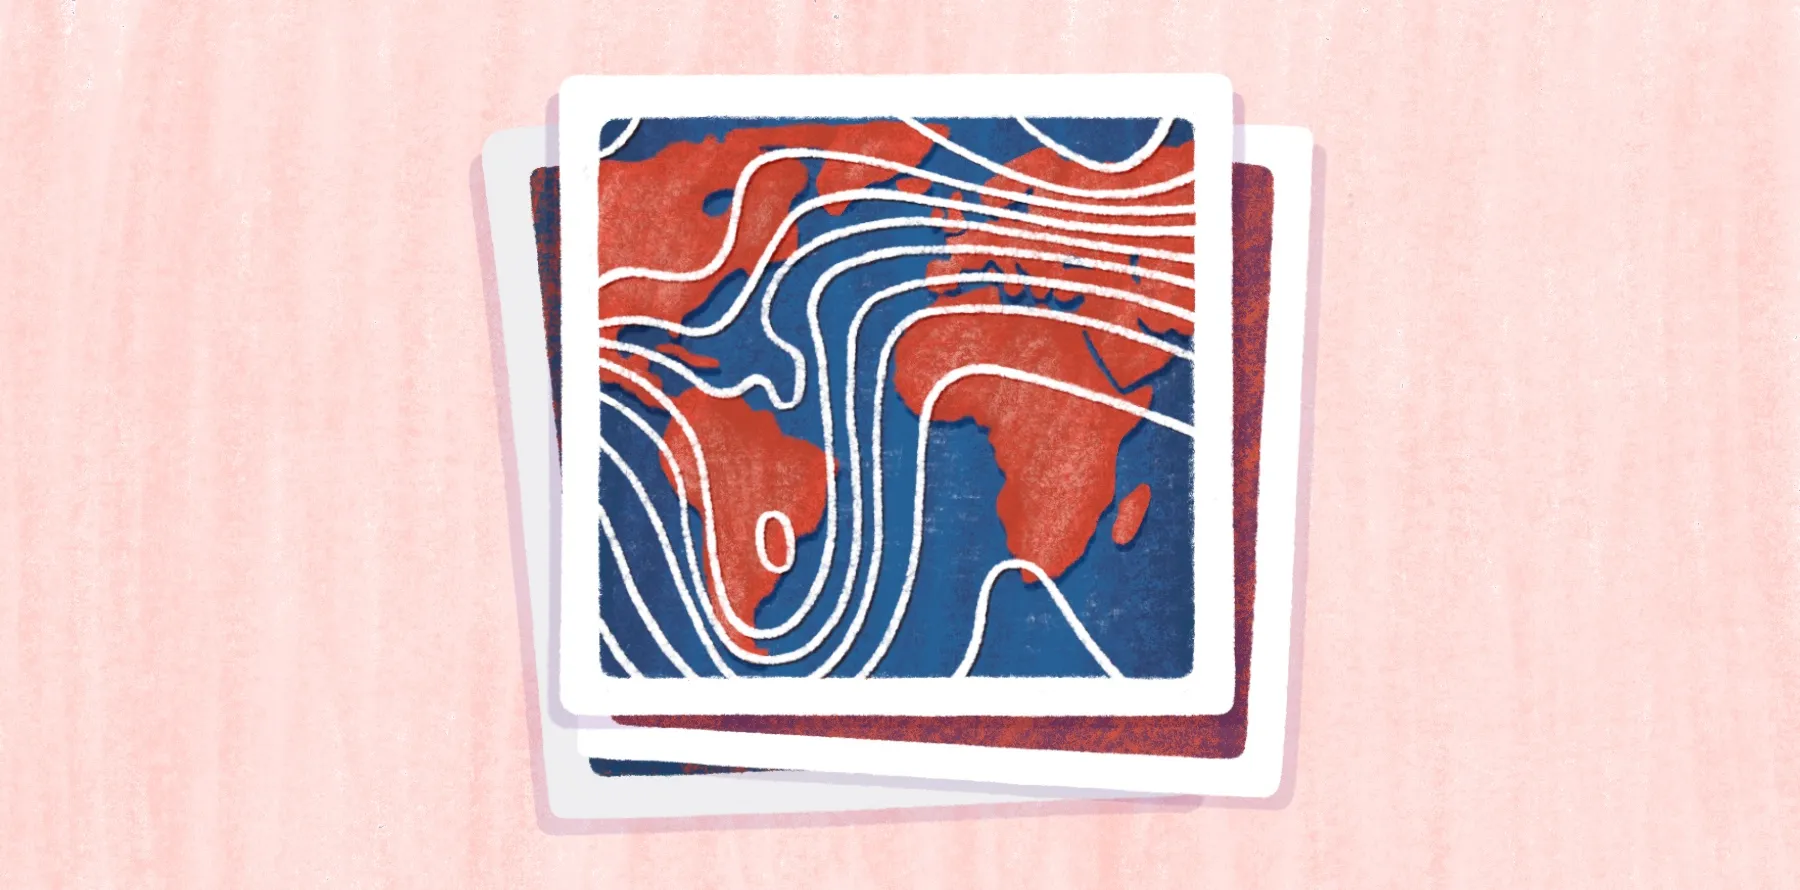
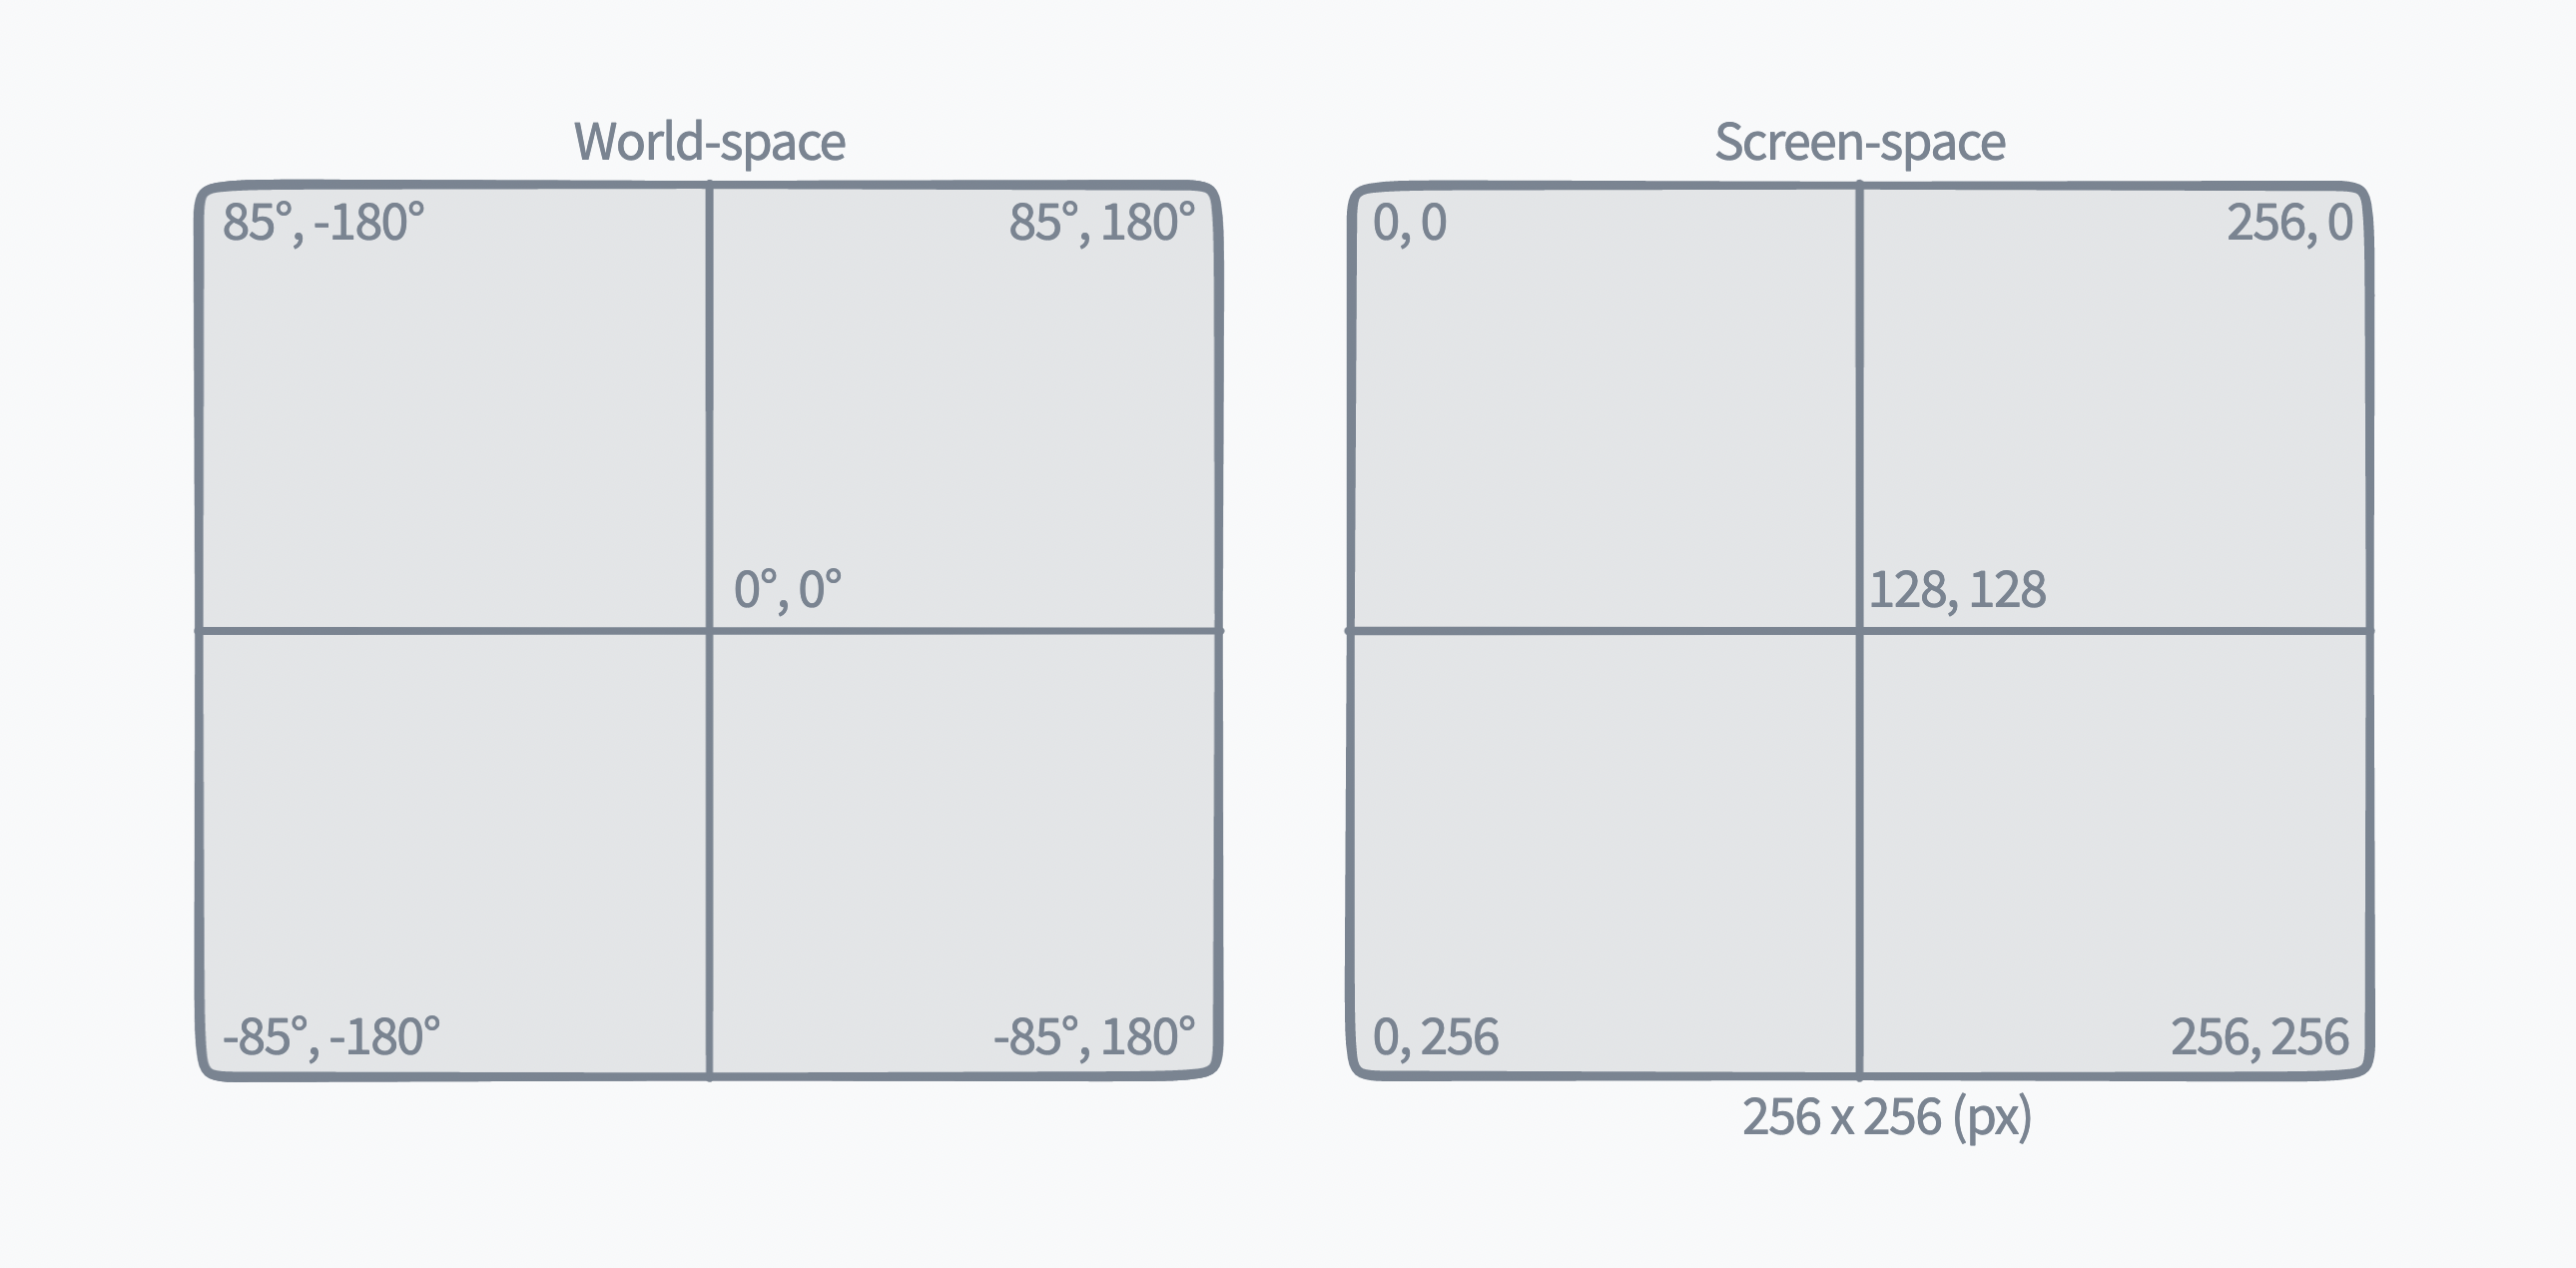
Lastly, we distinguish between our different coordinate systems as world-space (geographic latitude/longitude pairs) and screen-space (display x/y pairs), since everything in Felt exists in a geographic context but ultimately must be drawn on the user’s display in pixels.
Don’t worry if these concepts are a bit confusing at first, this stuff is tricky! Hopefully they will become clearer as we go on.
A note about map tiles
It’s worth mentioning briefly that most web maps are built as a grid of tiles, and Felt is no exception. This is helpful to understand how exponential zoom levels affect map projection and rendering.
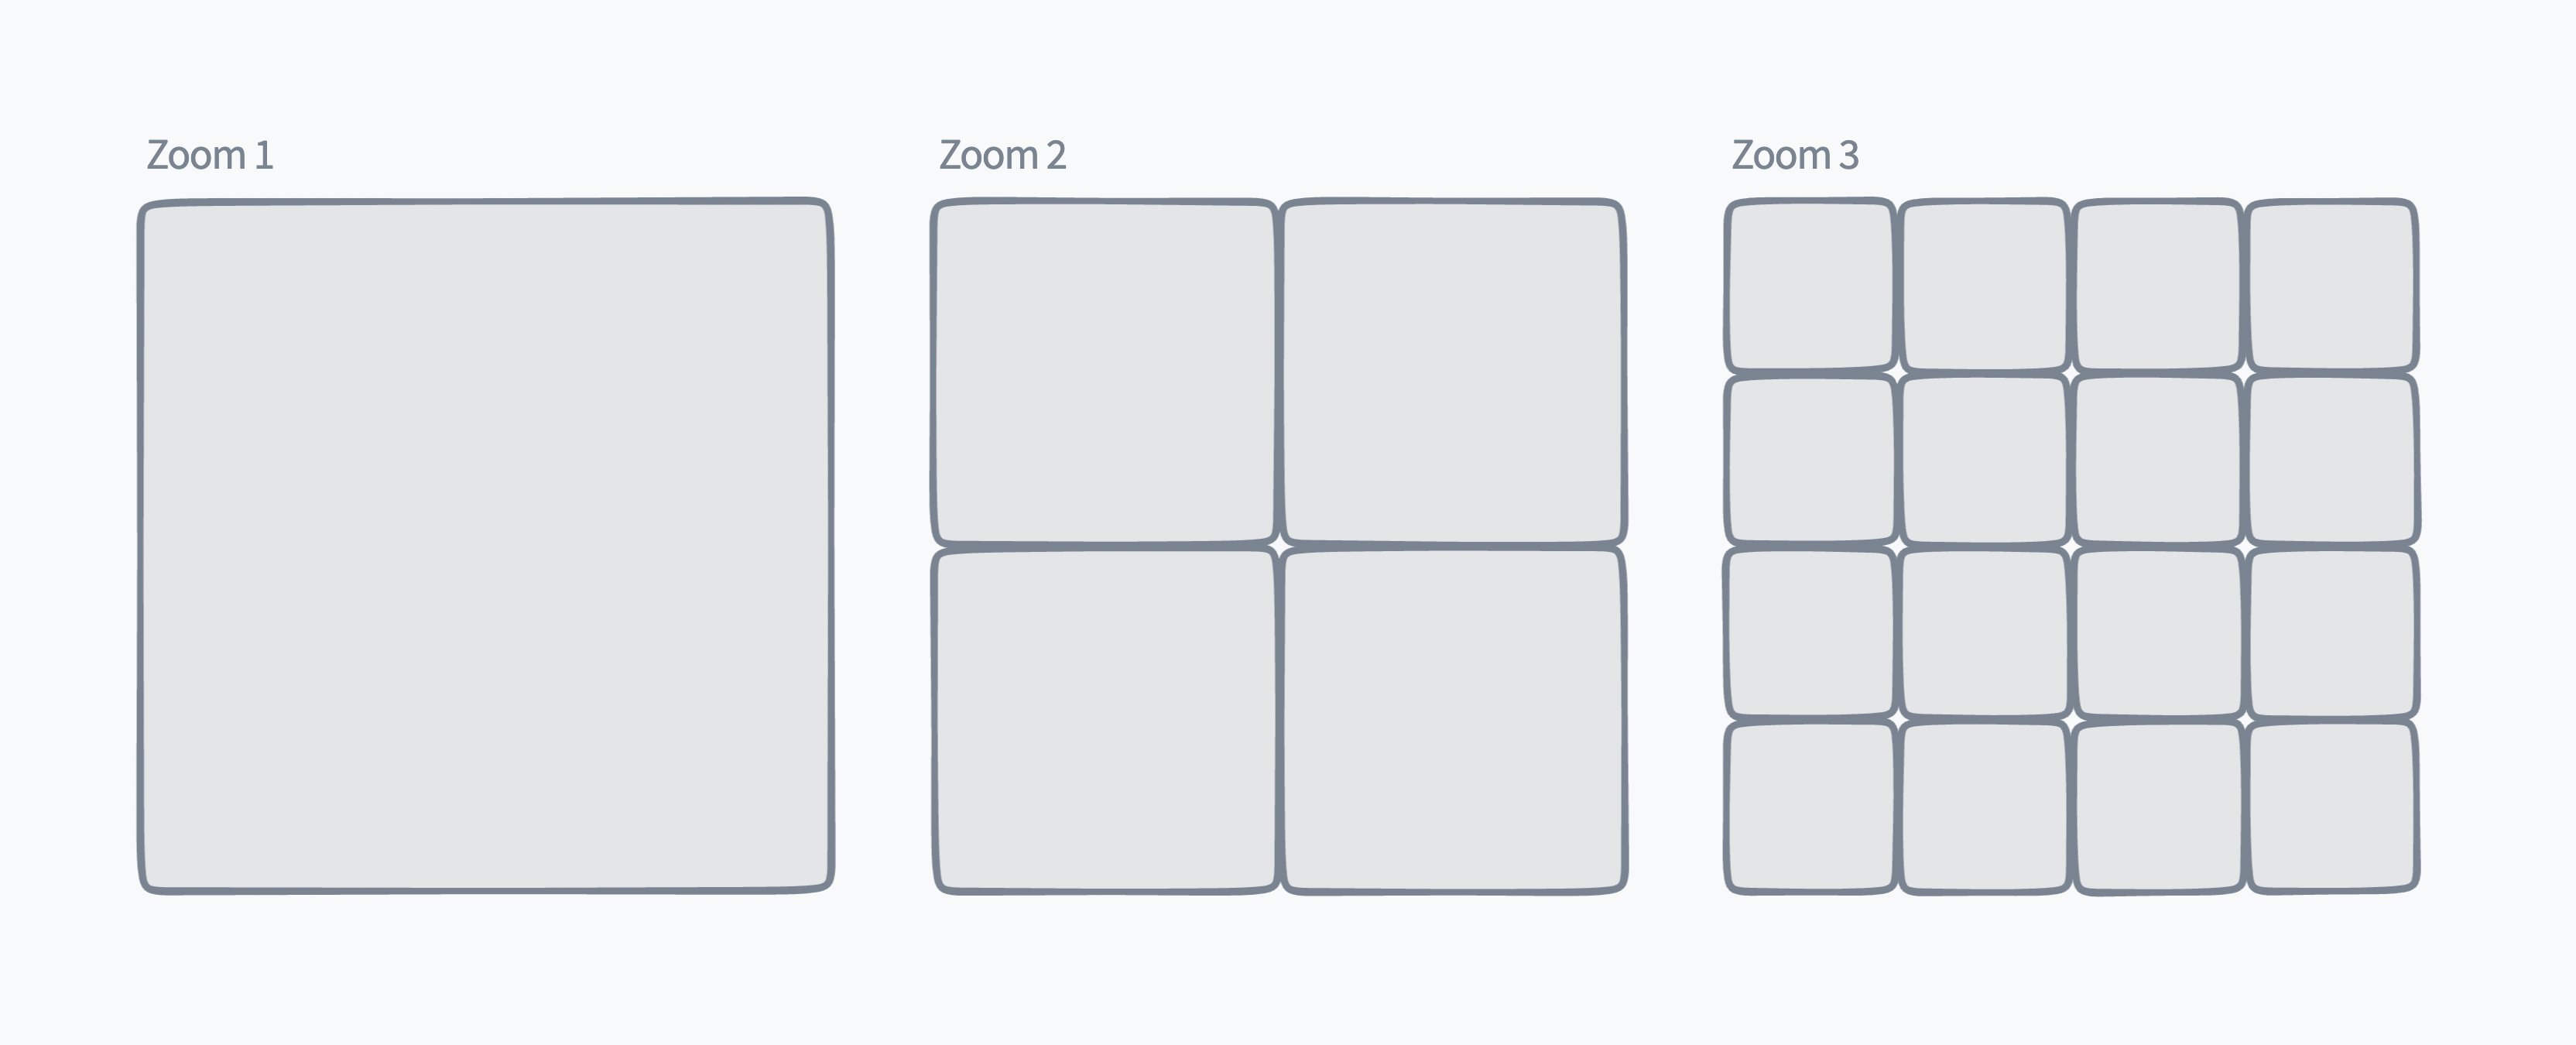
Each tile is 256x256 pixels, and at the lowest zoom level 0, the entire map can fit on a single tile. We also mentioned that our zoom level follows an exponential scale: each whole number zoom level increase then represents a doubling of the tile count in each dimension. For example, we go from 1 tile (1x1) at zoom level 0, to 4 tiles (2x2) at zoom level 1, to 16 tiles (4x4) at zoom level 2, etc..
In our case, we end up with a practical zoom range from 3 to 20, which represents more than a 100,000x scale factor from the lowest to highest zoom level.
Converting coordinates
In order to draw our geographic elements on the user’s display, we need a way to efficiently convert values from world-space to screen-space, and vice versa. This process of converting from a spherical latitude and longitude to cartesian x and y is called map projection.
We won’t dive into the math behind 2d Mercator projection, but it gives us a way to easily convert latitude and longitude coordinate pairs to 2d cartesian coordinates. This means shifting our plane from its center around 0°,0° to originating from a “top-left” corner of -180°,+85°.
Note: latitudes are limited to roughly +/- 85° because the Mercator projection introduces some distortion that becomes impractical so close to the poles.
Once we have a pair of cartesian coordinates, we can then scale and translate them to screen-space display values based on the user’s viewport state:
<p-inline>const [canvasX, canvasY] = projectCoordinates([latitude, longitude])<p-inline>
<p-inline>const screenX = (canvasX + offsetX) * scale<p-inline>
<p-inline>const screenY = (canvasY + offsetY) * scale<p-inline>
Where <p-inline>offsetX<p-inline> and <p-inline>offsetY<p-inline> represent a pixel offset from the top-left corner of the canvas, based on the current viewport center, zoom level, and viewport size. Similarly, since zoom level follows an exponential scale, we determine a corresponding scale factor to resize between zoom levels.
<p-inline>const scale = TILE_SIZE * Math.pow(2, zoom)<p-inline>
Similarly, we can run our formula in the opposite direction to determine the geographic latitude and longitude of a pixel position on the screen, useful for zooming in and inspecting points on the map:
<p-inline>const [canvasX, canvasY] = projectCoordinates([latitude, longitude])<p-inline>
<p-inline>const screenX = canvasX / scale - offsetX<p-inline>
<p-inline>const screenY = canvasY / scale - offsetY<p-inline>
We also use this reverse projection extensively in our drawing tools, since the user is interacting directly in screen-space via touch or mouse, but all of our shape and element data is stored in world-space.
Map projection and viewport testing
As you can see, there’s a decent amount of complexity involved in projecting geographic coordinates onto a movable canvas and ensuring everything ends up where it needs to. To ensure the system is accurate and reliable, we use a handful of automated testing strategies to validate our geographic projection, transformation, and positioning logic.
With a growing number of drawing tools, element types, and viewport transitions, it’s critical that we be able to quickly verify our code is accurate when anything changes.
Manipulating viewport state
As with any interactive canvas UI, users must be able to move and zoom around. In Felt, users have a handful of options for navigating around the map. We’re going to focus on the two primary viewport gestures: pan and zoom.
To perform a pan gesture, users can click (or tap) and drag the map in any direction. In a traditional canvas context, panning is often as simple as translating the viewport position by the inverse of the distance the mouse moved. For example, if the user clicks and drags 30px down and 30px right, then the new center point of the viewport would be 30px left and 30px up from its original position.
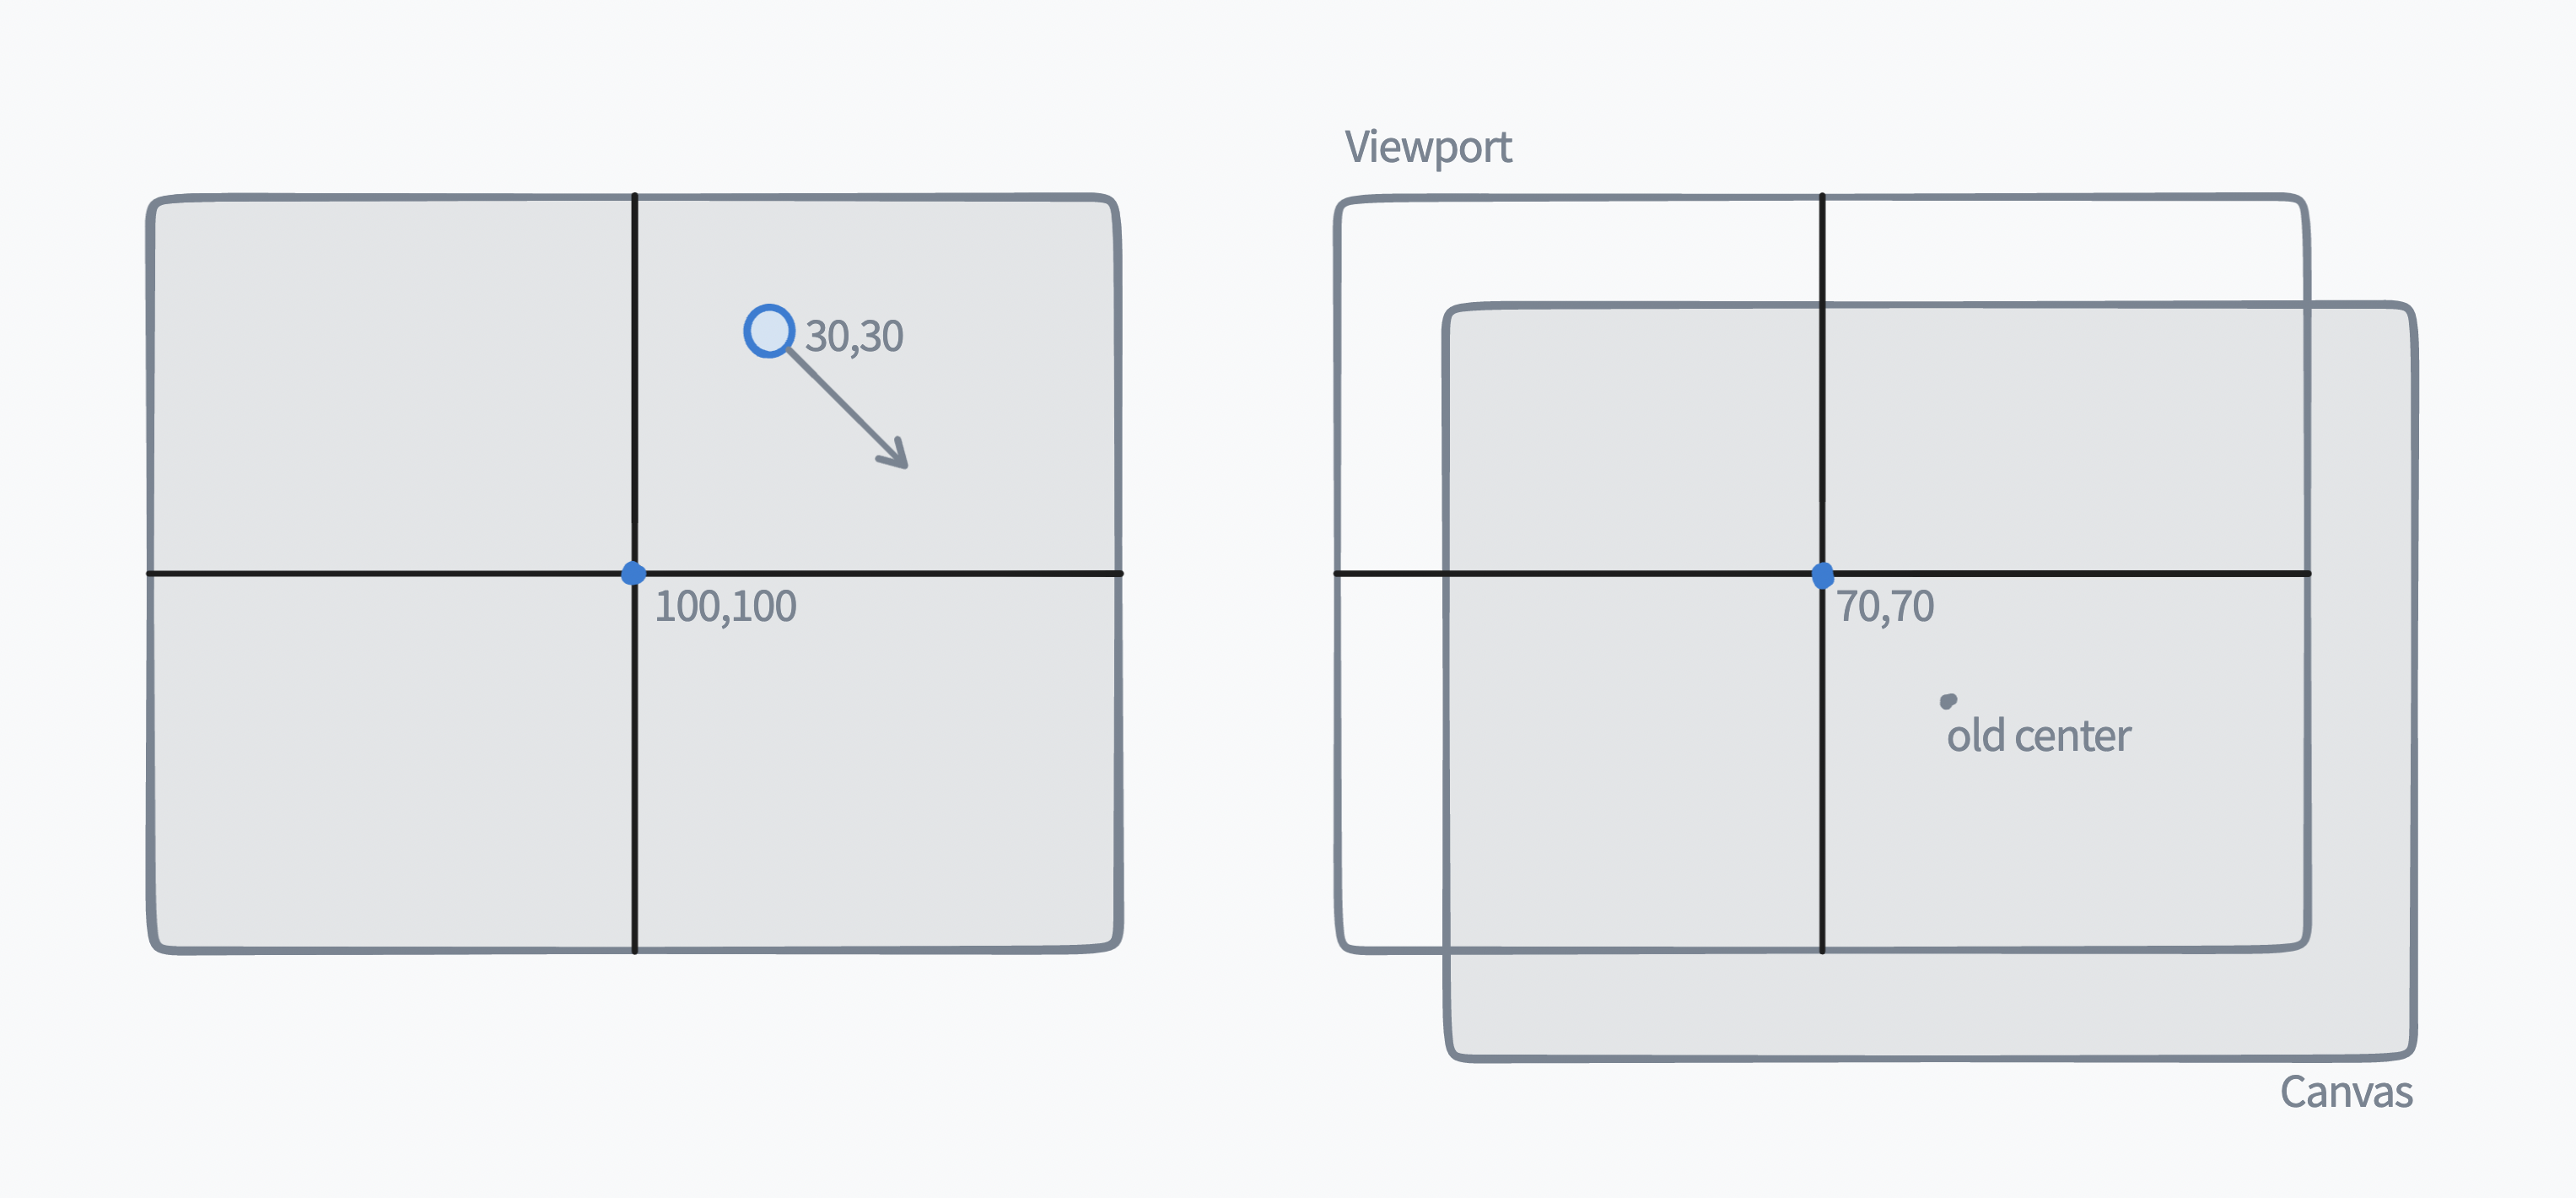
Since Felt’s viewport center is not defined as a pixel offset but rather as a latitude and longitude, we can’t simply subtract the pixel distance of the gesture. Instead, we need calculate the new center coordinate based on the old geographic center and the gesture’s pixel delta, which requires a couple projections:
<p-inline>const [originX, originY] = worldToScreen(oldCenter, viewport.zoom)<p-inline>
<p-inline>const offsetX = originX - gesture.x<p-inline>
<p-inline>const offsetY = originY - gesture.y<p-inline>
<p-inline>const newCenter = screenToWorld([offsetX,offsetY], viewport.zoom)<p-inline>
First, we project the starting center point to a screen pixel coordinate, then subtract the pan delta from each x/y component, and finally <p-inline>unproject<p-inline> the adjusted pixel position back to the new geographic center coordinate. Voila!
Note: we found ourselves doing a lot of arithmetic with two-component vectors like these display pixels and lat/lng coordinates, so one of our engineers Omar wrote some <p-inline>vec2<p-inline> helpers to make it a lot cleaner. E.g. <p-inline>add([2,2], [4,4]) = [6,6]<p-inline>.
Users can also click the zoom buttons in the app to jump up and down zoom levels, but most commonly users will scroll their mouse wheel to zoom in and out around a point. That last bit is key, as zooming around a point is not just as simple as adjusting the zoom level of the viewport state.
Let’s take a look at how this works in practice. Notice below how the geographic point under the cursor stays under the cursor while zooming in and out:
In order to accomplish this effect, we need to calculate the new center point of the map based on the old viewport center coordinate, the user’s mouse position, and the zoom delta from start to finish (note: we’re using a few helpers to provide a simplified mouse x/y and wheel delta):
<p-inline>const zoomCoord = screenToWorld(mouse.xy, viewport.zoom)<p-inline>
<p-inline>const centerPoint = worldToScreen(viewport.center, viewport.zoom)<p-inline>
<p-inline>const zoomPointDelta = sub(mouse.xy, centerPoint)<p-inline>
<p-inline>const newZoom = viewport.zoom + mouse.wheelDelta<p-inline>
<p-inline>const newZoomPoint = worldToScreen(zoomCoord, newZoom)<p-inline>
<p-inline>const newCenterPoint = sub(newZoomPoint, zoomPointDelta)<p-inline>
<p-inline>const newCenter = screenToWorld(newCenterPoint, newZoom)<p-inline>
At the start of the gesture, we calculate the geographic position of the mouse to track the position around which to perform the zoom (<p-inline>zoomCoord<p-inline>), and similarly calculate the pixel offset from the viewport center to the mouse cursor which we will need to reconstruct the new center.
On each scroll event, we continuously calculate the new target zoom level by applying the mouse’s scroll wheel delta cumulatively to the initial zoom level. We can then use the target zoom level to project the new pixel position of the original <p-inline>zoomCoord<p-inline>. We then apply the <p-inline>zoomPointDelta<p-inline> to that new zoom point to find the new viewport center point in pixels, and do one last <p-inline>unproject<p-inline> to find the new center point latitude and longitude.
Canvas optimizations
As the user zooms and pans around the canvas, we need to make sure we’re successfully updating the positions and sizes of any elements they may have drawn. However, a map with a lot of complex shapes can easily reach into the tens of thousands of coordinate pairs. Projecting all of those geometries at 60 frames per second would be expensive and impractical, so we developed a few optimizations to take advantage of the browser’s GPU accelerated SVG transformations.
Transient canvas transforms
Specifically, when the user starts any gesture that might affect the viewport position, we immediately take note of the original viewport state. Then, as we calculate the new viewport position, we can easily derive a transformation that we can use to translate and scale existing element geometries to their new positions and sizes. So, rather than continuously projecting every last coordinate pair on every single frame, we calculate a single “viewport transformation” that can be applied to all of them.
To take it a step further, we don’t actually need to apply that transformation to every single element individually, but rather to a single parent layer that contains all of the shapes as children. This results in a single compositing layer being translated and scaled, and makes for highly efficient zoom and pan gestures.
Finally, when the user stops their gesture, we do actually recalculate the projected position of each coordinate pair, and in a single frame swap the old geometries for the new, and remove the temporary transformation.
Regular reprojections
We do still need to recalculate geometries when a gesture completes because our zoom range is so wide (remember: our highest zoom level represents more than a 100,000x scale factor over our lowest zoom level), and even modern browsers start to struggle when scaling text and SVGs by such enormous factors. Performing regular reprojections does however enable a number of other optimizations, and so far we’ve found it worthwhile.
For example, we store elements at high resolution in world-space so they look crisp and clear when zoomed all the way in, but this leads to an excessive number of coordinate projections when the user is zoomed out, resulting in unnecessary sub-pixel geometries.
To avoid this extra work, we dynamically simplify element geometries based on zoom level to ensure that we rarely project world-space coordinate pairs that would result in sub-pixel geometries in screen-space.
Try it yourself
It’s been really exciting to see a lot more of these canvas UIs bring built. Chances are you use one or more of these on a regular basis, but until now you may not have considered what goes into making a canvas feel fast and familiar. I hope this was a fun and informative overview of how our geospatial canvas works at Felt.
As our users build more and more complex maps, we’re always looking for ways to speed up our canvas UI and keep things running smoothly. If that sounds like a fun challenge–apply today!
Compare Felt using AI


.webp)