


Today we’re delivering on one of our top customer requests: enabling users to go deeper with their data – to filter, to search, and to view more of it, on the fly, and find answers as fast as possible.
Working with geospatial data is a complex task. It’s not just about plotting features on a map but finding the right trends and insights, often buried in a sea of data. In agriculture, you need to find the fields that need most attention. Urban planners must hone in on crucial parts of the road network. And when performing data cleaning and quality assurance, quick filtering is essential to addressing inconsistencies or errors in the data.
With all this in mind, we got to work and completely overhauled core components of Felt to bring users the fastest, most streamlined data discovery experience on the internet.
- An improved table view that allows sorting, searching, and filtering through your data
- A new filtering tool that makes it possible to show just a subset of your data, both on the map and in the table.
- A revamped search tool that lets editors and viewers find not only places on Earth but also features in your data layers.
- Updated cartographic controls including histograms, raster popups, and more categories (all of them!) in your visualizations.
Because it’s not just about doing more, it’s about doing better.
The table experience you deserve
Most GIS specialists quickly learn that the “attribute table” is just as important as the map itself. Yes, being able to visualize the location of a feature is necessary, but that location is just one more property of all the data that needs to be analyzed.
This tabular component serves as the informational backbone to spatial data, encapsulating a wealth of non-graphical data linked to geographic features. By associating attributes such as names, IDs, and quantitative measurements with spatial entities, the table facilitates the extraction of meaningful insights.
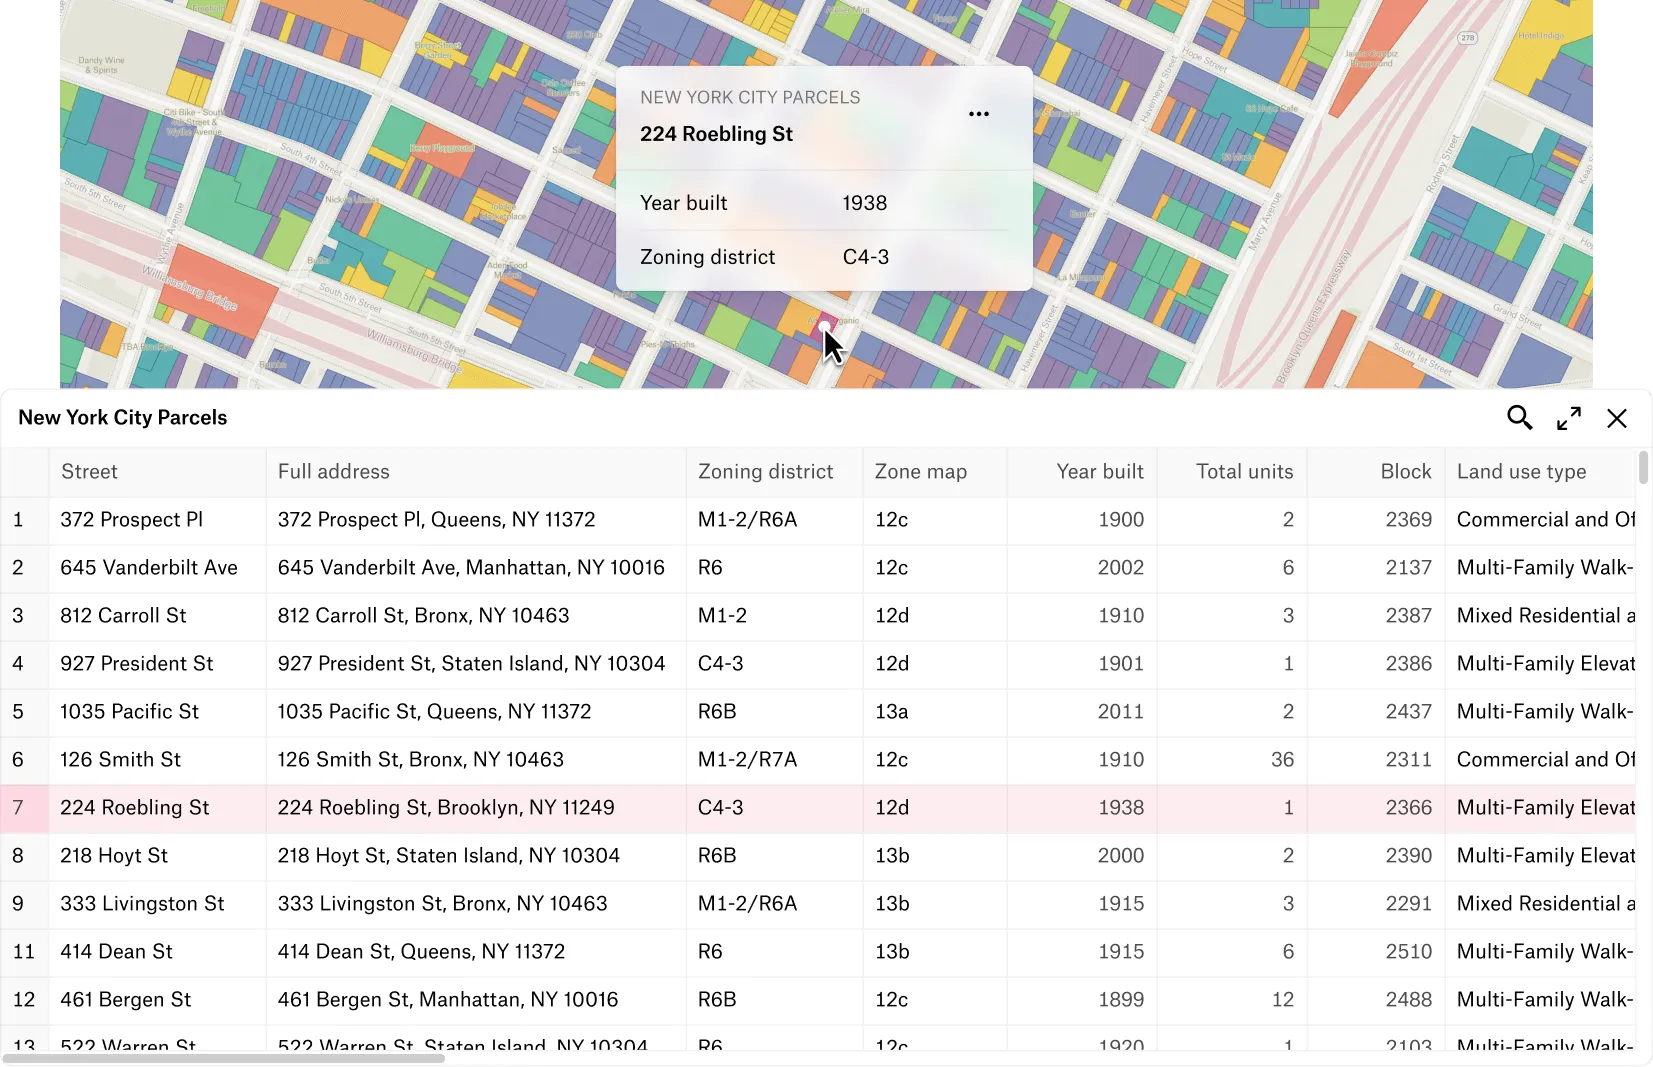
And, since multiple hypotheses need to be explored at any given moment, quick iteration is a key ingredient to efficient data discovery. Felt’s new table view comes with everything you need to analyze your layers:
- View all your data for even the largest of datasets (up to 5GB!)
- Click on a column name to sort, rename it, or add a filter
- Use the search tool to quickly find a feature, then…
- Double-click on a row to zoom to it.
Explore your data using filters
Whether you're a business analyzing customer demographics, an urban planner assessing infrastructure needs, or a researcher studying geographical phenomena, the power to selectively manipulate and display data on maps is indispensable.
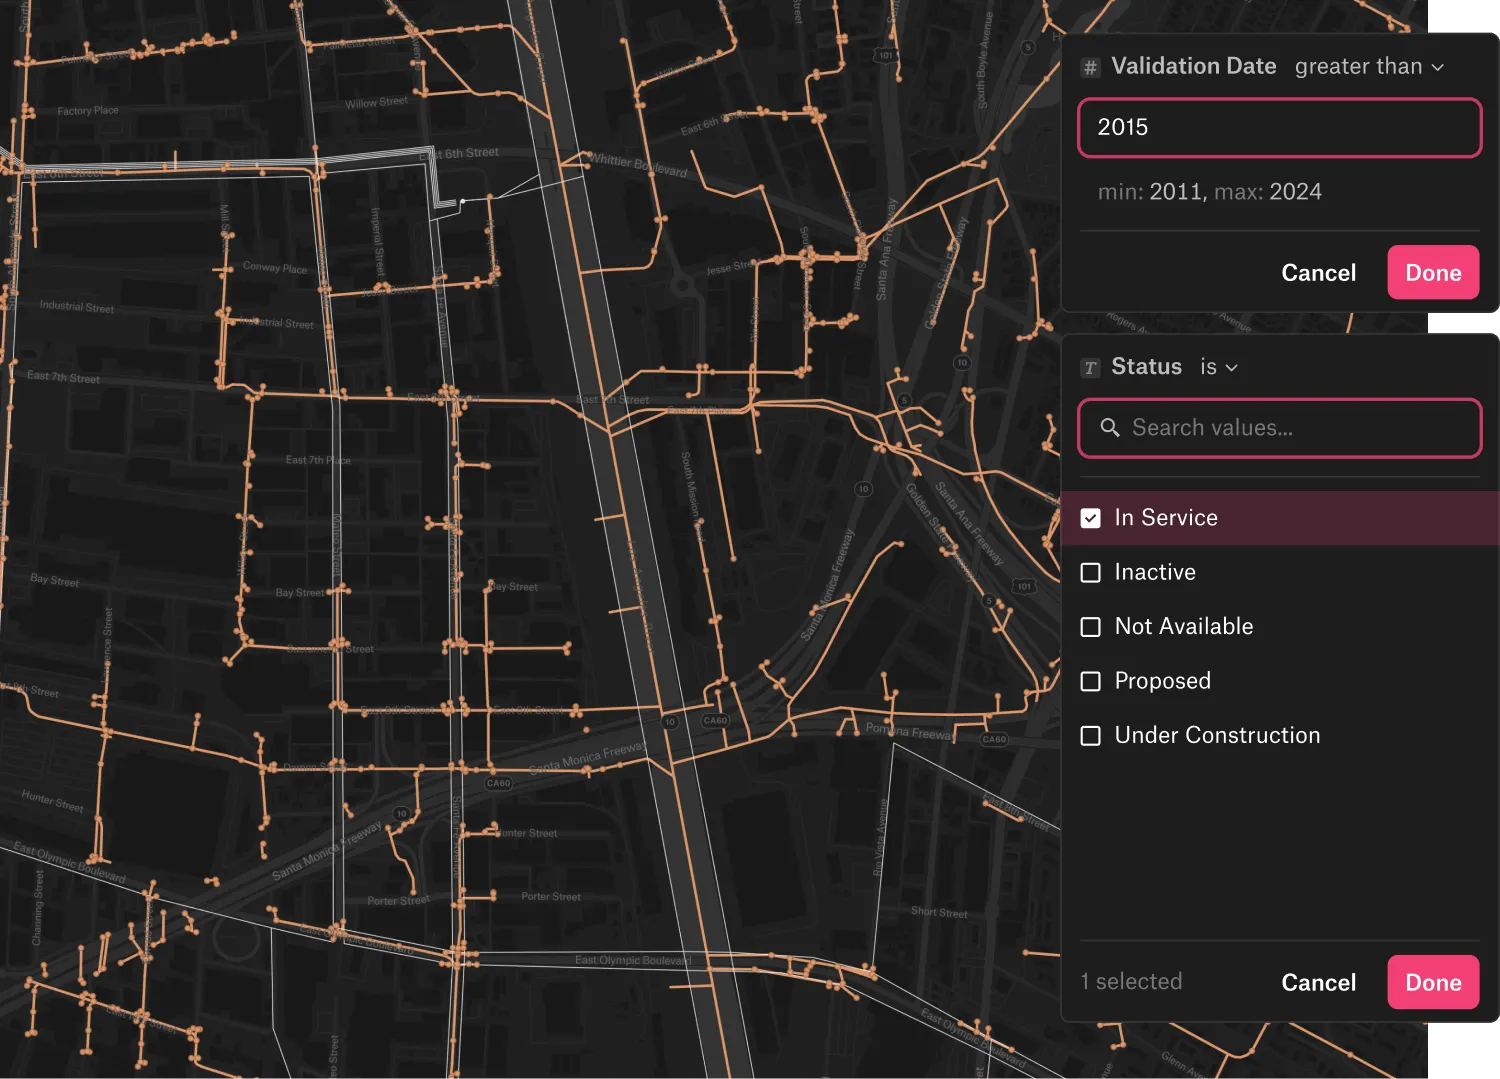
Filters allow map editors to focus on specific attributes or criteria, unravelling hidden patterns and trends within spatial data. They apply to both the table and the map, allowing you to interactively explore your data or hone in on the features that you’re really interested in.
Filters can be applied to any data type: numbers, text, booleans, and even dates. Filtered layers may use transformations and they can also be updated into new layers with only the subset of data you want, which is great for exporting as a GeoPackage.
Better search, for viewers and editors
What good is a map if you can’t find your hometown? When conducting spatial analysis, users often need to focus on specific areas or features — this is especially true for reference maps where most viewers only want to look at a subset of data, often near themselves.
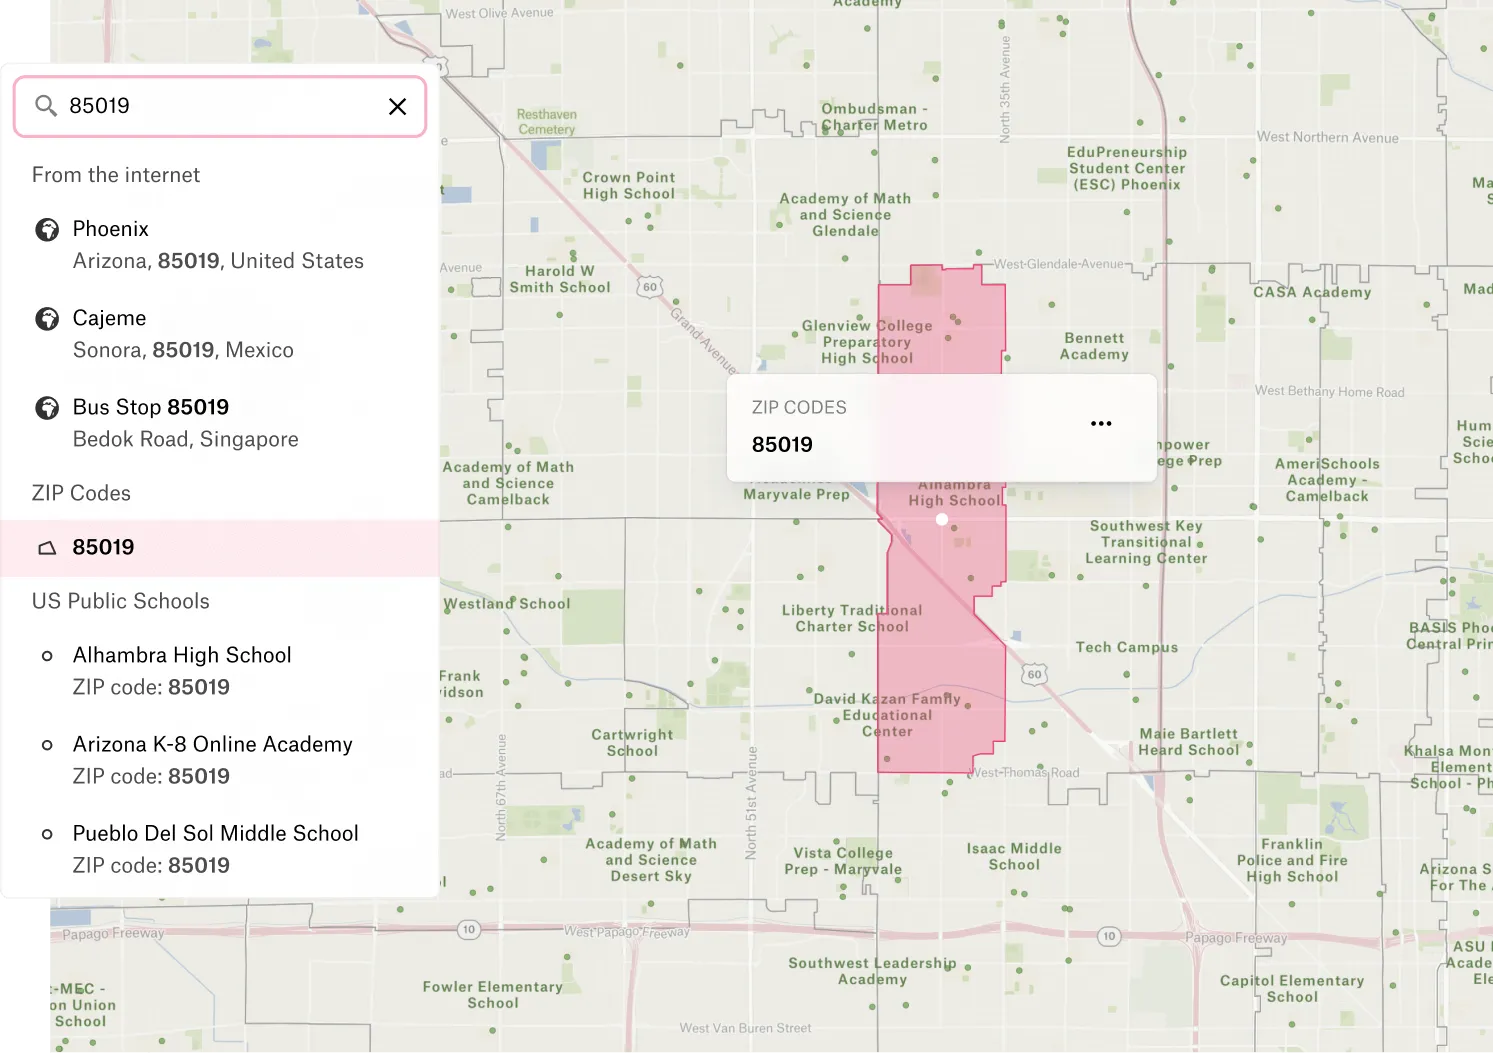
Felt’s new search tool addresses the top two requests we’ve been hearing from our users:
- Make search available for everyone, including logged-in and anonymous viewers.
- The ability to search through data layers as well as places on the map.
All your categories, visualized
To top it all off, we’ve added a handful of ways to visually understand your data even better:
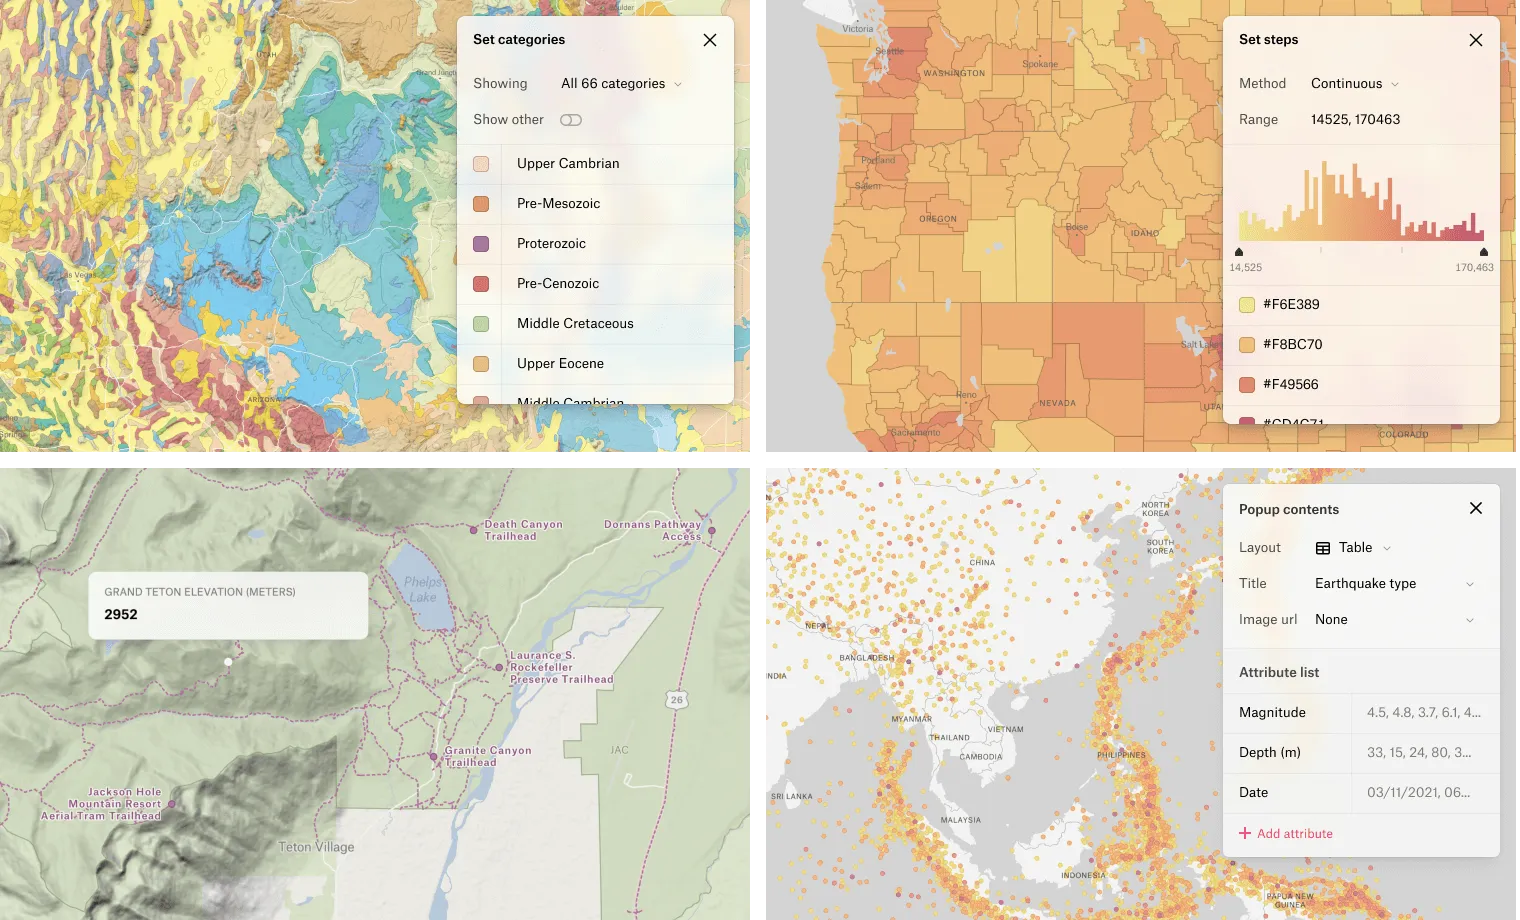
- Categorical visualizations can now show all categories, not just the top 10.
- Numeric visualizations show a histogram of the data distribution to help you pick the best classification breaks.
- Popups keep on improving: not only can you now add images and paginate through several features but they are also available for raster layers — both on mouse hover and click.
Ready to dive in?
Felt just got more powerful than ever. The new table, filtering and search tools allow users to explore their data in a myriad of ways, regardless of size. And, coupled with our latest cartographic capabilities, data discovery is available for viewers too, not just editors.
Compare Felt using AI


.jpg)


.webp)
