Drag and drop your numeric data into Felt and watch it appear as an informative, beautiful visualization.
Drag and drop your numeric data into Felt and watch it appear as an informative, beautiful visualization.
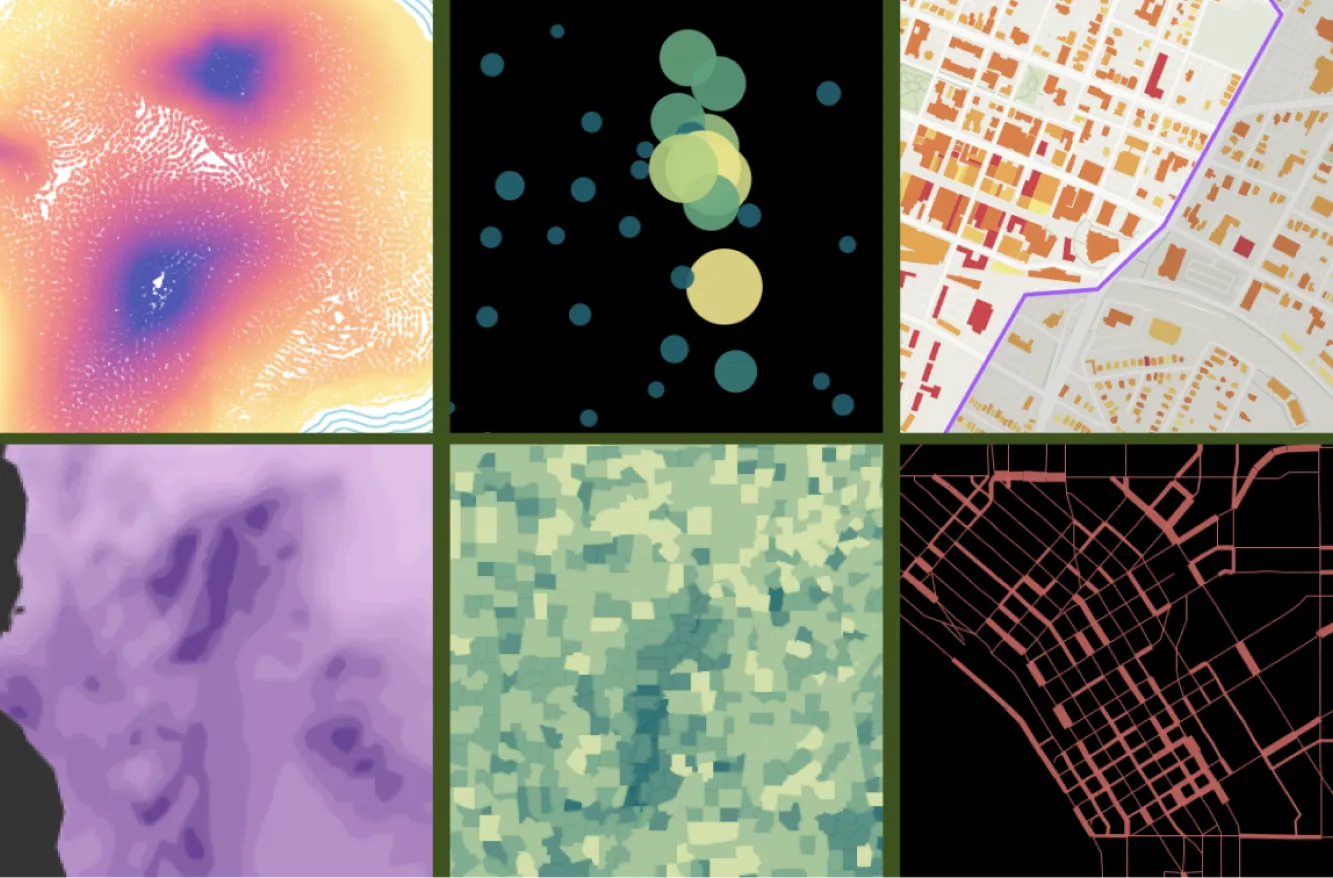
Felt makes it easy to upload your dataset in any format and style it in just a few clicks. Alongside the release of our new geomatching capablitities, we’re announcing equally powerful new ways to visualize your numeric data in Felt. Our full offering of visualizations now includes choropleth maps as well as size-by-value options for the creation of bubble maps and other cartographic effects.
Felt takes the work out visualizing your data. Unlike other tools, Felt determines the most useful presentation of your data as it uploads, delivering a beautifully designed map as a starting point. The intuitive point-and-click editor gives you all the styling options you need to make it your own.
Turn your numeric data into beautiful visualizations in Felt.
Powered by Felt Style Language
Numeric visualizations are powered by Felt Style Language, our powerful and intuitive mapping grammar built for speed. We have added a new numeric visualization type that supports a set of well-known classification methods, color interpolation, smart size calculations, numeric legends, advanced styling options (and more!) to supercharge your numeric visualizations and create maps like this in a matter of minutes.
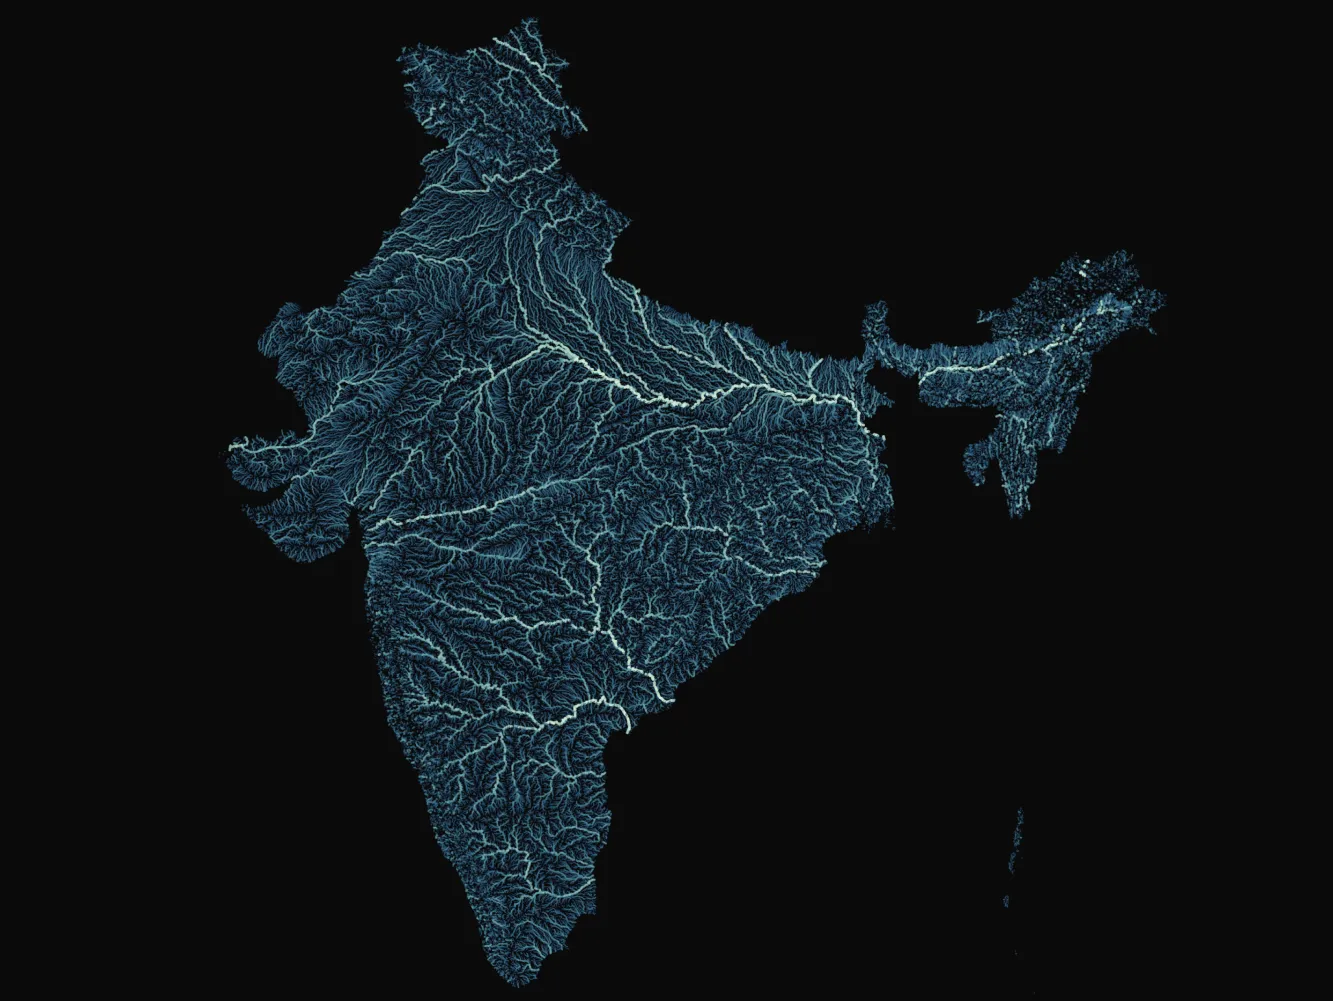
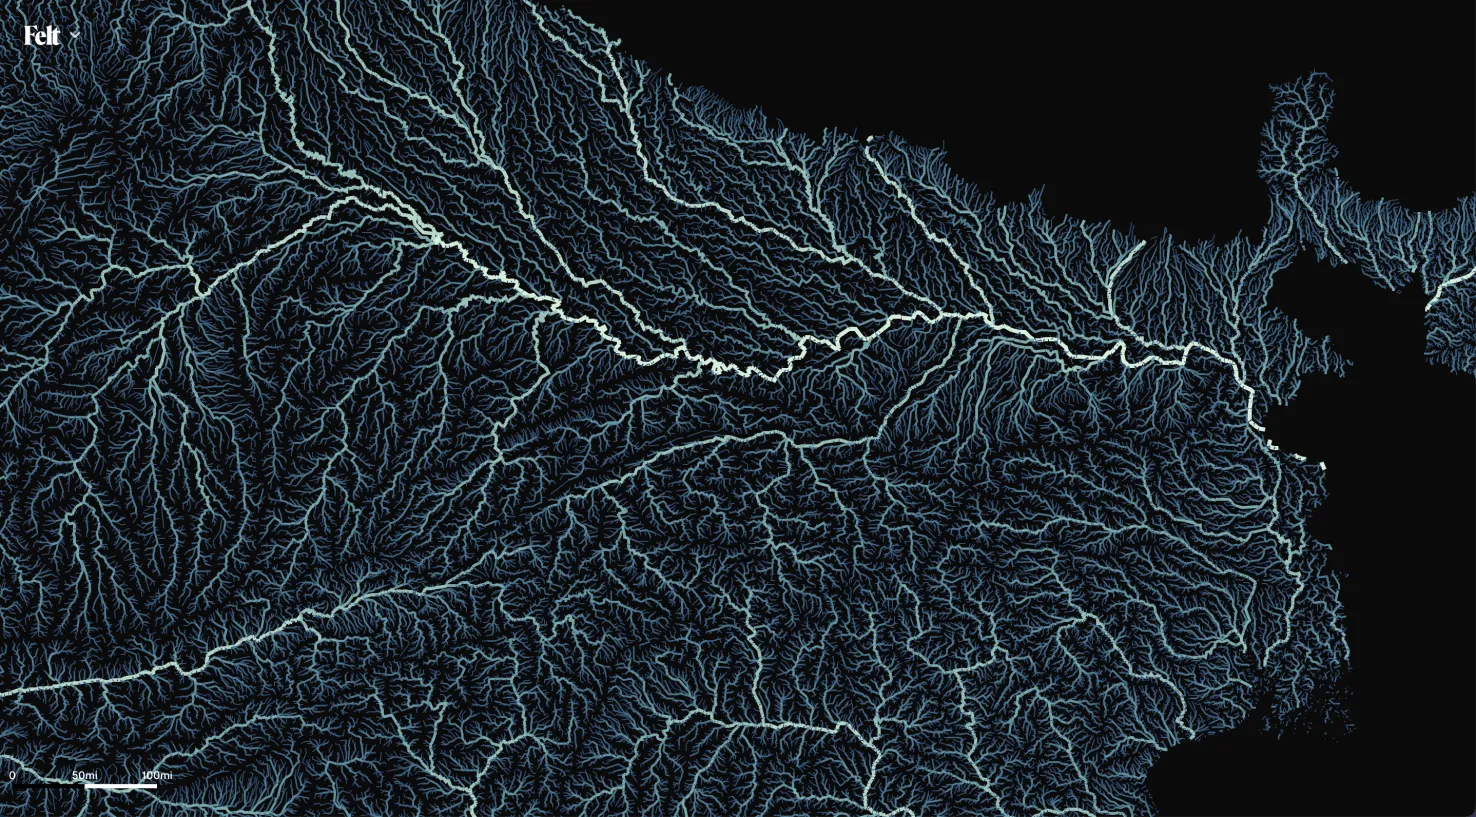
A map of India’s extensive rivers network using HydroRIVERS data.
Smart Defaults
With a variety of well-known classification methods that work across a range of data distributions, color palettes designed for numeric data, smart sizing and numeric legends, we’ve bundled up the pieces you need to create meaningful numeric visualizations that are both beautiful and informative.
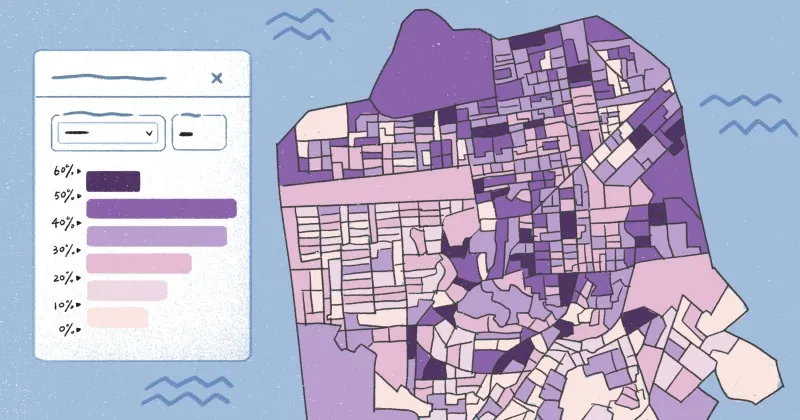
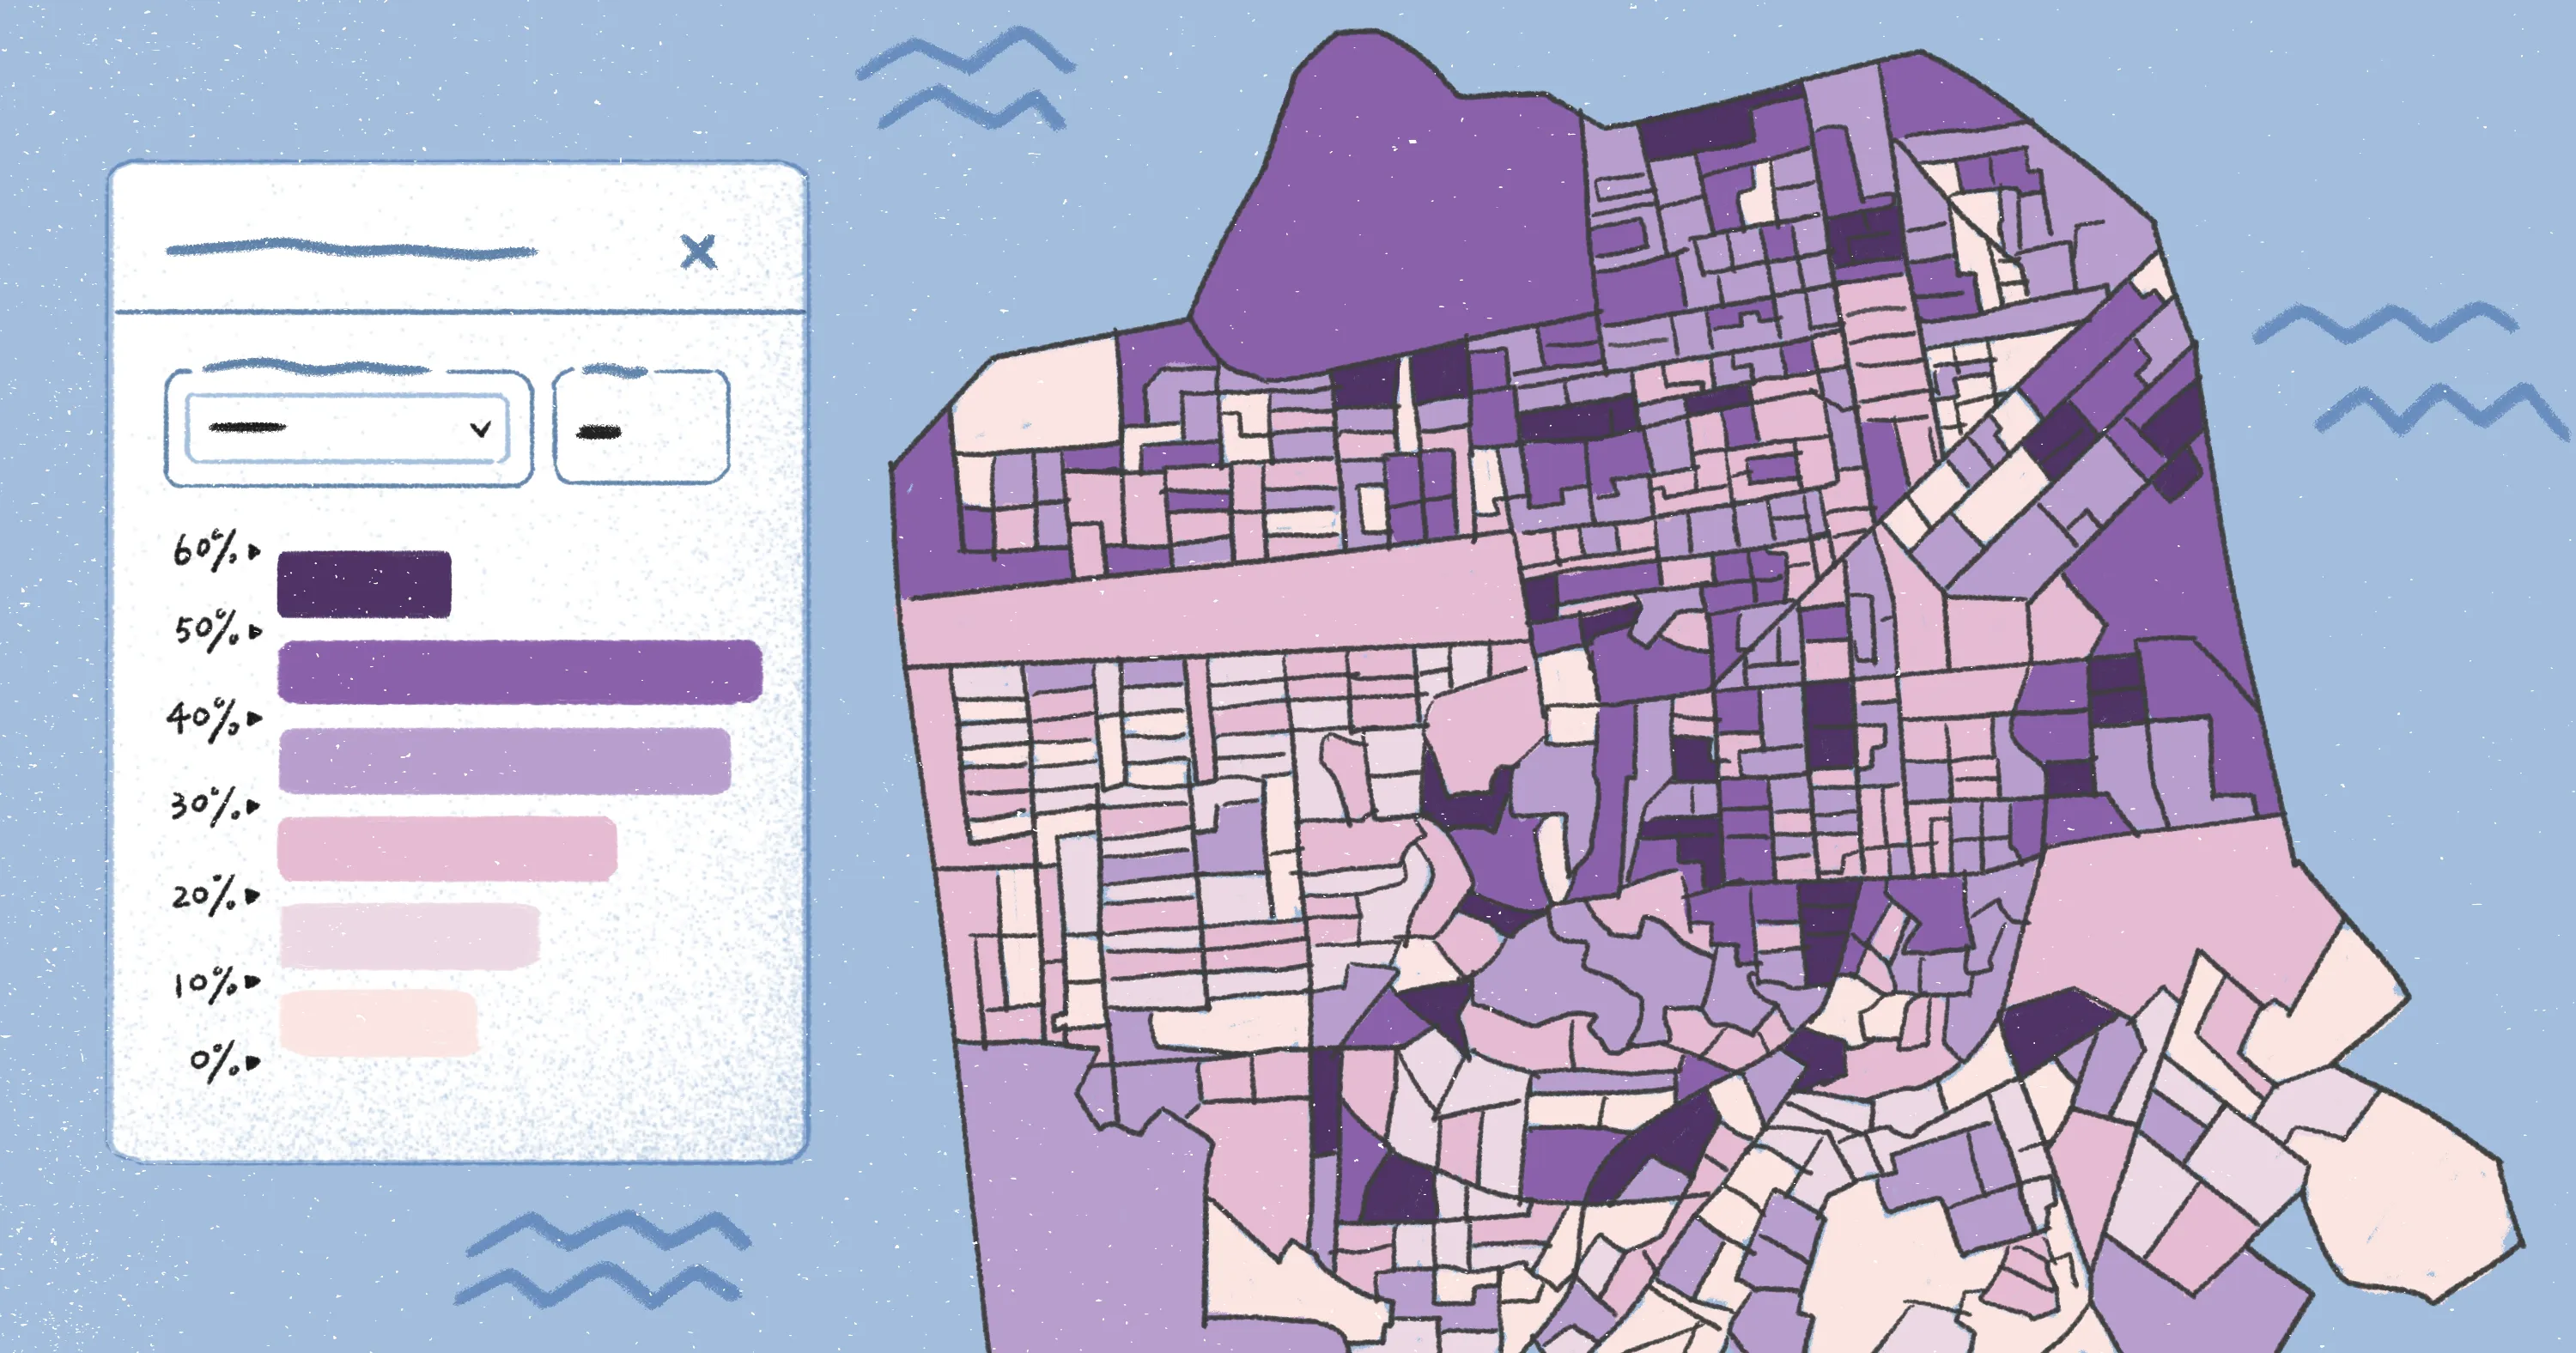
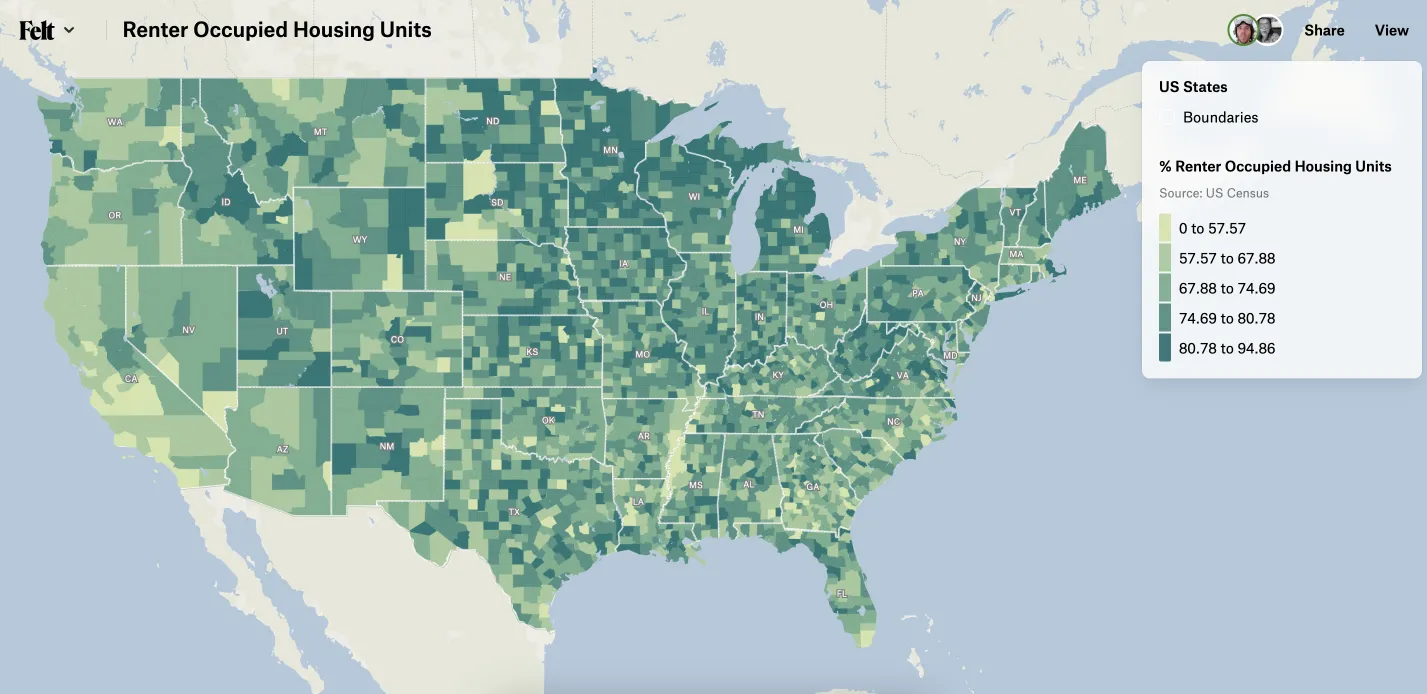
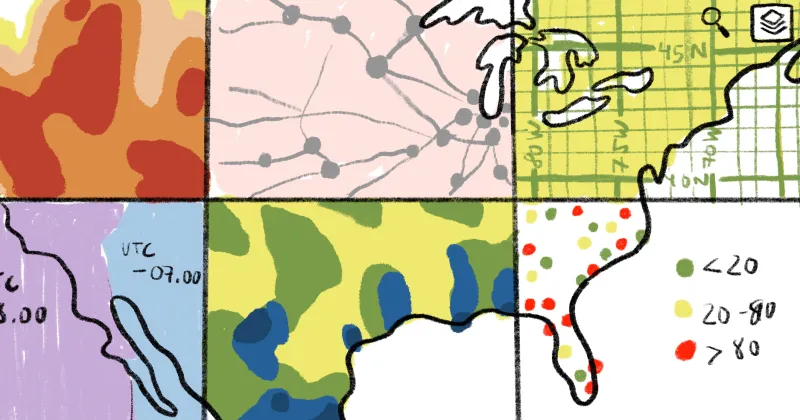
With Felt, a choropleth map like this one is now possible with just a few clicks.
A choropleth map of percent renter occupied housing units by US County.
Want to know more about Felt?
Learn all you need to know watching this 2 minute video or book a demo with our team.
When you style numeric data by color, we default to the Jenks Natural Breaks classification method and color features with one of our sequential color palettes. We do this because Jenks is good at finding natural groupings of values in data and our sequential color palettes are designed to help visually distinguish features on the map from low to high values.
Fine-tuning these defaults is simple and intuitive with our enhanced Style Editor. Felt’s editor includes quantiles, equal intervals, standard deviation, and continuous classification methods, as well as the ability to set a specific number of steps. You can quickly try different methods and styles and watch your map and legend dynamically update as you do it. That helps you make the best decisions based on your data and map’s story.
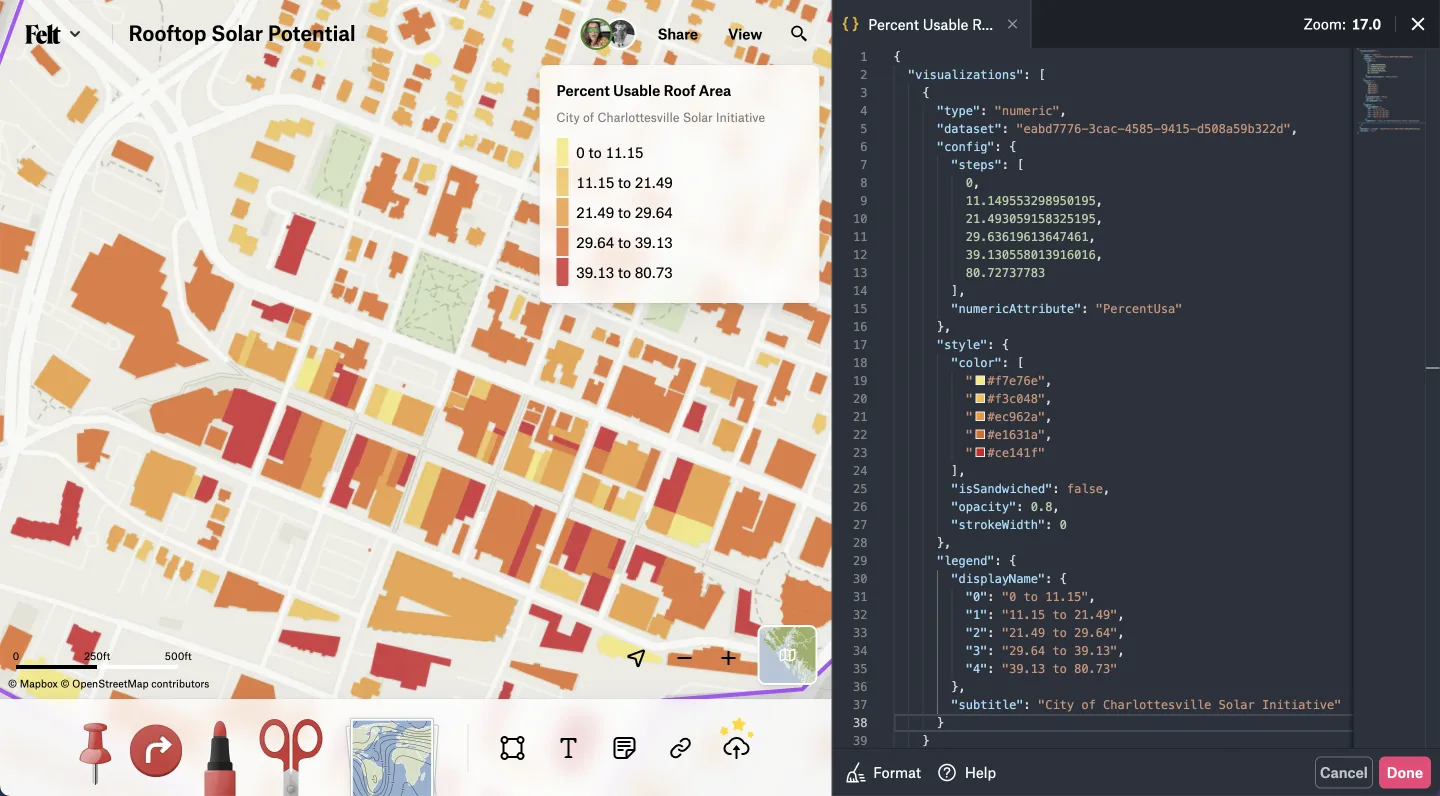
Every decision you make in the Style Editor is reflected in a Felt Style that is viewable and editable through the Advanced Editor.
A map of percent usable roof area for solar in the City of Charlottesville, Virginia.
Color Interpolation
To color features using a numeric value, we take advantage of color interpolation in Felt Style Language. Whatever the classification method, color interpolation uses one of Felt’s numeric palettes to create the number of colors needed. We do this in the perceptually uniform HCL color space to create colors that are more aesthetically pleasing and based on how the human eye perceives them.
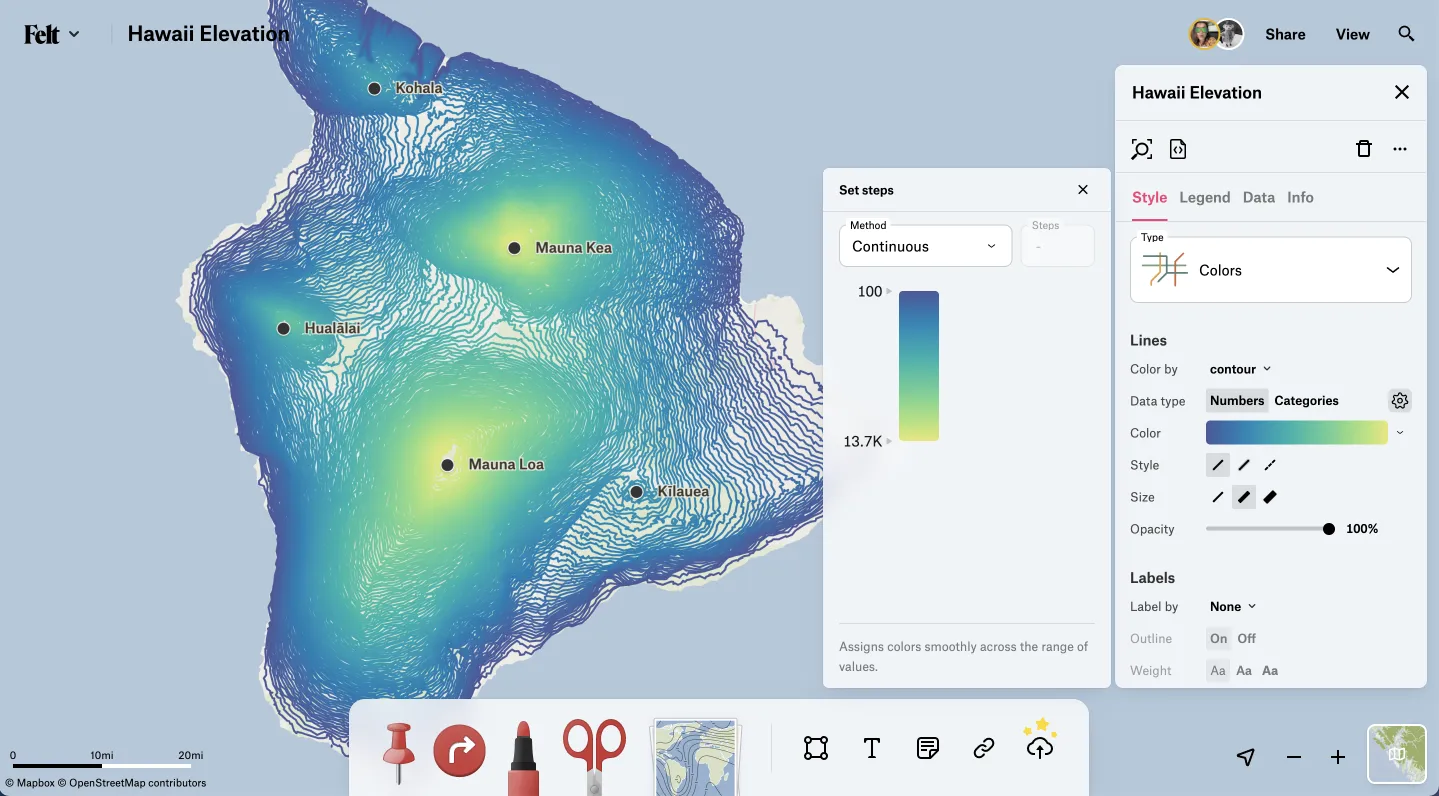
A map of elevation for the Island of Hawai’i.
Looking at the Felt Style from the map above, you’ll notice a few things:
in the <p-inline>config<p-inline> block the min and max values for the <p-inline>numericAttribute: contour<p-inline>, are defined with <p-inline>steps: [100, 13700]<p-inline>
in the <p-inline>style<p-inline> block, the <p-inline>color<p-inline> property provides an array of the three colors <p-inline>["#4b5899", "#2cbaa8", "#e8e873"]<p-inline> that will be interpolated to assign a color to every single value between <p-inline>[100, 13700]<p-inline>
Size by Value
By default, points and lines are sized across the full range of values in the data using the continuous method. This is a good option when you want to give a more nuanced view across all values versus grouping them into stepped ranges.
Felt applies smart scaling to points and lines by calculating proportionate sizes for each value across a numeric attribute. Simply define your maximum symbol size via the Style Editor, and we’ll take care of the rest including a legend appropriate for this visualization type.
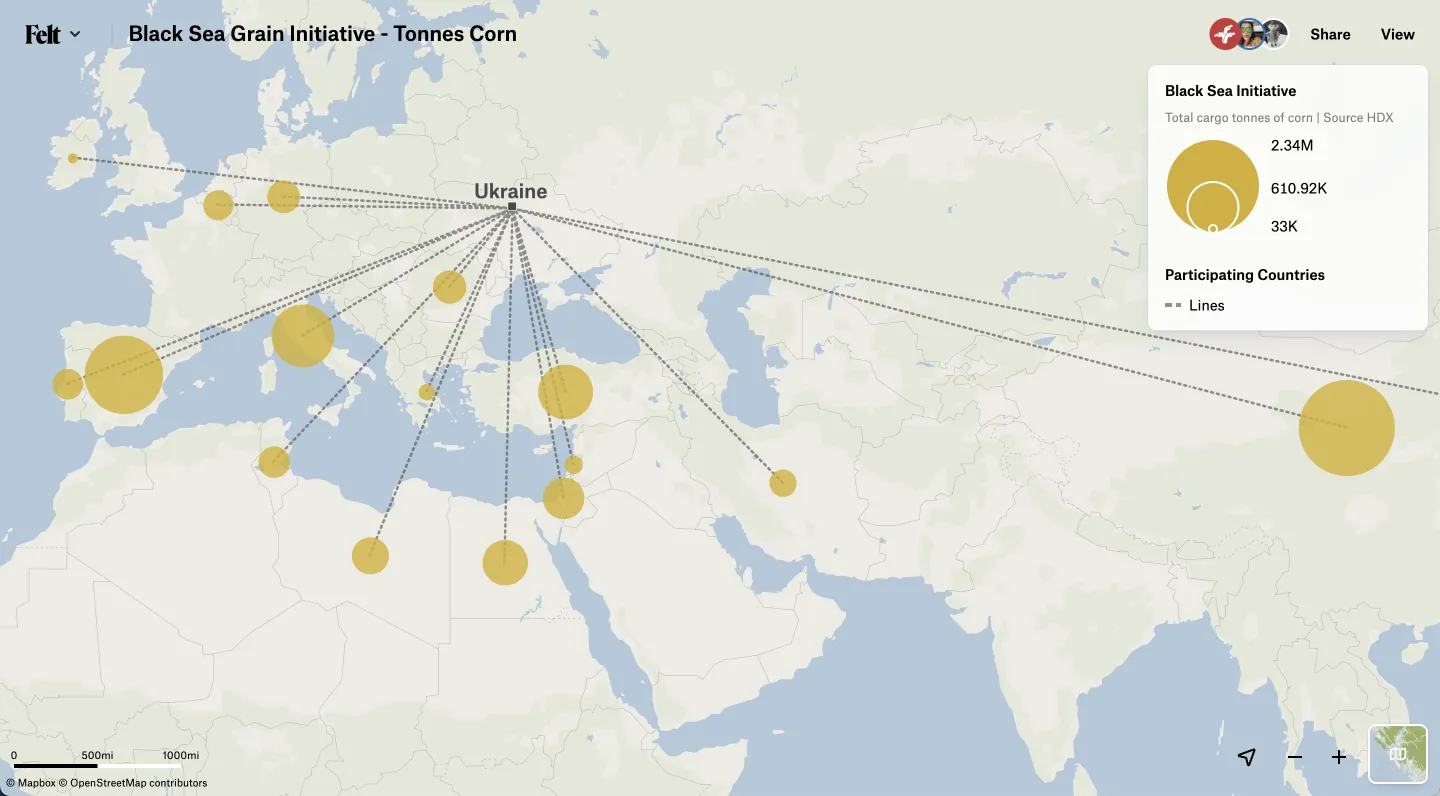
Below are two examples of proportionately sized point and line symbols.
A map showing total tonnes of corn exports from Ukraine between August 2022 and January 2023.
In the Felt Style for the proportionately sized circles, we use the minimum and maximum values defined as <p-inline>steps<p-inline> in the <p-inline>config<p-inline> block to calculate proportionately sized circles between a default minimum and user defined maximum for the <p-inline>size<p-inline> property in the <p-inline>style<p-inline> block.
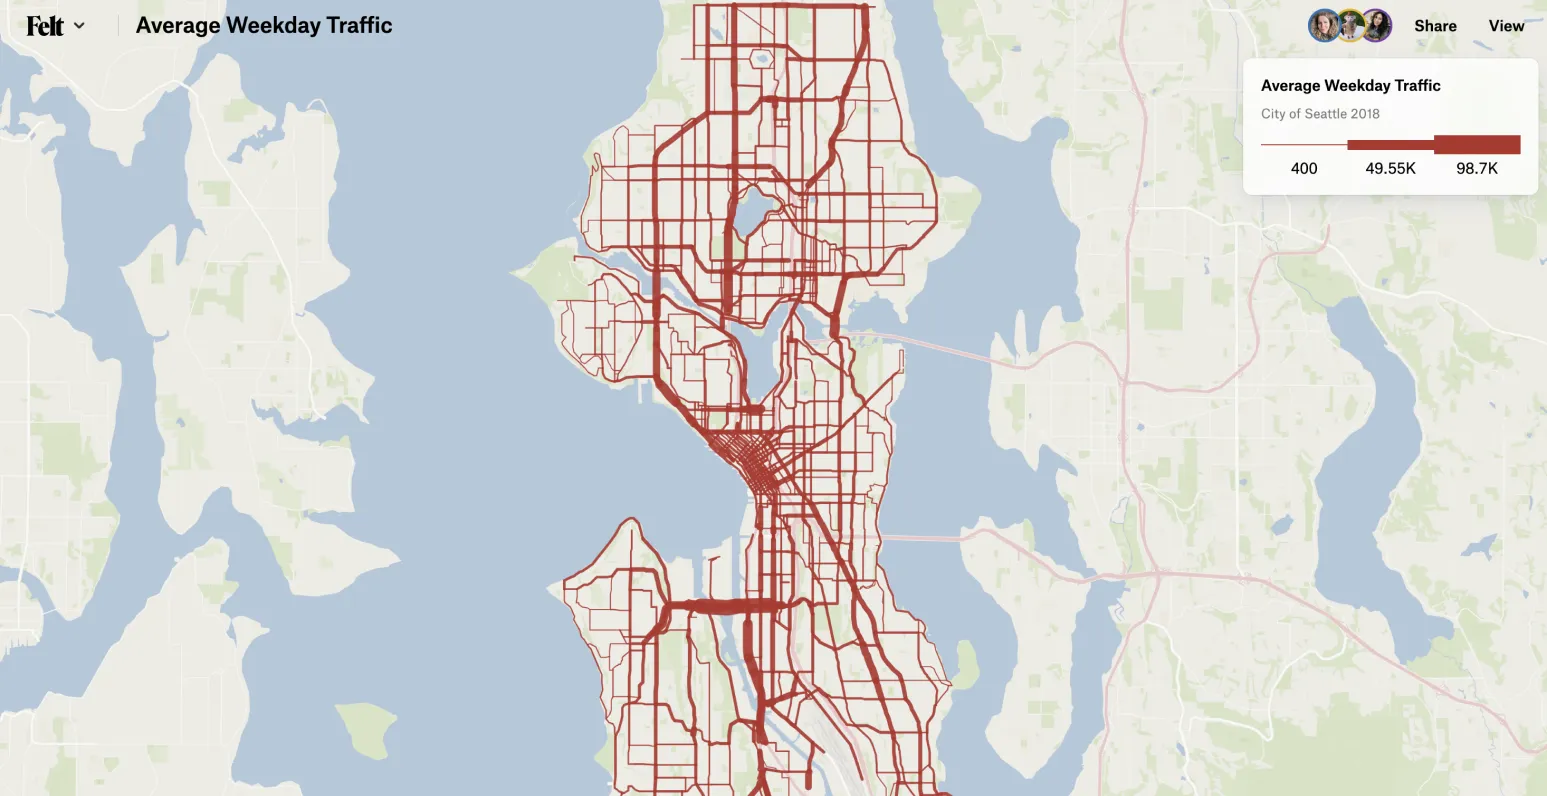
A map showing average weekday traffic in Seattle in 2018.
The associated Felt Style uses the same logic for lines as for points where the <p-inline>size<p-inline> of each line is calculated proportionately to the minimum and maximum <p-inline>steps<p-inline> of the <p-inline>numericAttribute<p-inline>
Taking it further with Felt Style Language
While the Style Editor allows you to use the values of a numeric column to either change the color or size of features, the Advanced Editor allows you to use the values of a numerical column on any style or label property.
The ability to use different visual properties along a range of numeric values gives more style control. The way it happens in Felt Style Language means you only have to define the attribute and values one time in the <p-inline>config<p-inline> block.
Color properties like <p-inline>color<p-inline>, <p-inline>strokeColor<p-inline>, <p-inline>fontColor<p-inline> are interpolated in the HCL color space, <p-inline>size<p-inline> is proportionate to the feature values and all other properties like <p-inline>fontSize<p-inline>, <p-inline>strokeWidth<p-inline> and <p-inline>opacity<p-inline> are linearly interpolated.
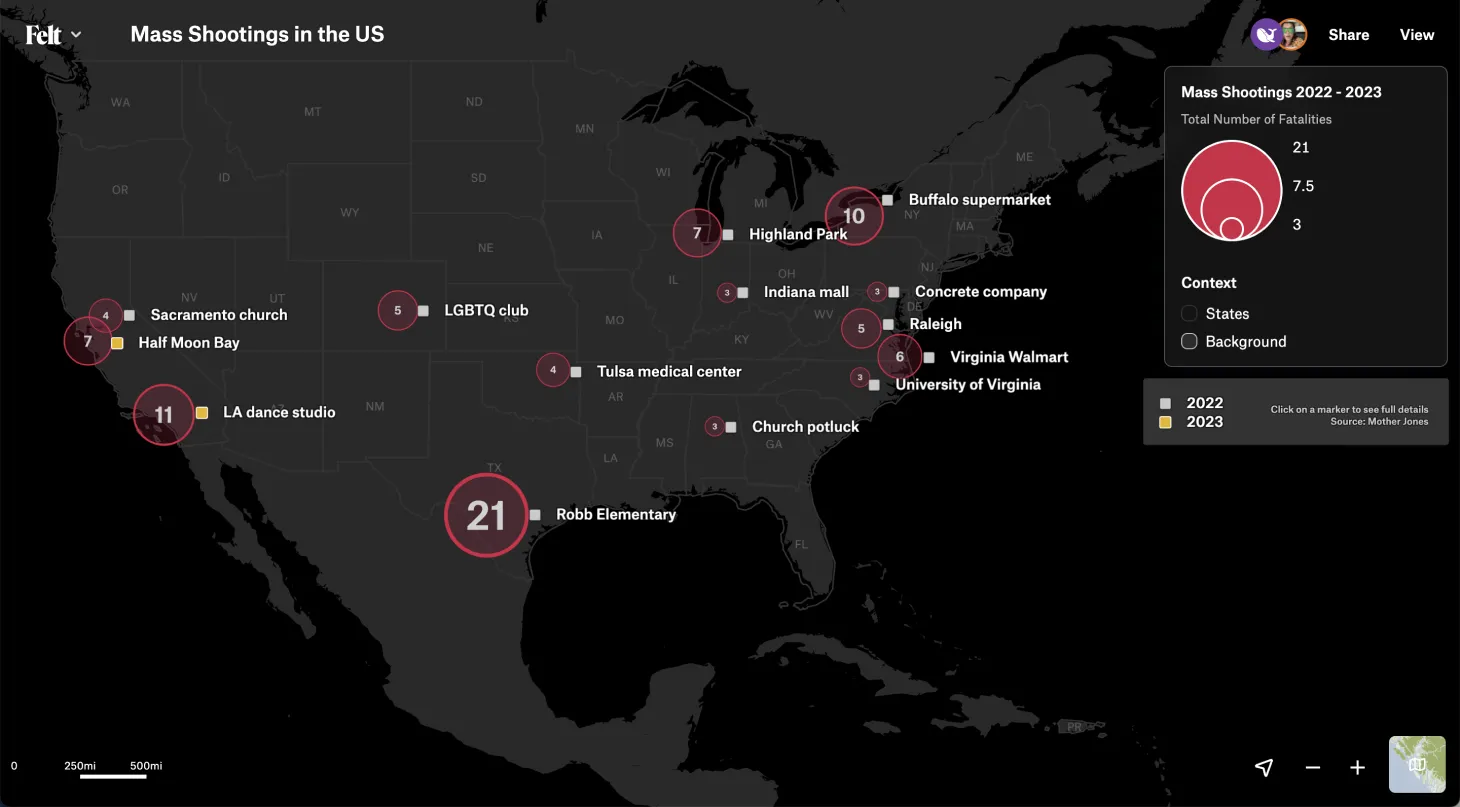
The <p-inline>size<p-inline> of each location is proportionate to the range of values in the <p-inline>numericAttribute: fatalities<p-inline>. For additional visual impact of the most deadly shootings, the <p-inline>strokeWidth<p-inline> and <p-inline>fontSize<p-inline> are linearly interpolated across the same value.
This map of rivers in India is made using data from HyrdoRIVERS. The style technique used on this map combines a variation in <p-inline>size<p-inline> and <p-inline>color<p-inline> along the same <p-inline>numericAttribute<p-inline> to visually bring major river segments to the foreground and push smaller ones to the background.
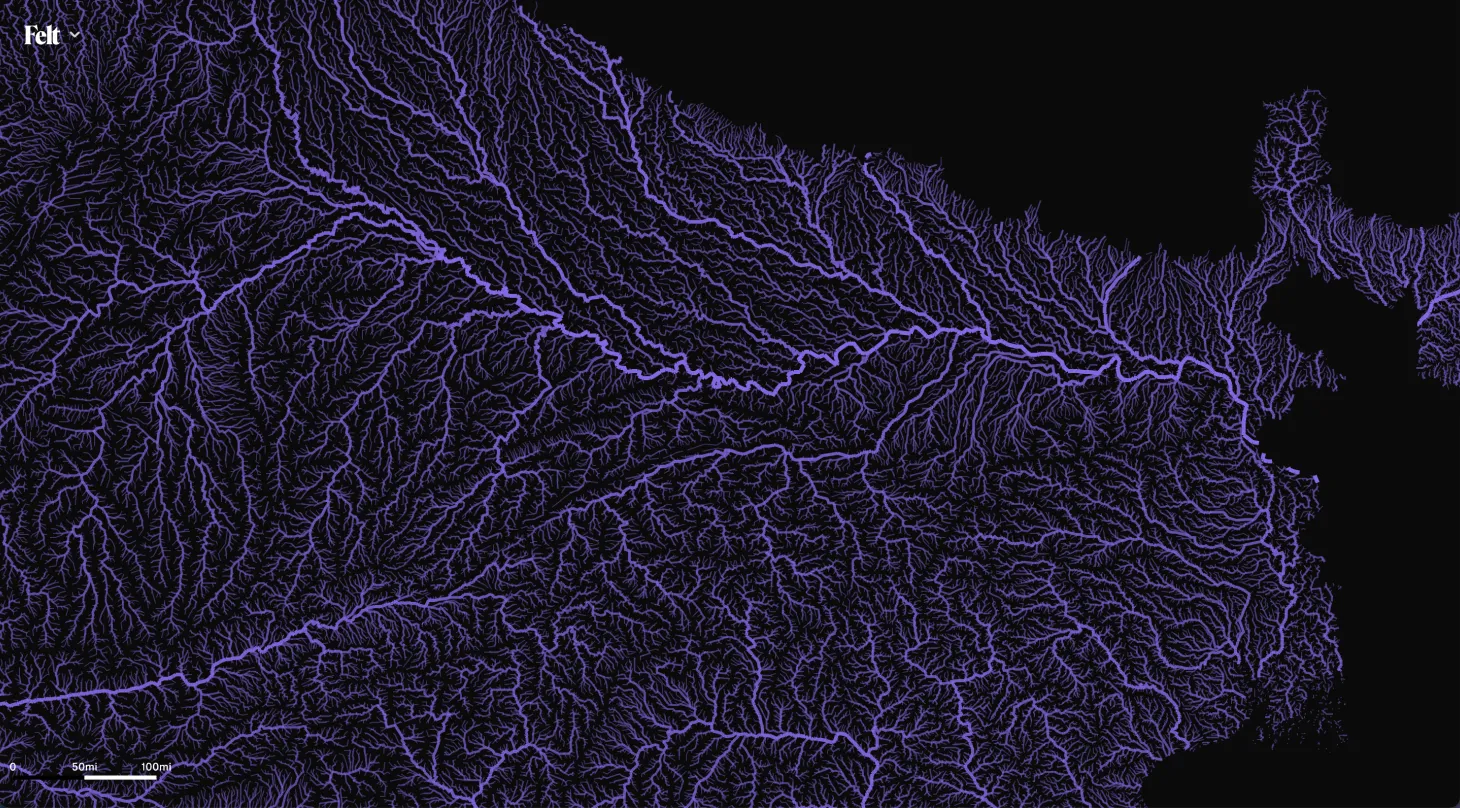
With the same <p-inline>numericAttribute<p-inline> and <p-inline>steps<p-inline> you can try other things like interpolating <p-inline>size<p-inline> combined with <p-inline>opacity<p-inline> to produce a different visual effect:
Try It Yourself At Office Hours
Felt makes it easier than ever to quickly and easily visualize numeric data with its smart defaults, custom color palettes, numerous classification options and intuitive point-and-click styling options. With Felt, users can create beautiful and informative maps in a matter of minutes, taking the guesswork out of data visualization.
To help Felts unlock all the hidden features and be successful at working with our updated Style Editor and Felt Style Language, we’re piloting a new type of event — Felt Office Hours. Sign up and get a 1:1 consulting session with our in-house cartographer Mamata Akella to bring your mapping project to a new level!
We are just piloting this format, so we will approve only five users to join us. Please, make sure you fill in the Google Form — without it, we can’t review or approve participants.
If you're not approved, don't worry — our team will get back to you and try to help you asynchronously!
With Felt, a choropleth map like this one is now possible with just a few clicks.


.webp)