


The spatial infrastructure your business runs on
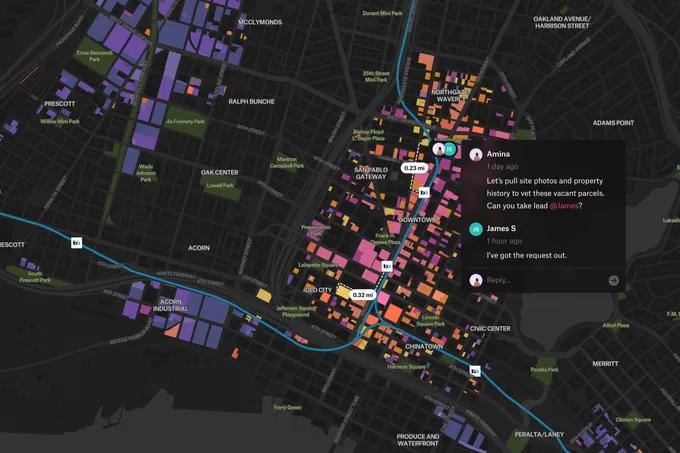
From the field to the office, your team communicates on the same map in real time.Ask Felt AI a question in plain language and get the answer as a map.Every asset your crews touch, logged on the map with the photos to prove it.Layer and analyze data to find the best location for your project.The full picture of any site, from aerial imagery to live readings, wherever you’re standing.Every pipe, pole and parcel your operation runs on, on one live map.Rank every candidate site by who’s within a five-minute drive.










See your whole operation on one map
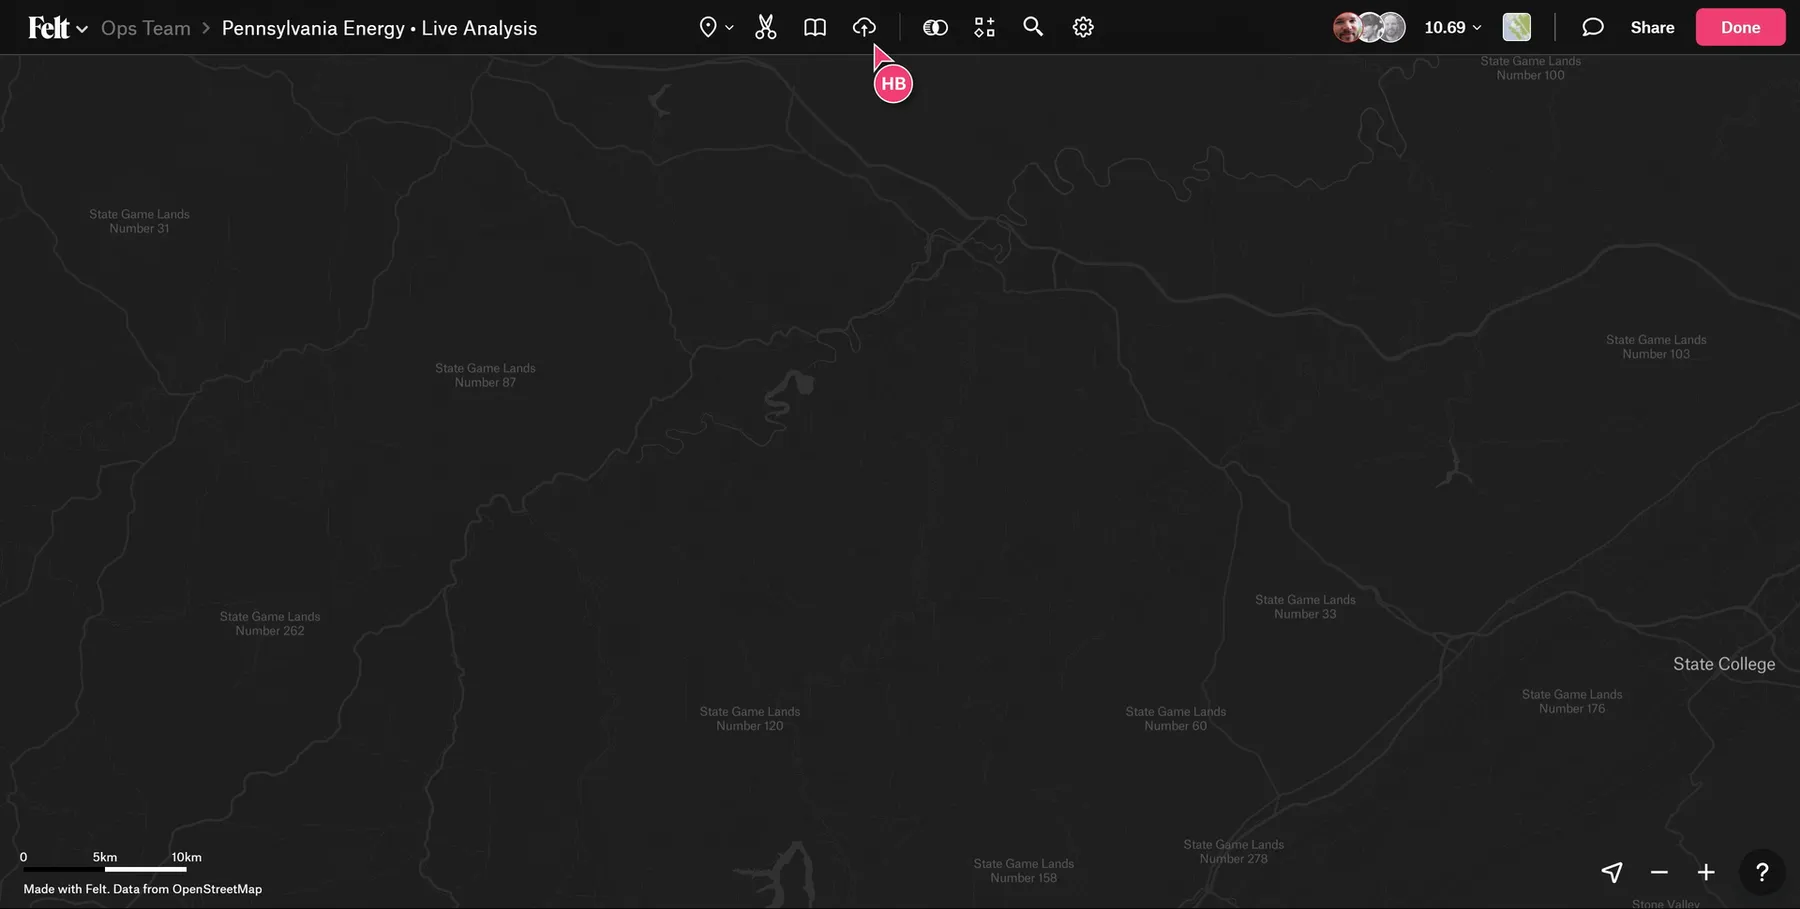
Your asset records are in one system, your GIS data in another, and field reports in a third. Felt puts them on one map, so you can see what’s happening without switching between tools.
Live data, from wherever it lives
Connect a database once and every map built on it stays current. Don’t run one? A Felt Server stores your raster and vector data for you, with permissions and live editing built in.
 Amazon S3
 BigQuery
 Databricks
 ESRI
ESRI Google Cloud
 Microsoft Azure
 MS SQL
 Postgres
 Snowflake
 STAC
STAC WFS
WFS WMTS
WMTSGIS expertise, a prompt away.
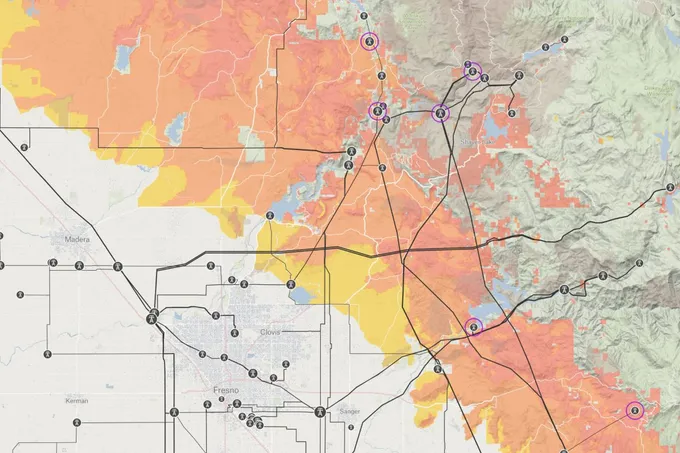
Anyone on your team can ask which lines cross high fire hazard ground. Felt AI finds the hazard data, runs the analysis, and answers on the map, so crews know where to start.Anyone on your team can ask which sites sit in the 100-year floodplain. Felt AI finds FEMA’s flood zones, joins them to your locations, and answers on a map you can act on.Anyone on your team can ask which crew to send. Felt AI finds your crews, routes each one on the roads, and answers on the map. The closest isn’t always the quickest.
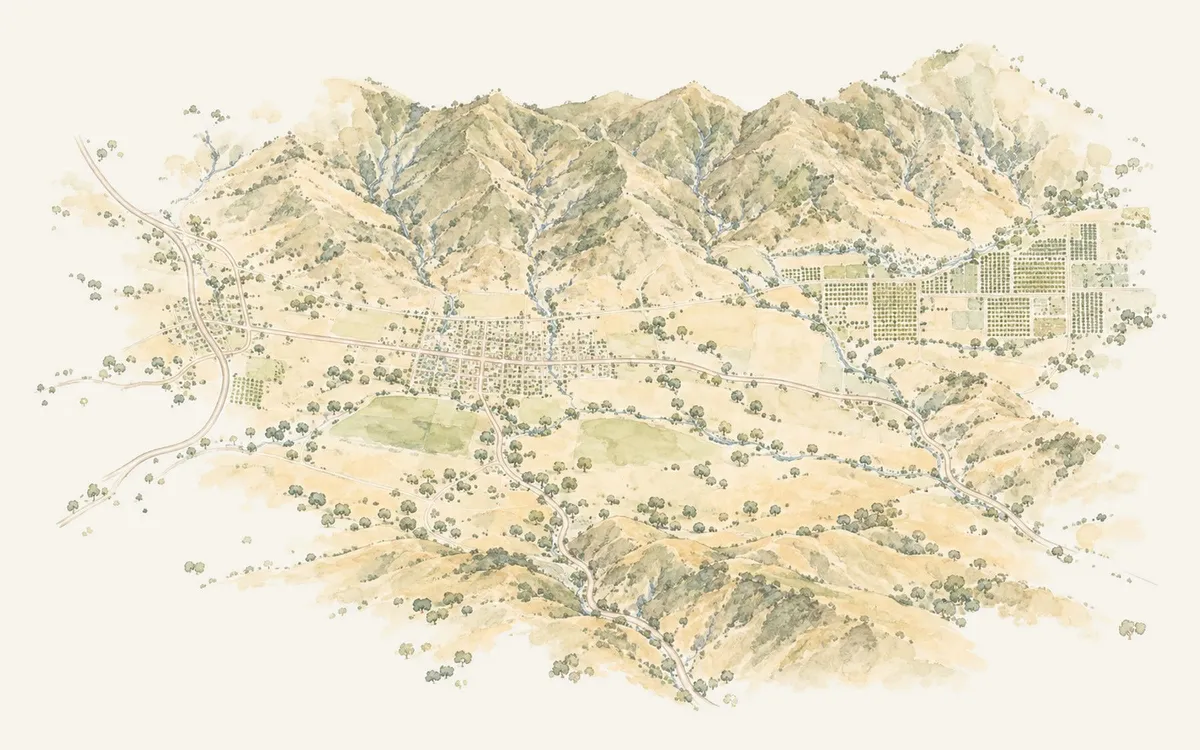
Which of our lines run through very high fire hazard zones?
Found 1 layer · CAL FIRE Fire Hazard Severity Zones ›
Intersected 3 lines, 6.8 mi, with Very High zones ›
Cut 2 stretches in the zone · 18 poles ›
Lines in Very High Zones is live.
Clear the north canyon first. It holds 11 of the 18 poles in Very High zones. In all, 1.7 of your 6.8 miles of line cross them.
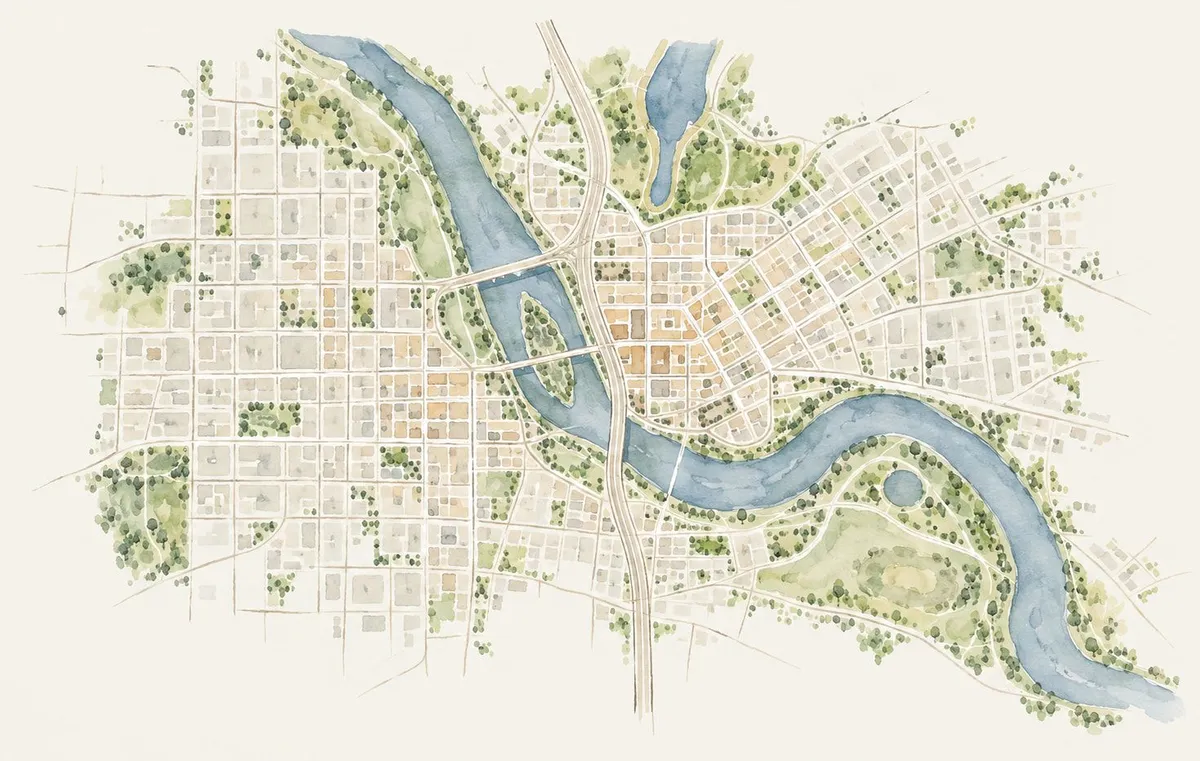
Which of our sites are in the 100-year floodplain?
Found 1 layer · FEMA National Flood Hazard Layer ›
Kept the 1% annual-chance zones · A, AE ›
Joined 13 sites to flood zones ›
Sites in the 100-year floodplain is live.
4 of your 13 sites are in it. All four are in zone AE on the river’s low banks, from Time Check to Czech Village.
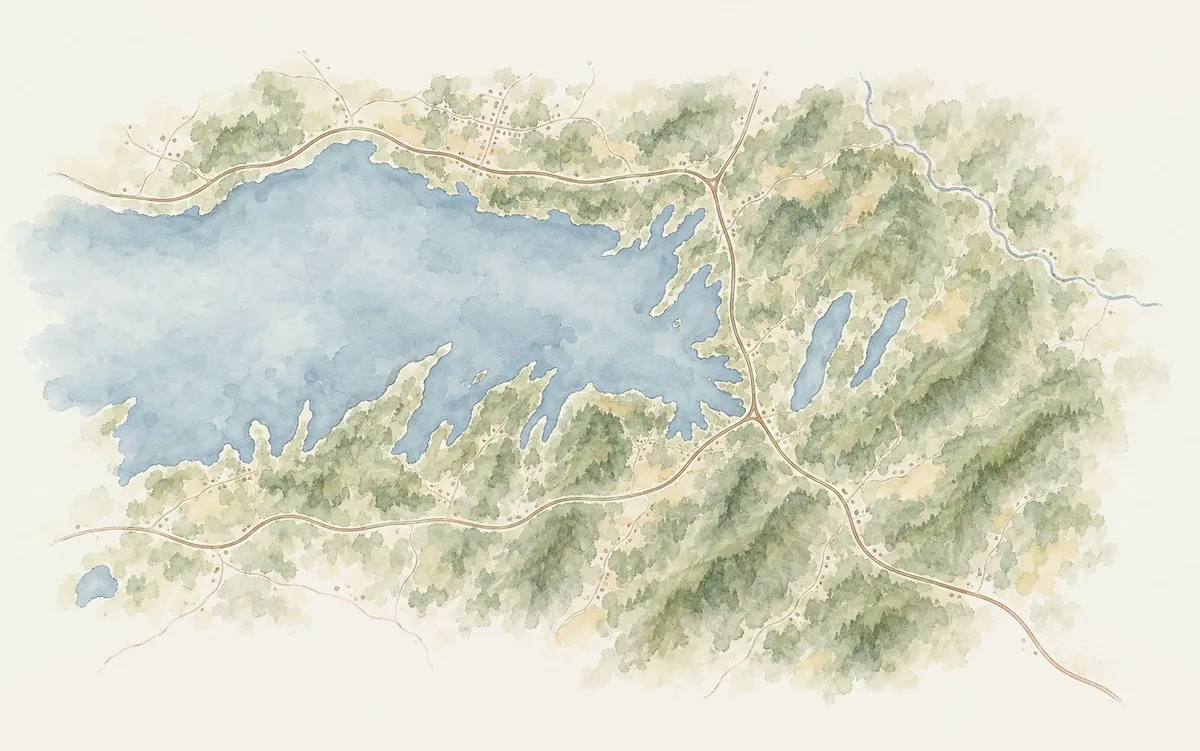
A line’s down on Route 28 by the reservoir. Who should we send?
Added crew locations · 4 points ›
Routed 4 crews on OpenStreetMap roads ›
Ranked 4 crews by drive time ›
Fastest crew route is live.
Send Crew 2, 3 minutes out on Route 28. Crew 1 is closer as the crow flies, 2.3 km, but it’s across the reservoir: 9 minutes by road.
Gain GIS superpowers
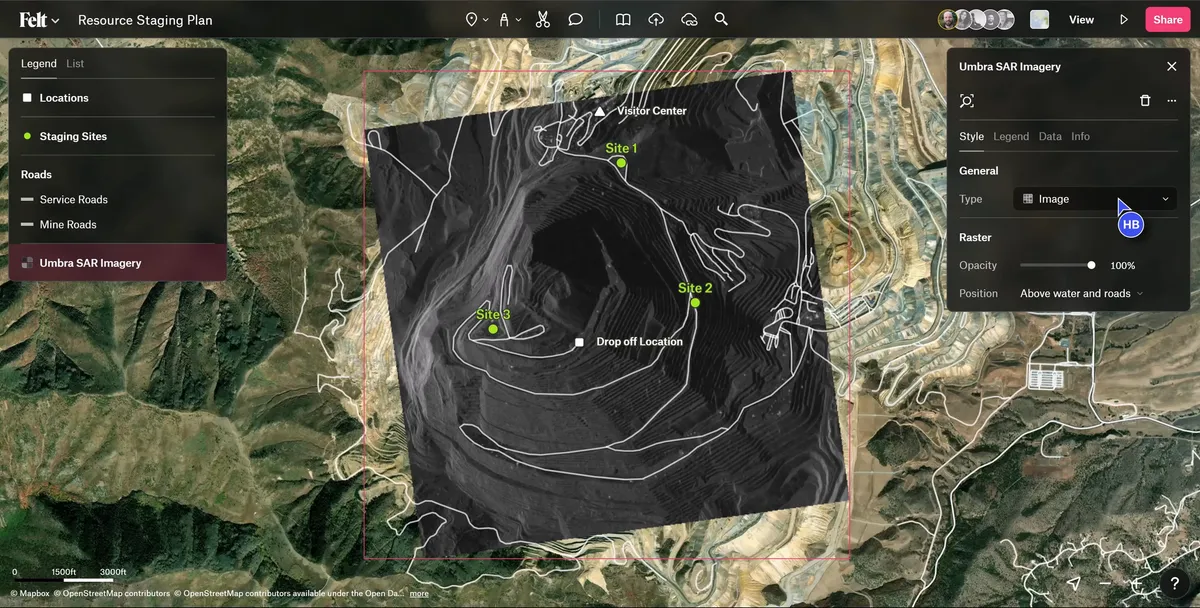
Raster analysis, SQL, and spatial analysis used to take specialized desktop software and an afternoon. With Felt, they take a few clicks or an AI prompt, all in the browser.
- 01
Geocoding
Drop in a spreadsheet of up to 10,000 addresses. Felt puts every one on the map.
- 02
Ready-made data
Census, boundaries, flood risk, and infrastructure layers, ready to add to any map.
- 03
Drive-time areas
Ask Felt AI who lives within a 20-minute drive of any site.
- 04
H3 hexagons
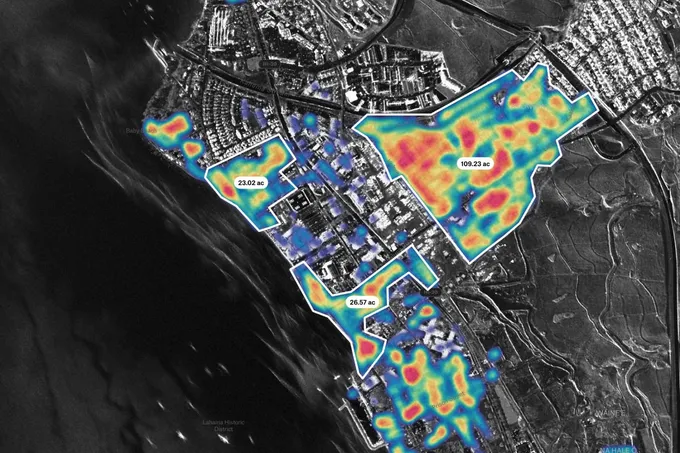
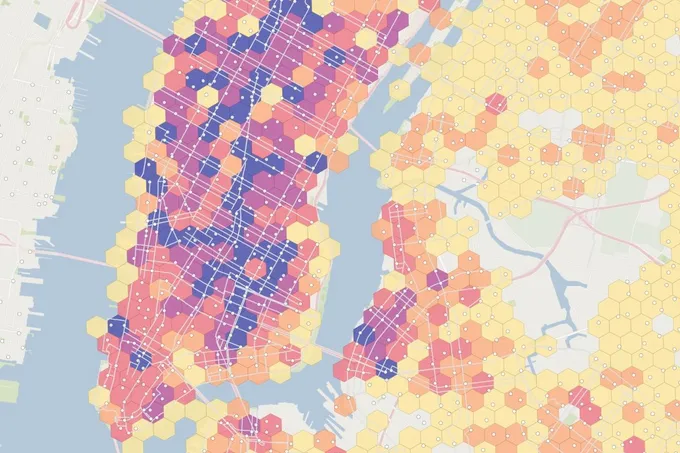
Turn millions of points into clear hotspots of demand, activity, or risk.
- 05
Spatial analysis
Buffer, clip, intersect, and count points in polygons, with no code.
- 06
Print layouts
Client-ready pages with your logo, legend, scale bar, and north arrow.
- 07
GIS exports
Take your data back out as GeoPackage, Shapefile, GeoJSON, or CSV.
- 08
Real-time collaboration
Edit the same map together and see each other’s changes as they happen.
Close the loop between the field and the office
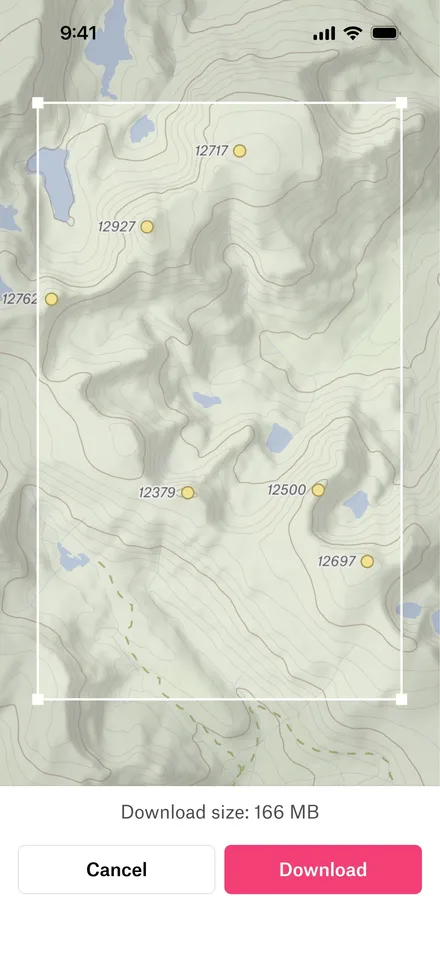
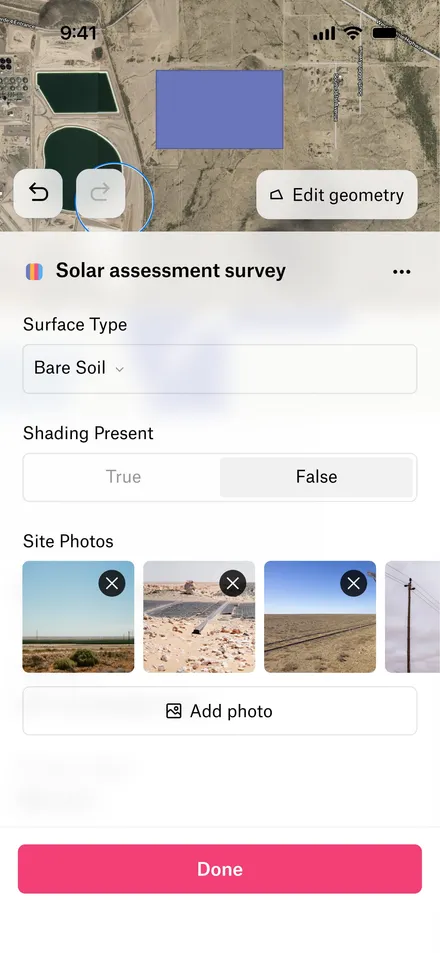
Send crews out with the maps and forms they need, even offline. Felt’s iOS and Android app puts every inspection, photo and note they record back on the shared map, so the office can act on it the same day.
Build your business logic into Felt
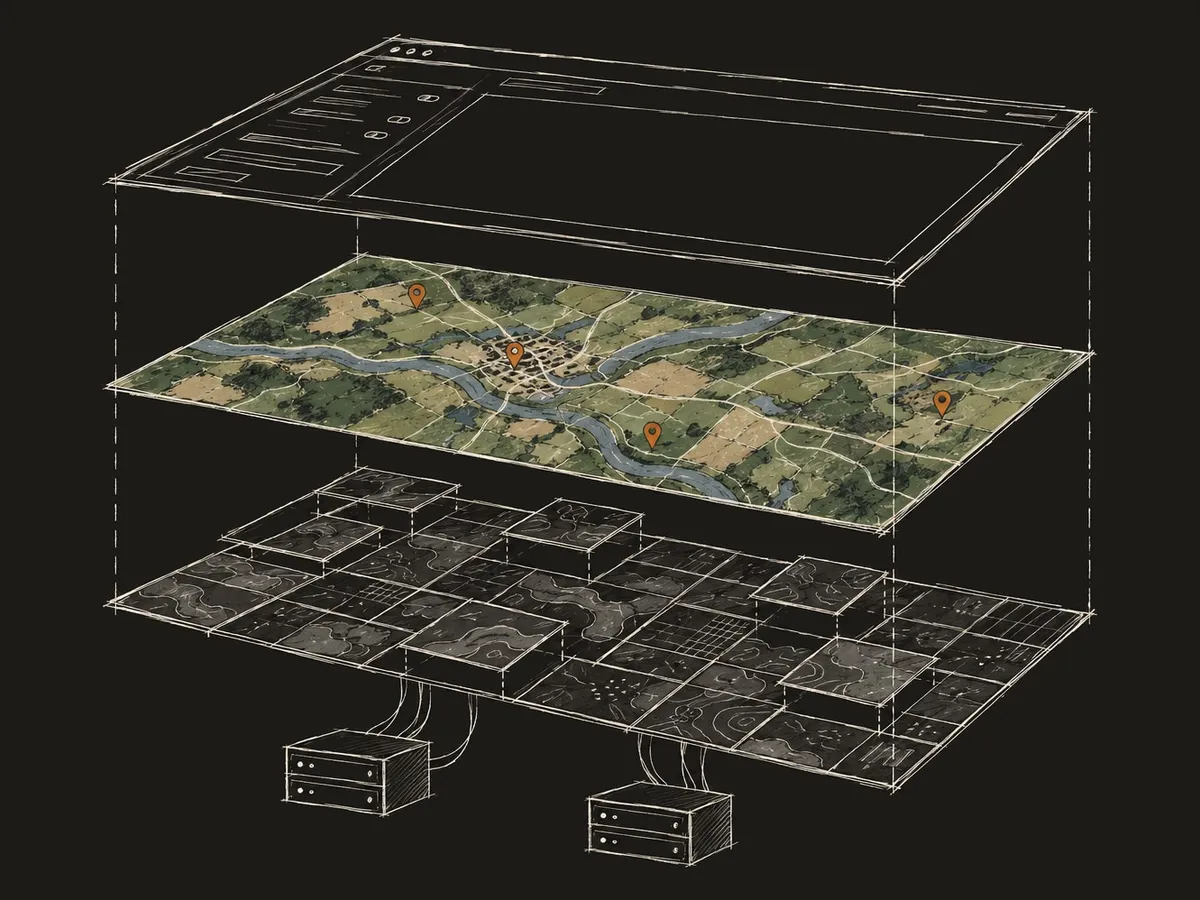
Felt makes it easy to build custom apps and workflows. Skip standing up tile servers or writing rendering code, and focus on what’s specific to your work. Embed maps with the JavaScript SDK, automate from Python or the REST API, and respond to changes with webhooks.
Share maps with clients, teams, and the public
Send a link, or embed a live map on your website. Clients and colleagues view and comment without a seat, and nobody needs GIS training to explore the map.

Teams that run on Felt

With Felt and Databricks, our site acquisition team was able to self-serve insights for the first time.

Felt saves us hours on every analysis and has enabled us to build faster without increasing team size.

I find Felt the quickest and easiest way to have planners and analysts visualize data.
See how teams like yours use Felt
Agriculture
Verify on-farm practices and track every field in a program
Cities and Government
Coordinate departments and publish maps for residents
Climate and Natural Resources
Run field surveys and monitor change across your sites
Education
Free maps for teaching and student projects
Energy and Utilities
Screen sites, track leases, and inspect assets in the field
Engineering and Infrastructure
Bring CAD, drone, and survey data together for client review
Geospatial Analytics
Stream imagery and deliver maps and apps to clients
Insurance
See which properties sit in flood and wildfire zones
Real Estate
Screen sites and track every deal on its parcel
Retail
Pick your next site and see how every store performs
Telecom
Plan the next build and keep field crews in sync
Transportation
Plan transit service and analyze fleet GPS data at scale
You own your data, and it stays secure
SOC 2 Type 2 and GDPR
Felt is SOC 2 Type 2 and GDPR compliant, with data encrypted in transit and at rest. The SOC 2 report is available on request.
Hosting in your region
Host your workspace in the US, EU, UK, Canada, or Australia, or run Felt in your own AWS account on the Enterprise plan.
Access you control
Choose who can view, comment on, or edit each project, map, and data source, and enforce SSO on the Enterprise plan.
See how people around the world are mapping with Felt
Common questions
- 01Can Felt replace ArcGIS?
Yes. Teams run their maps, analysis, dashboards, and field data collection on Felt with no Esri license. If you use ArcGIS today, Felt connects to your services and files, so you can move over all at once or one team at a time. See how Felt compares with ArcGIS.
- 02Does Felt come with data, or do I bring my own?
Both. The Global Library has ready-to-use layers, from boundaries and demographics to flood risk, roads, and buildings, and you add your own files, databases, and live links on top.
- 03What data can I bring?
Almost any spatial file, including Shapefiles, GeoJSON, GeoPackages, KML, File Geodatabases, and GeoTIFFs, up to 100 GB each. Upload a spreadsheet of addresses and Felt geocodes it, or connect a database or a Google Sheet that stays up to date.
- 04Can I share maps outside my team?
Yes. Send a link that opens without a login, invite clients to view and comment for free, or embed a map on your website.
- 05Is Felt secure enough for sensitive data?
Felt is SOC 2 Type 2 and GDPR compliant, and new maps are private until you share them. Enterprise adds SSO and regional hosting. See the security page.
Bring your data, see it on the map
Connect a database or drop in a file and see your data live on a map in minutes.