Black Sea Grain Initiative, Mamata Akella
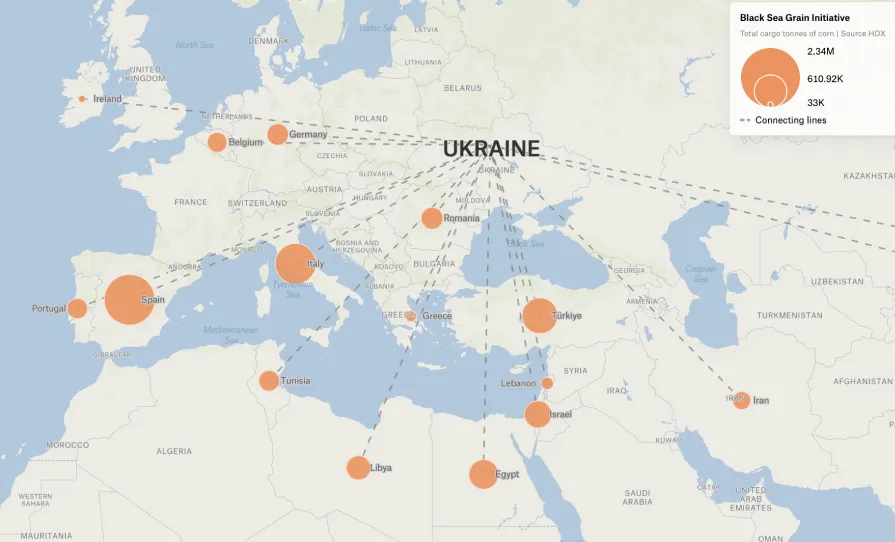
This is an origin-destination flow map that shows the total tonnes of corn shipped from Ukraine to countries participating in the Black Sea Grain Initiative as of January 2023. The flow lines were created in QGIS using point data from the Humanitarian Data Exchange and the Join by Lines tool to show which countries received corn from Ukraine during this time period. The resulting layer was uploaded and styled in Felt. Each receiving country is sized proportionately to the tonnes of corn imported from Ukraine.
Direct Flights from San Francisco International Airport, Chris Soriano
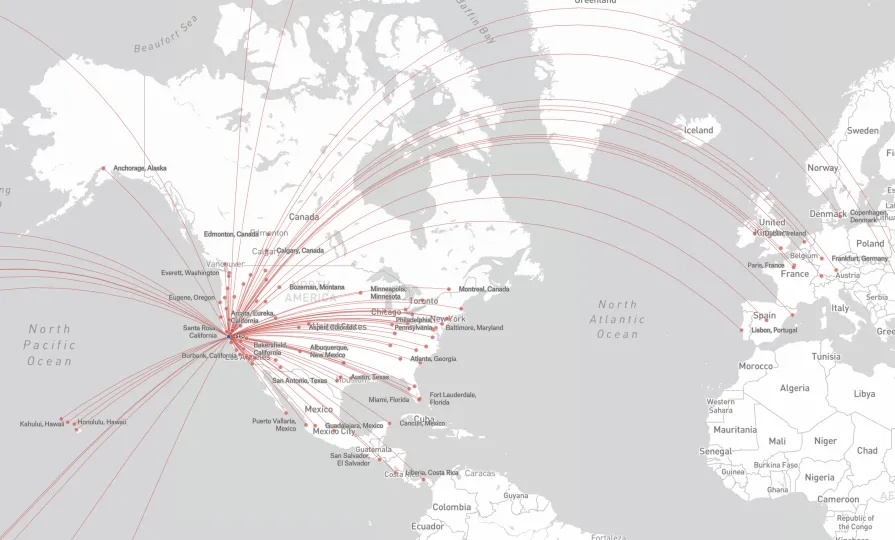
If possible when traveling, I like to fly non-stop to my destination (no connecting flights). With that in mind, I wanted to quickly visualize all the places I can go non-stop from San Francisco International airport (SFO). First I found a text list of direct flight airports from SFO. These didn't have latitude/longitude data included, so I found a listing of all world airports and their coordinates. Using QGIS, I combined these two datasets using a "vector join". Next, in QGIS again, I used a plugin called "Shape Tools" and the tool "XY to Line". This allowed me to make "great circles" from SFO to each of the destination airports. With these outputs from QGIS, I was able to bring them into Felt as GeoJSON files, apply styling and share my map with the world.
Most Gray Whales are Capricorns, RJ Ramey
.webp)
I wanted my map "Most Gray Whales are Capricorns" to tell a story about migration, but also to shake visitors out of "auto-pilot mode" and genuinely get them curious about the whales. So I needed the basemap to feel different. In December, Felt released the custom backgrounds feature, so I found a tile service from EMODnet (an agency of the EU) that draws the detailed bathymetry of the oceans— it's mesmerizing in itself— and Felt made it easy to implement that in just a few clicks.
The ocean floor spurred me to think about the whole map in whale-centered terms, and I no longer wanted the details on land to compete with the oceans. To block out the land, you need to cover it with a polygon of the same shape, but slightly smaller. This is a classic case in GIS for an analytical transformation called "Buffer" (although not many people realize you can buffer in the negative direction!)
QGIS makes buffering easy, but only if your layer is in a projection that uses feet or meters. Web Mercator isn't one of those projections. That makes QGIS a great pairing with Felt: I could re-save a shapefile of the continents in a better projection, then buffer it by -16000 meters (~10 miles), -48280m (~30mi), -144000m (~90mi), and -177000m (~110mi). To finish the map, I used all the best features of Felt: upload anything, style my data by category, changing colors and opacity however I liked, adding decorative (and funny) images — all to achieve a mysterious aesthetic for the North American interior. I'm hoping the gray whales approve.
Top Crops in California, Angelica Rodriguez-Arriaga
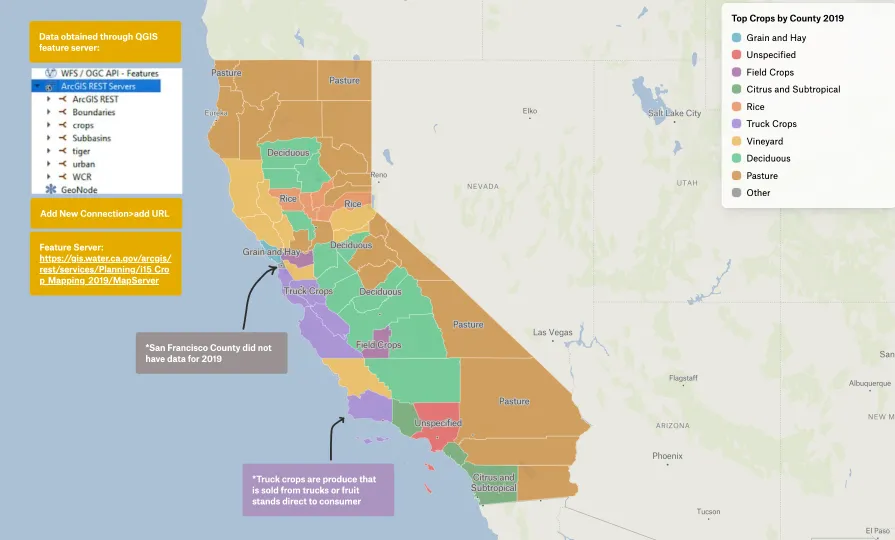
My goal for this map was to show the primary crop in each county in California, based on crop acreage, to get a better idea of agricultural patterns in the state. To make this map, I connected to a DWR feature server in QGIS to retrieve 2019 land use data. Next, I summarized the acreage sum for each crop in each county and filtered for the crop with the largest acreage in each county. I then merged the top crop acreage with the county boundary layer. I exported the county boundary layer, with the new column for top crop by acreage, as a GeoJSON file and imported it into a new Felt map for online sharing.
To build on this map, I would like to add data from previous years to see how or if recent changes to groundwater regulation, such as the Sustainable Groundwater Management Act or SGMA passed in 2014, have impacted land use, and subsequently agricultural patterns and economic activities in the state.
Try QGIS + Felt
By combining QGIS and Felt, users have access to the power of desktop GIS alongside the collaboration and sharing tools necessary for modern teamwork. Users who are adept at mapping software can process data in QGIS and bring into Felt for their teams to work with via Felt's easy and intuitive interface, or simply get the benefit of sharing their maps with a single link. Try sharing your maps on the web today.
Compare Felt using AI