Skip to content
LAT37.8044° NLON122.2711° WX-13611157 mY4551831 mE564166 mN4184363 mE6050014 ftN2120204 ftBRG041.0°041.0°040.6°042.1°ZOOM11.0CRS
County GIS dataChecked Oct 10, 2026

Fort Bend County, Texas GIS data

Parcels, city limits, flood zones, transmission lines and census tracts for Fort Bend County, Texas(county seat: Richmond), each from its official source and checked, with a map you can open in Felt.
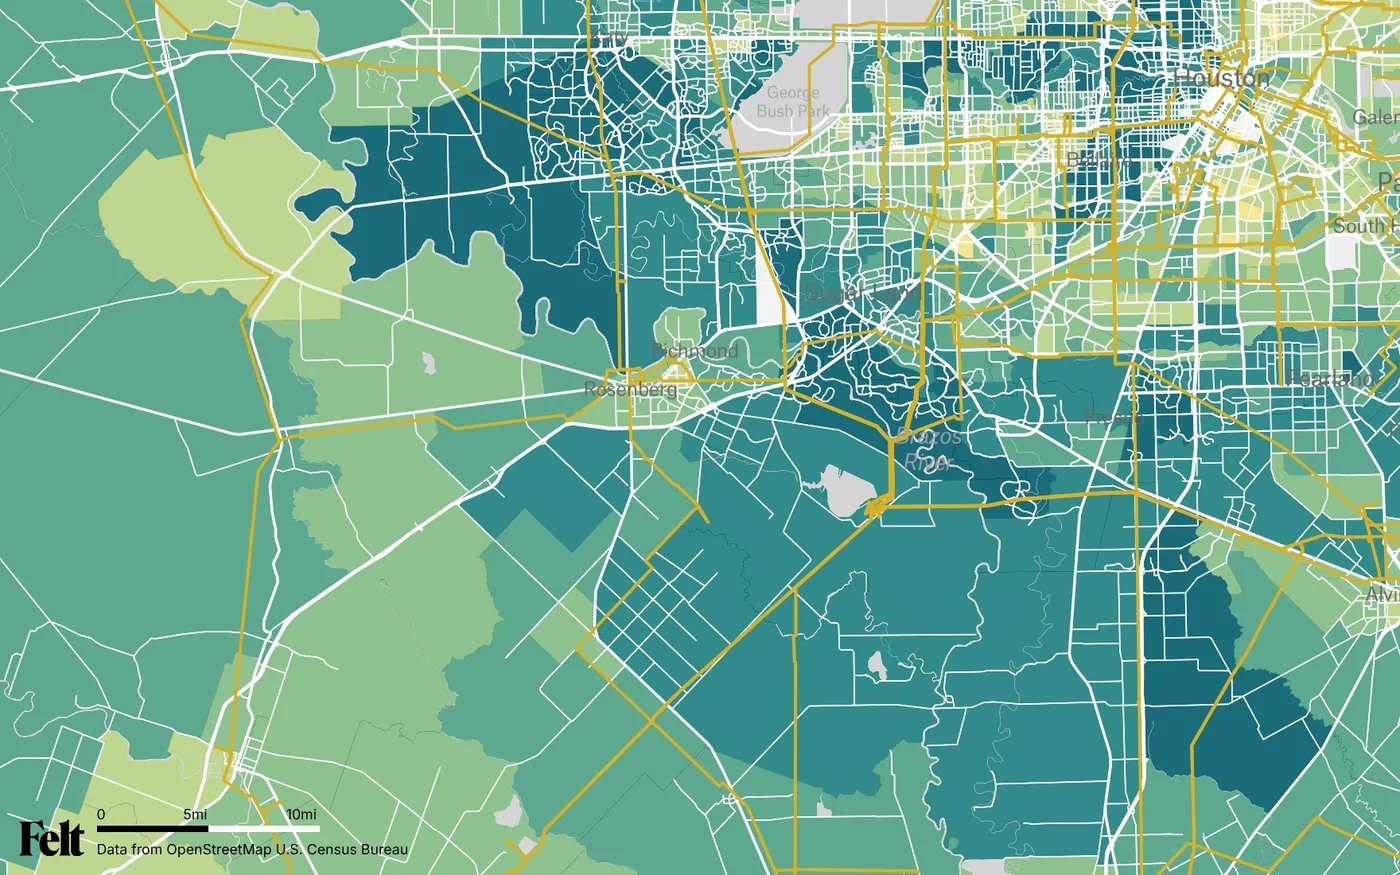
Map of Fort Bend County, Texas: the county outlined, with transmission lines over median household income by census tract
Fort Bend County, Texas, outlinedOpen the live map →
01
27.2%
of the county's land and inland water in FEMA's 100-year floodplain
02
479 mi
of transmission line, up to 345 kV
03
20
cities and towns with land in the county
04
$113,409
median household income; Texas $76,292

Where Fort Bend County's data lives

Each source is the publisher's own service, checked on October 10, 2026. A source that stops answering drops off this page rather than staying as a dead link. Add any of them to a Felt map by URL.

DataPublisherCheckedUpdatedService
ParcelsTxGIO StratMap, from Fort Bend County's appraisal districtTax year 2026. Appraisal district boundaries: approximate, not a survey.LiveMarch 2026Service URL ↗
City limitsTxDOT City BoundariesEvery incorporated city in Texas; the layer on the live map.LiveJuly 22, 2026Service URL ↗
Flood zonesFEMA National Flood Hazard LayerThe authoritative layer, kept current by FEMA.LiveMap Apr 2, 2014; revised Aug 9, 2024Service URL ↗
Transmission linesHIFLD Electric Power Transmission LinesA national snapshot: new lines and upgrades since then can be missing.LiveSeptember 5, 2023Service URL ↗
Census tracts and incomeCensus Bureau ACS 2019–2023, via Esri Living AtlasOn 2020 census tract boundaries; older tract counts for the county will differ.Live2019–2023 estimatesService URL ↗

Fort Bend County's own maps and records

Property search, parcel maps and data downloads from the appraisal district, and the county and city GIS, floodplain and zoning resources a local search turns up, each opened on October 10, 2026. These are where parcel records, permits and zoning decisions come from.

Common questions about Fort Bend County

01Where can I find a Fort Bend County parcel map and parcel data?

Free, from the source. The Texas Geographic Information Office's statewide StratMap parcel layer carries Fort Bend County's parcels from the county appraisal district, tax year 2026, collected in March 2026. The appraisal district's own property search and parcel map are listed under local sources below. Data resellers charge for copies of the same records. Add the layer to a Felt map by URL to filter, measure and share parcels with your team.

02Does Fort Bend County have zoning, and where is the zoning map?

Only inside city limits. Texas counties have no general zoning power, so unincorporated land in Fort Bend County is unzoned. Unzoned is not unregulated: Texas counties review subdivision plats and septic systems, and most permit development in the floodplain. Each city decides whether and how to zone. Houston and Rosenberg have no zoning ordinance at all. The city limits layer shows which city, if any, governs a site, and the cities' zoning maps are listed under local sources below.

03Which cities are in Fort Bend County?

17 cities and towns lie mostly inside Fort Bend County: Sugar Land, Missouri City, Rosenberg, Stafford, Fulshear, Richmond, Meadows Place, Weston Lakes and 9 smaller towns. Parts of Houston, Pearland and Katy reach in from neighbouring counties. The Census Bureau's current boundaries for incorporated places map each one.

04Where is the Fort Bend County flood map, and how much is in a flood zone?

27.2% of Fort Bend County's land and inland water lies in FEMA's Special Flood Hazard Area, the floodplain with a 1% chance of flooding in any year (zone A and its subtypes such as AE, plus V zones on the coast). The county's flood map (FIRM) took effect on April 2, 2014, with some panels revised as recently as January 29, 2021. Since then, 21 letters of map revision have changed it, the latest effective August 9, 2024. Flood zones are a planning screen, not a determination: check the effective FIRM for a specific property.

05Where are the high-voltage transmission lines in Fort Bend County?

HIFLD maps 479 miles of transmission line inside Fort Bend County: 288 mi at 138 kV and 191 mi at 345 kV. It marks 435 of those miles in service and records no status for the rest. The live map colours each line by voltage.

06What is the median household income in Fort Bend County?

$113,409, against $76,292 for Texas (ACS 2019–2023 5-year estimates). Across its 133 census tracts (2020 boundaries), tract medians run from $49,038 to $242,692, and the middle tract sits at $106,704.

Try Felt

Bring your data, see it on the map

Connect a database or drop in a file and see your data live on a map in minutes.