Connect
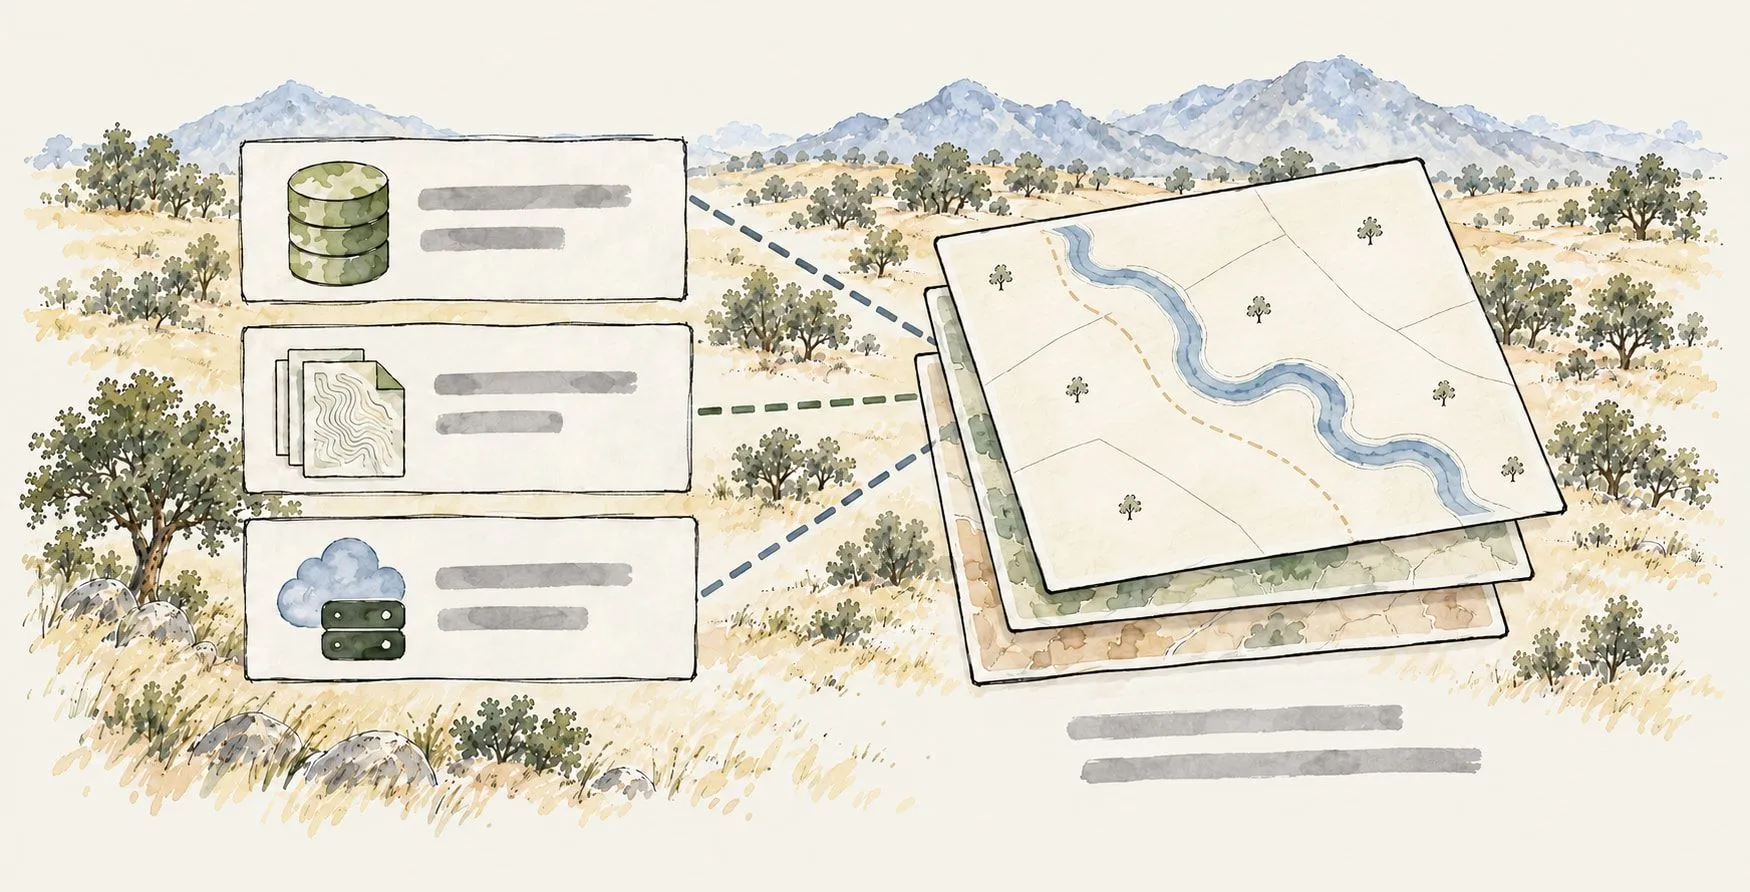
Every source on one live map. Files, live databases, Esri Feature Services, public layers from the Data Finder. Felt Server keeps shared layers authoritative.
One live map, connected to your sources, in the field on every phone. Captures land back in real time. Nobody exports, nobody re-keys.
Is this pole on the list or not?
The map lives in desktop GIS, behind a license the crew doesn’t have, so the truck gets a PDF. Nobody on site can tell what’s approved, what’s current or what’s already done.
Line technicianI texted you the photos.
Findings come back as texted photos, spreadsheet forms and GPS points in a notes app, and someone in the office spends part of every week typing them into the map.
Field inspectorThat’s not what we found out there.
By the time the captures are merged, conditions have changed. The office and the field are working from two versions of reality, reconciled in a Friday meeting.
Crew leadEvery source on one live map. Files, live databases, Esri Feature Services, public layers from the Data Finder. Felt Server keeps shared layers authoritative.
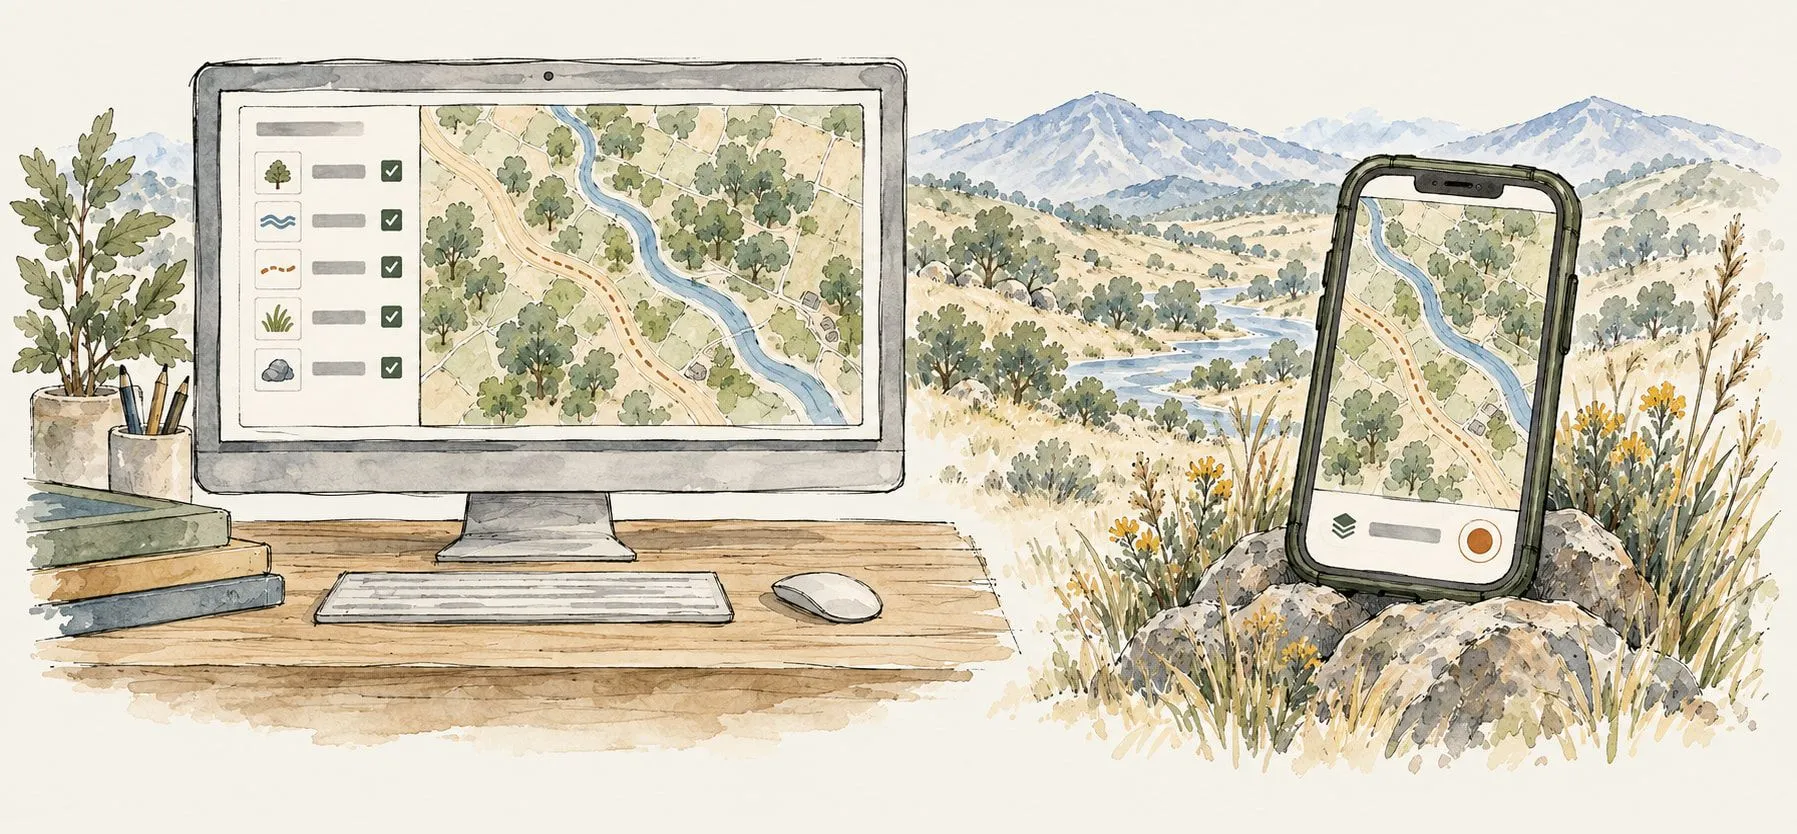
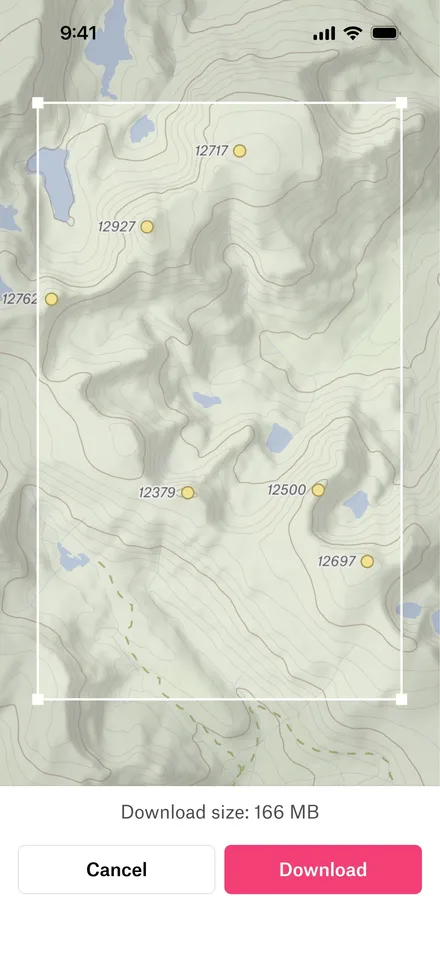
Crews open the same map on their phones, with offline areas for where the work happens. Collect and edit without coverage, sync on return. Everyone else views from a link.
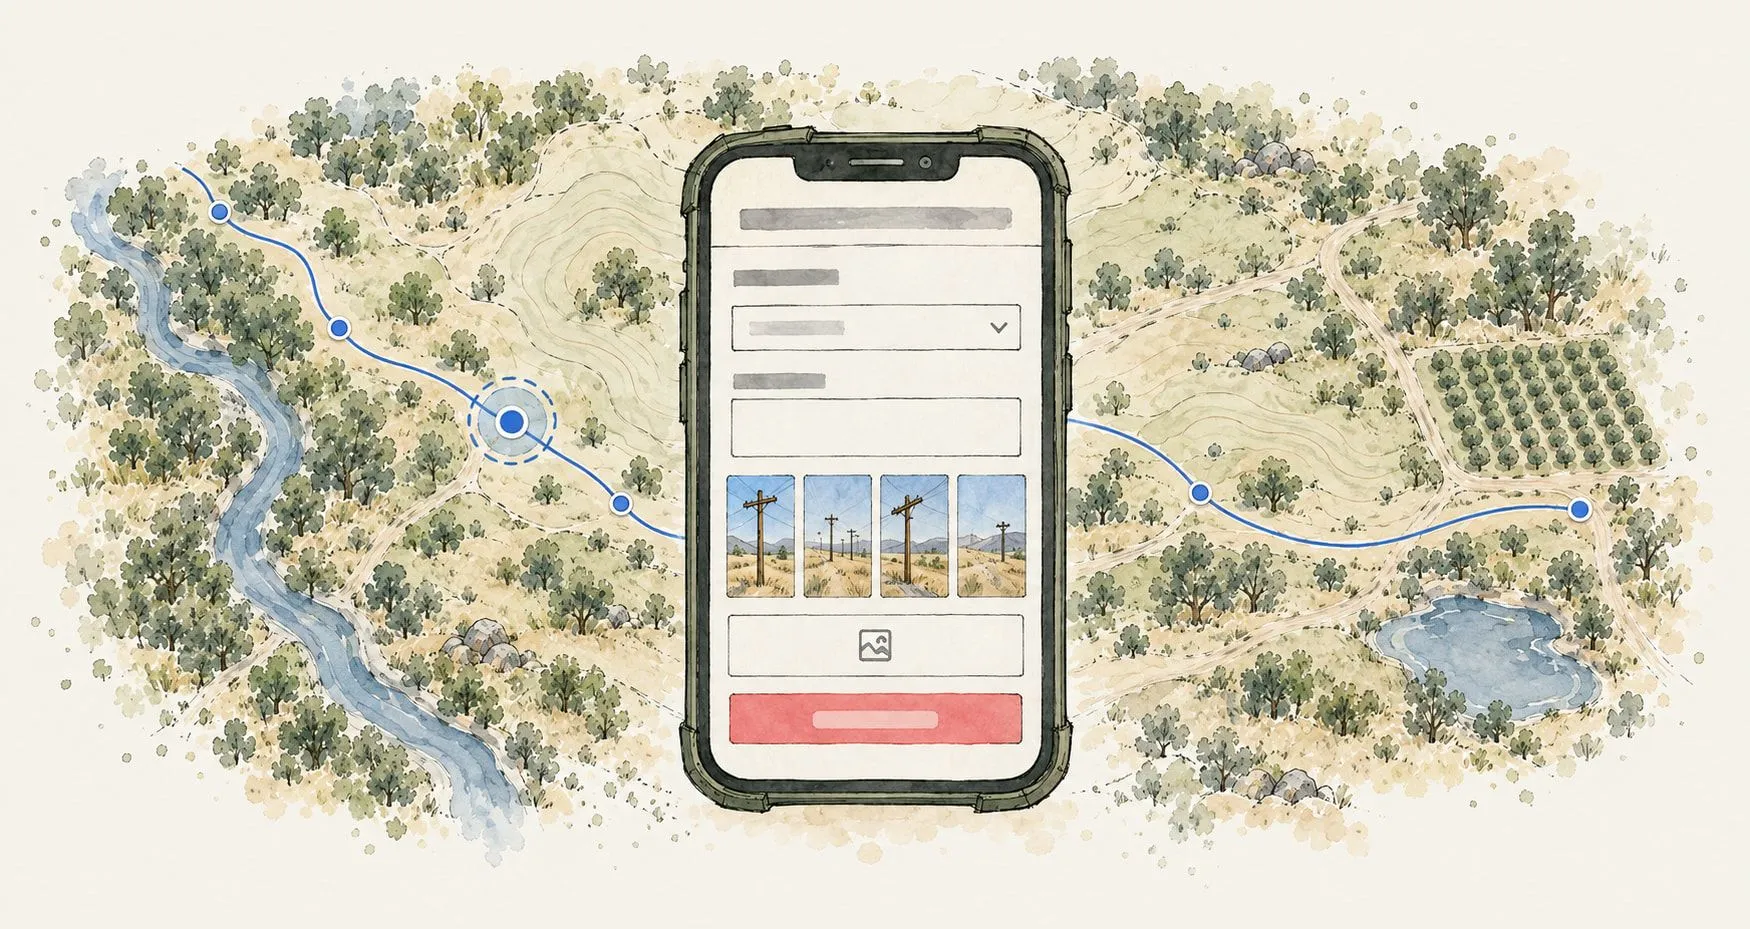
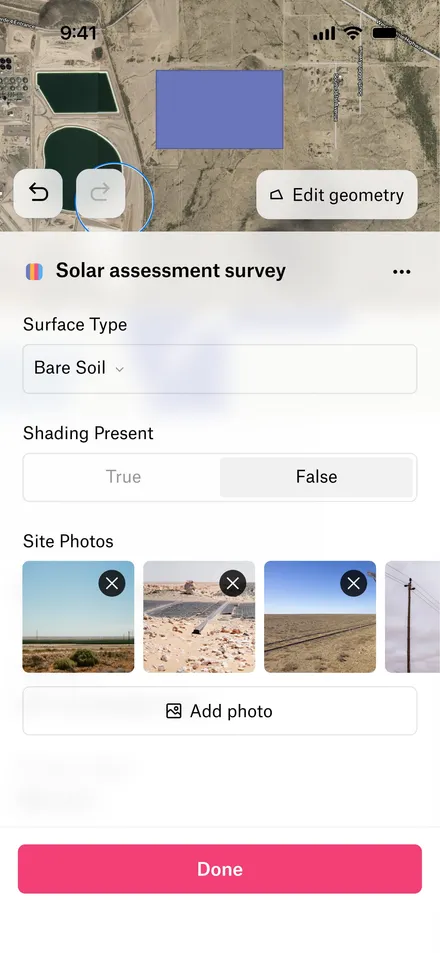
Pins, photos, and survey responses land on the feature they describe. Branching-logic forms, GPS tracing, and GNSS accuracy down to the centimeter.
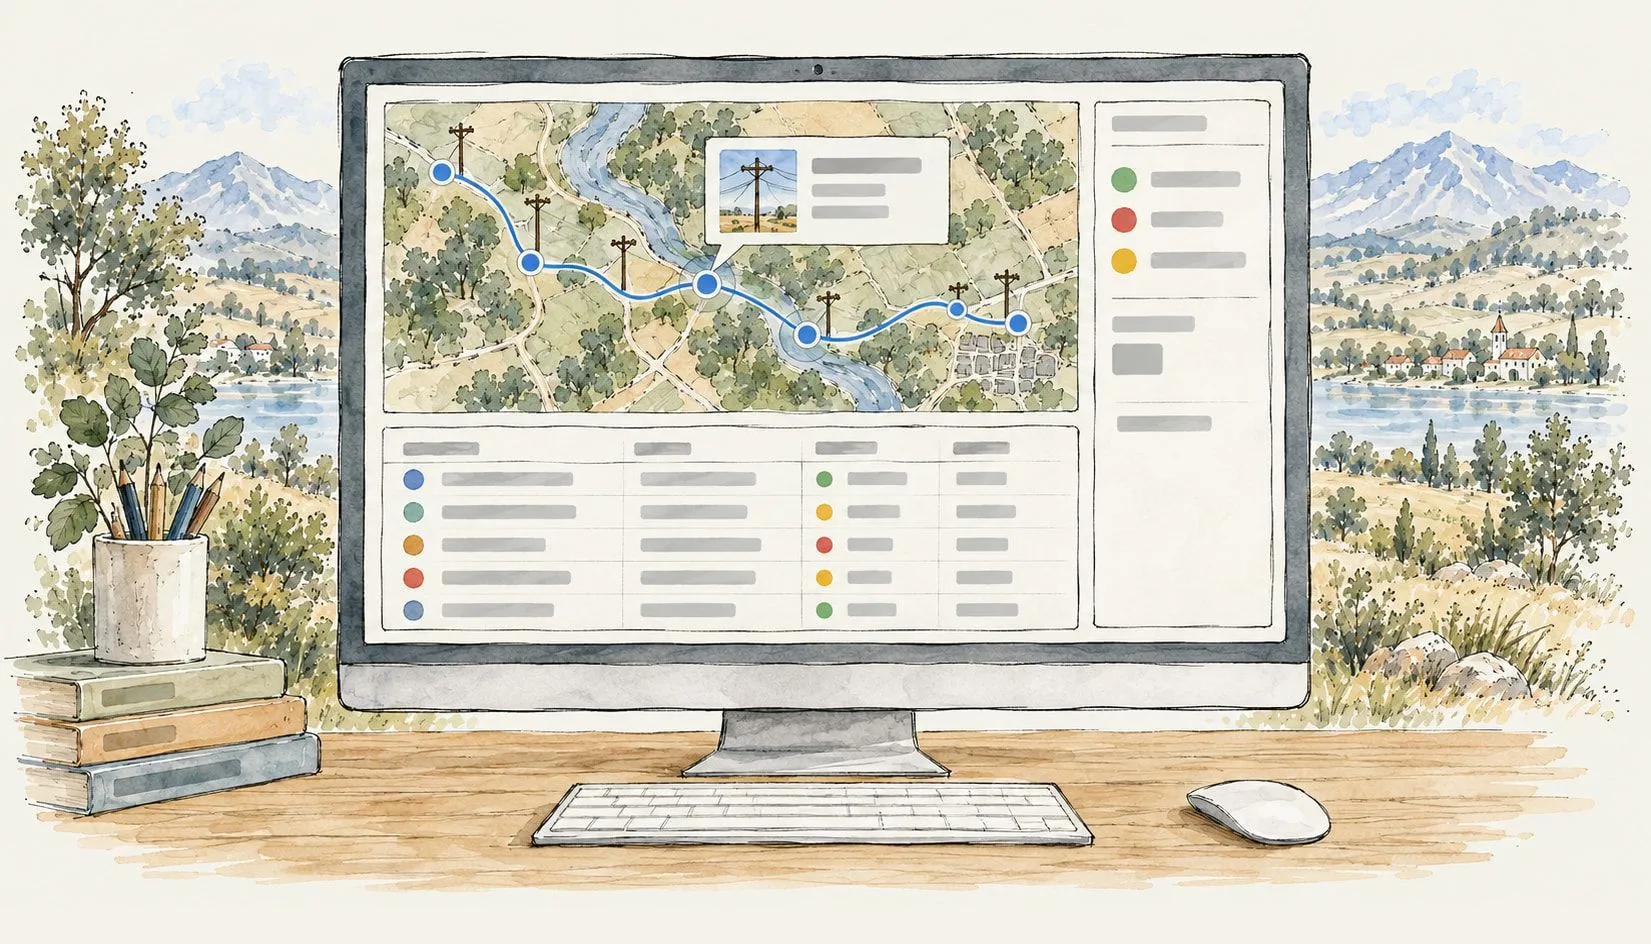
Captures hit the office map live. Review, approve, and watch dashboards update on today’s data. Tomorrow’s crews deploy against today’s map. The loop closes.
Felt’s field app puts the asset map and work orders on crews’ phones, online or off, so they can see tasks on the spot. They log inspections with photos, and each record lands on the office’s map with its location and asset details attached.
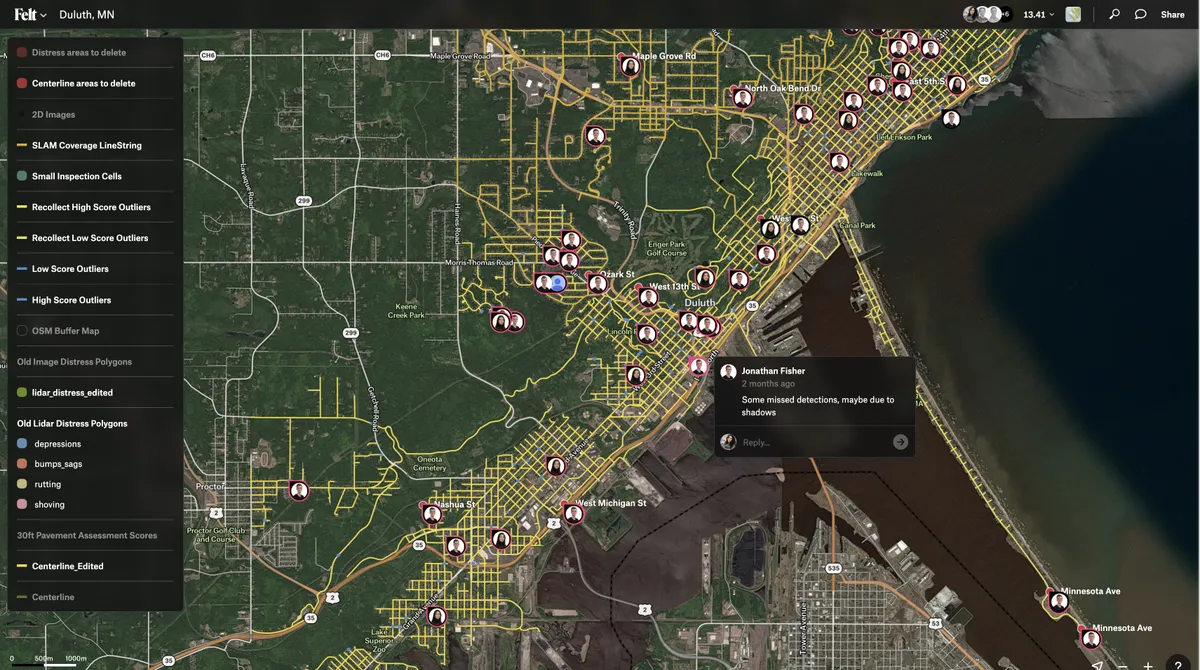

Our GIS analysts and software engineers got 20% of their time back when we moved to Felt – that’s huge.
 Asset registry
 Work orders and authorizations
 Parcel and landowner context
 Inspection status and defect reports
 Photos and geotagged evidence
 As-built corrections
Verifiers take field boundaries out on Felt’s field app and fill in surveys onsite, adding geotagged photos and boundary corrections. The program team reviews them the same day, with nothing to transcribe.
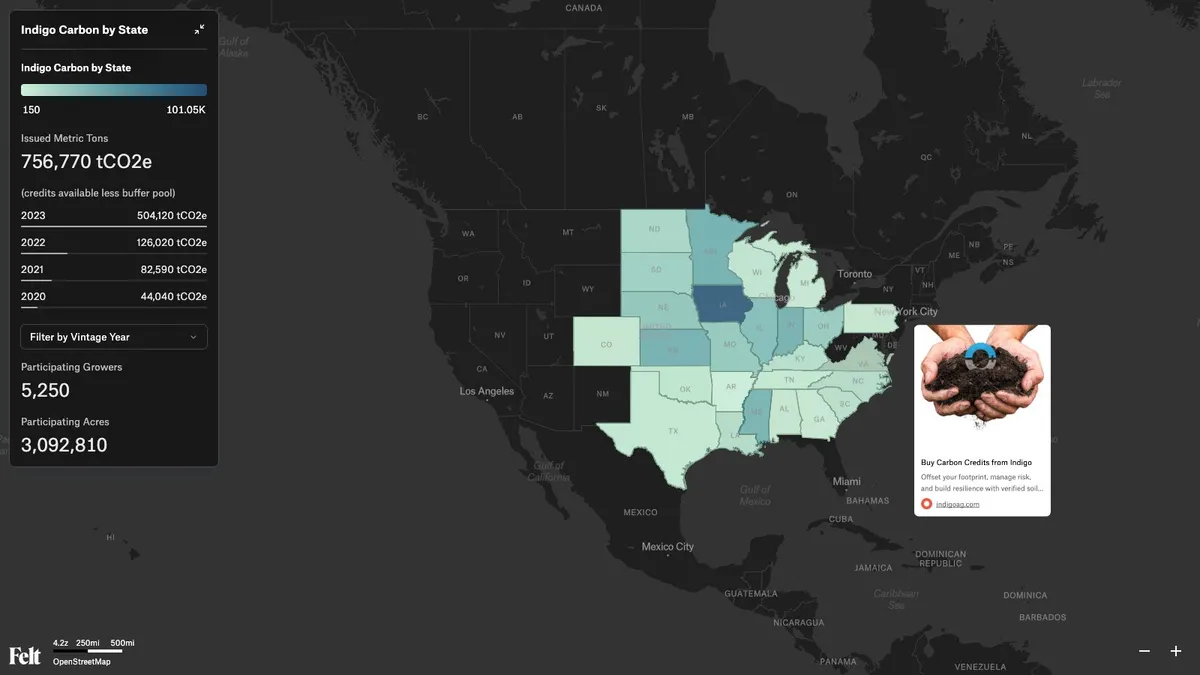

What used to take us two weeks of development now takes about an hour with Felt.
 Field and farm boundaries
 Enrollment and program status
 Imagery and analysis layers
 Verification surveys and observations
 Geotagged photos of practices
 Boundary redraws
Felt keeps response plans, critical assets and live incident feeds on one map that responders, partners and the public open from a link, with no account. Crews report incidents and damage from the field with photos, and the map updates for everyone as they do.
Once we discovered what we could do with Felt, we implemented it immediately.
 Critical assets and infrastructure
 Response plans and zone assignments
 Live incident and alert feeds
 Incident reports and status
 Damage assessments with photos
 Crew and asset locations
Every field team asks the same two questions: how does our data get in, and how do the captures get back?
Upload Anything. Shapefiles, GeoJSON, KML, GeoPackage, geodatabases, GeoTIFF, DWG/DXF, GPS tracks, spreadsheets, and most anything else GDAL reads.
Add by URL. Paste a link to a Google Sheet, an Airtable view, a hosted file, or an ArcGIS service, and turn on Live to keep it refreshing.
Global Library. Boundaries, roads, buildings, land cover, and flood risk: curated public data to set the field map’s context, on every plan.
Live connections. Postgres, Snowflake, BigQuery, Databricks, SQL Server, and Esri Feature Services keep internal data current on the map.
Felt Server. Shared layers stay authoritative across every map and season.
Field App, offline. View, collect, edit, and comment without connectivity. Changes sync automatically on reconnect.
Felt AI. Analysis on fresh field data: filters, joins, summaries, in plain English.
API + Felt MCP server. Wire field data into automated and agent-driven workflows.
Free to start. Viewers follow a link.