Skip to content
LAT37.8044° NLON122.2711° WX-13611157 mY4551831 mE564166 mN4184363 mE6050014 ftN2120204 ftBRG041.0°041.0°040.6°042.1°ZOOM11.0CRS
← Gallery
Planning

Energy Dashboard

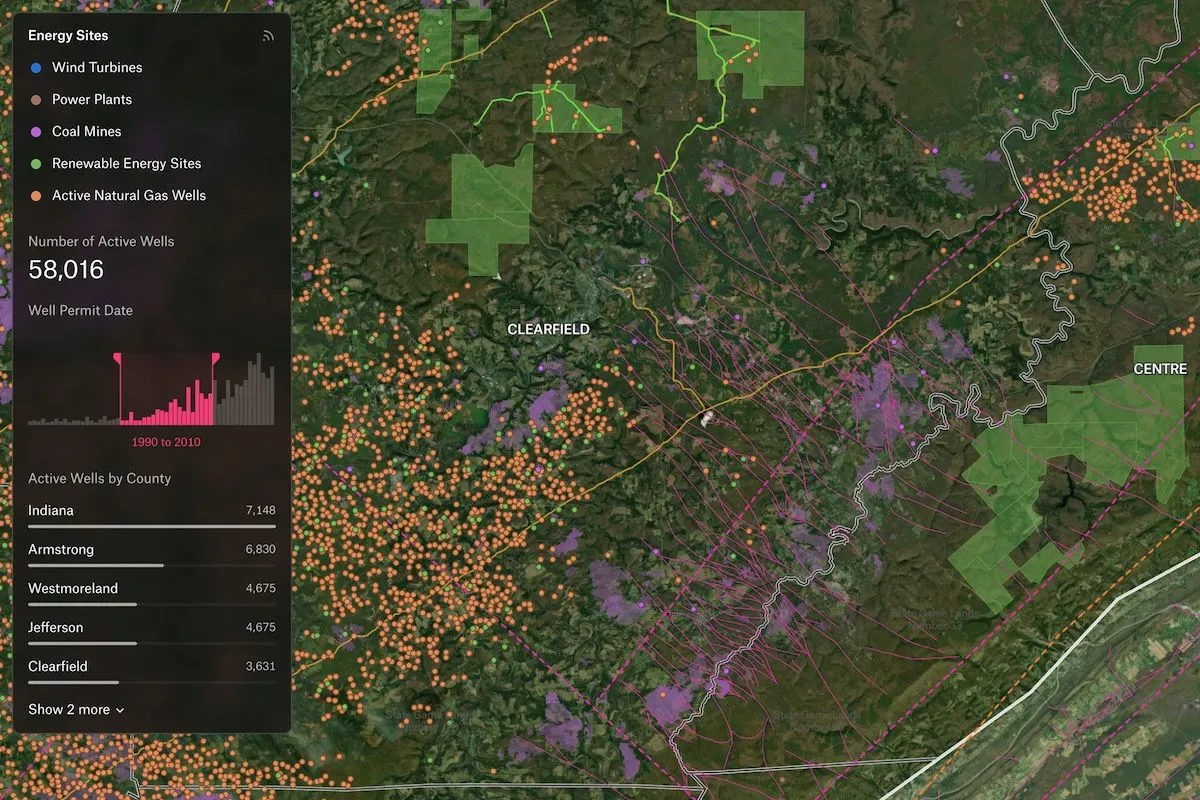
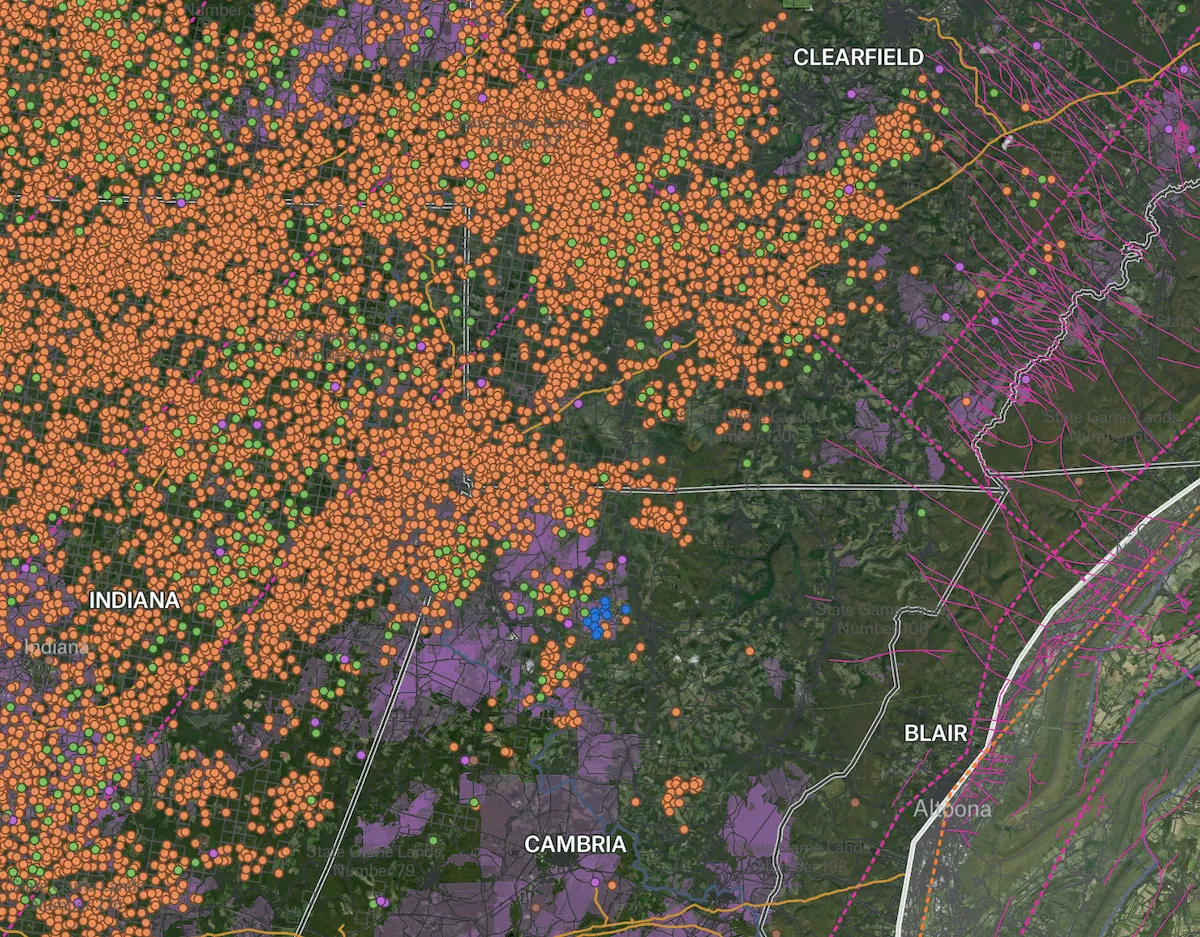
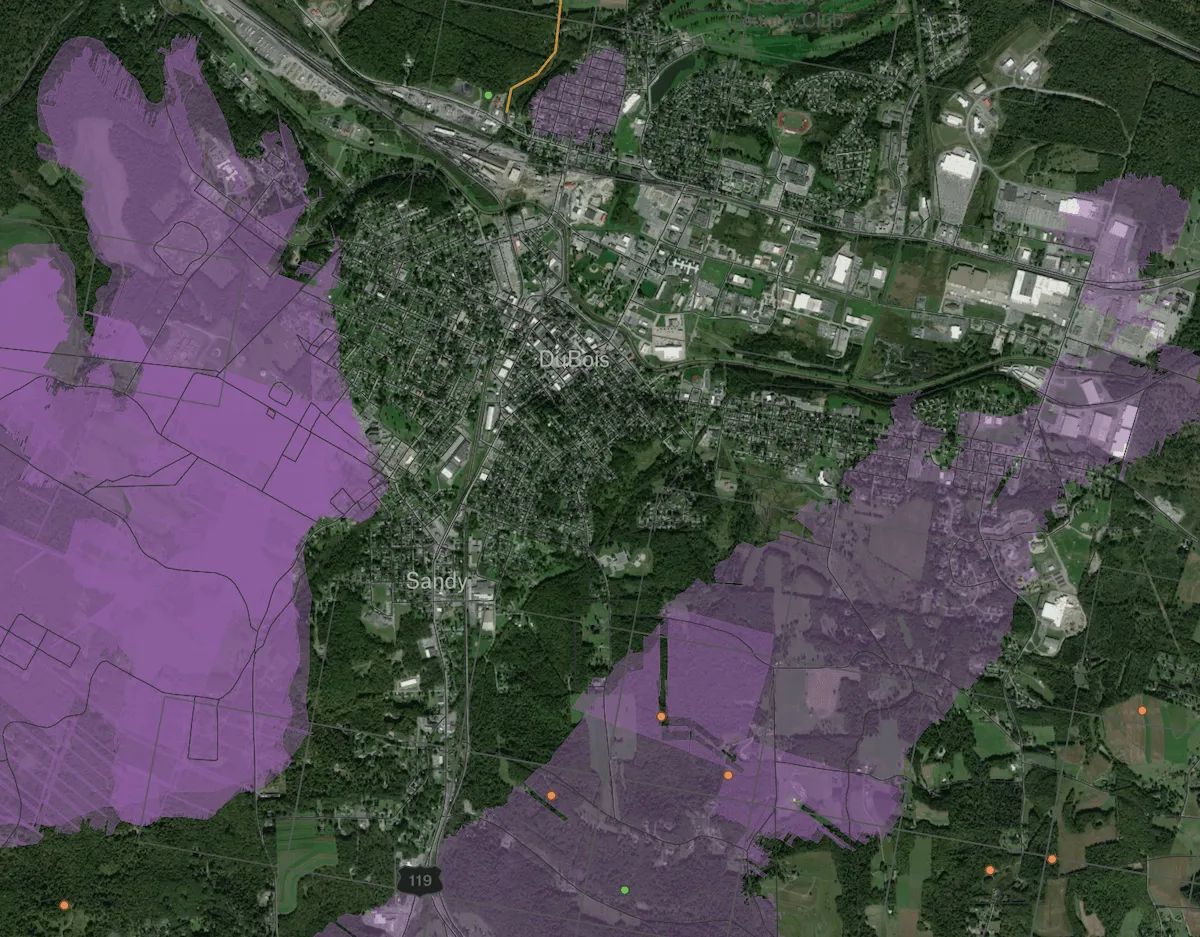
A sample dashboard from an energy company that tracks renewable energy sites, active natural gas wells, and well permitting time series data. Natural features like tectonics are also included, along with historical imagery from NAIP for highlighting temporal trends.
Preview of Energy Dashboard, an interactive Felt mapExplore this interactive map →
Energy DashboardOpen in Felt →
CartographerFeltCategoryPlanning

Track renewable energy sites, active natural gas wells, and well permitting time series data directly from any database. Natural features like tectonics are also included, along with historical imagery from NAIP for highlighting temporal trends.

More views

Try Felt

Bring your data, see it on the map

Connect a database or drop in a file and see your data live on a map in minutes.