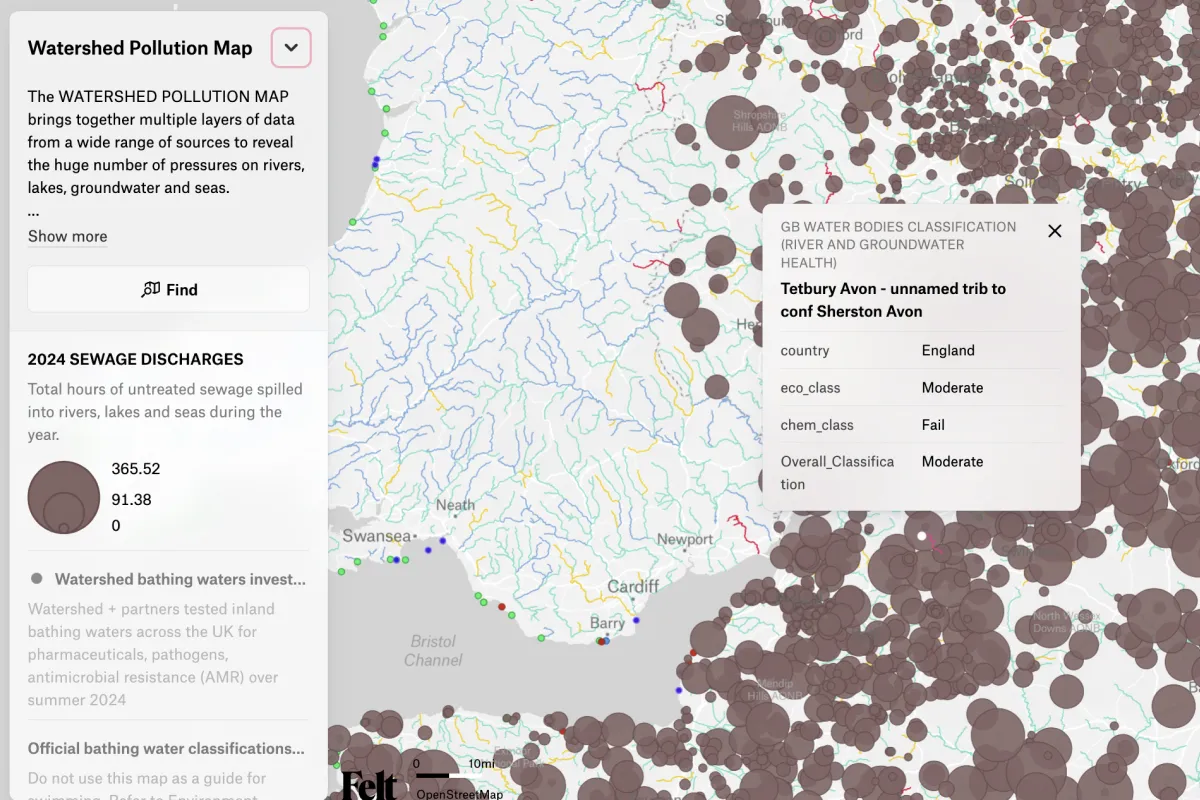
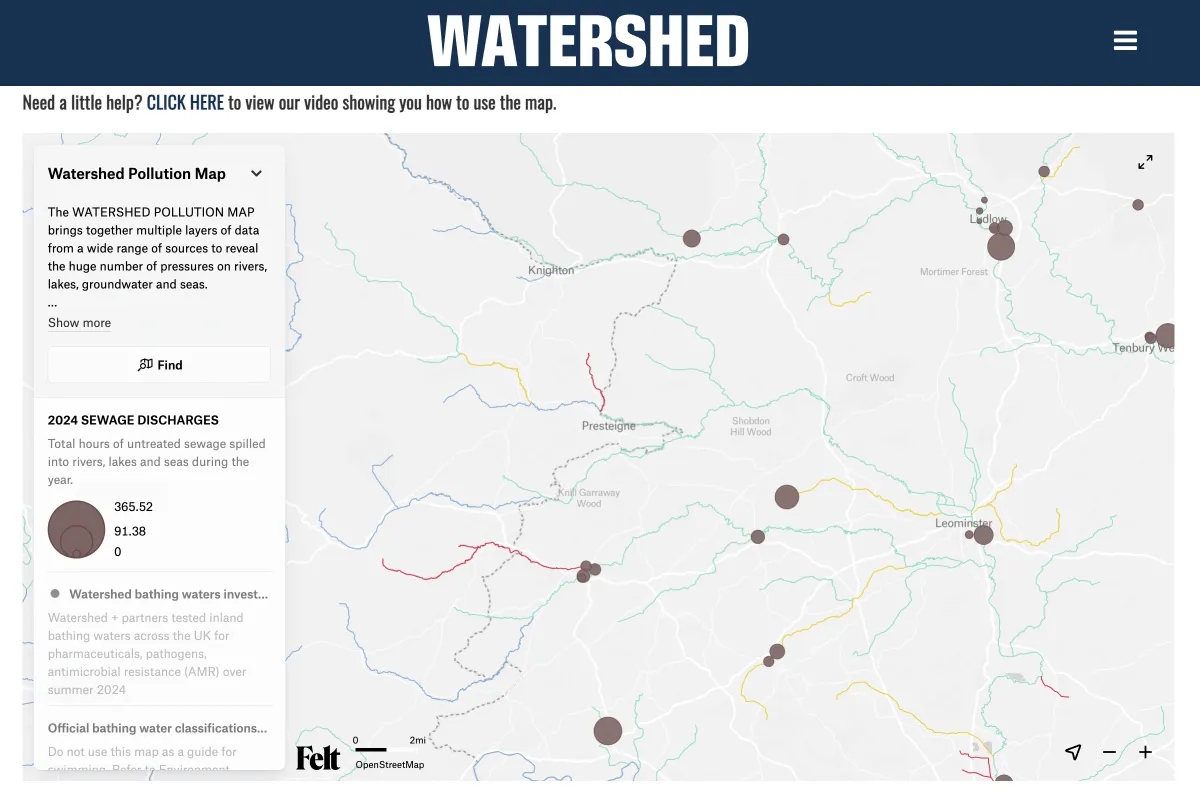
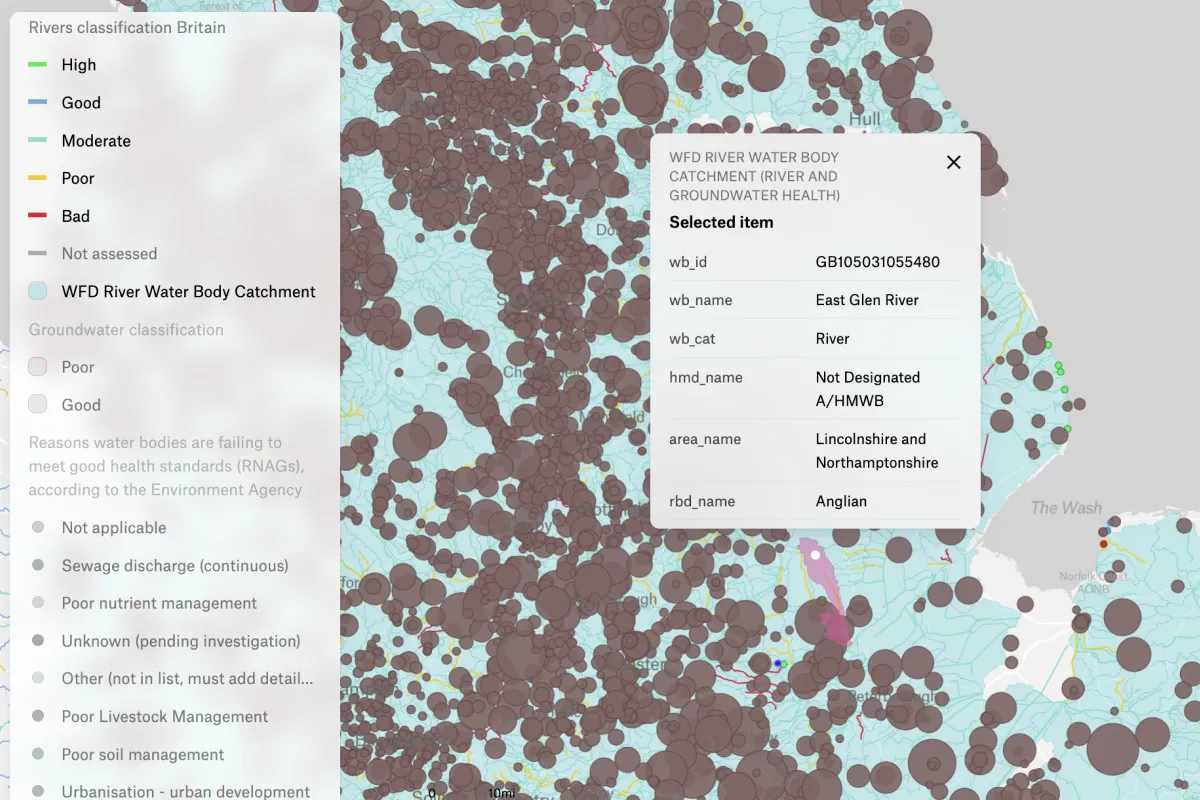
The Watershed Pollution Map reveals a huge range of potential pollution sources that can harm rivers, lakes, groundwater, coasts and more. The map contains data on: river, lake and groundwater health, bathing water health, damaged and protected waters, sewage dumping, chemical pollution, urban and road pollution, substances being discharged into waters, years of Environment Agency sampling results, intensive pig and chicken farms, intensity of cattle farming, landfills, waste sites and contaminated land, big industrial sites, political constituencies for 2024 and 2019, flood risk, and economic deprivation.
.webp)