.jpg)
Solar energy projects: Locations, examples, and how sites are selected
Solar farm locations aren’t chosen at random — they’re the result of detailed location intelligence. Developers need to know where solar energy can connect to the power grid. To do that, they evaluate solar irradiance, land suitability, and local permitting constraints.
Geospatial analysis makes this evaluation process fast and reliable. With GIS and modern mapping platforms, teams can layer data sets and analyze spatial data in context to improve early-stage decision-making.
Platforms like Felt bring these workflows into a collaborative, developer-friendly environment. You can visualize solar potential and share insights in real time, so it’s easier to move from the initial screening to final site selection.
Let’s take a closer look at what makes solar farm locations viable and how advanced mapping software enables data-driven development.
Why solar farm location matters
A solar farm can look perfect on paper but still fail once developers begin construction. Location drives both feasibility and profitability. No matter how good the design or how strong the financing, a site has to deliver consistent generation, manageable construction costs, and a clear path through permitting. Choosing the wrong location can delay deployment and erode returns.
Here’s why solar farm location is so important:
- Energy yield depends on sunlight availability: Sites with higher solar irradiance generate more electricity, which directly improves output and revenue.
- Infrastructure and grid proximity influence costs: Projects near transmission lines and substations reduce interconnection costs and avoid expensive upgrades.
- Environmental and land-use constraints impact permitting: Zoning rules, protected habitats, and land ownership issues delay development if not addressed early.
- Long-term operational efficiency: Terrain, climate, and site accessibility affect solar power performance and reliability over the lifecycle of the project.
Scale adds another layer of complexity. Utility-scale solar farms and photovoltaic (PV) power plants typically require five to seven acres per megawatt (MW) of capacity. Developers must find large, contiguous parcels that support these criteria.
Key factors that determine the best solar farm locations
On a global scale, solar projects in China now surpass those in the U.S. in both size and capacity. The largest solar farm in the world, in Qinghai Province, shows how fast photovoltaic parks are expanding and how global demand for large renewable energy sites continues to grow.
In the U.S., the best solar farm locations balance renewable energy production with buildability, grid access, and regulatory feasibility. A location might excel in one area, but unless it performs well across the board, it won’t back a successful solar project. The following factors guide how developers evaluate solar farm locations.
Solar irradiance and climate
Solar output starts with sunlight. Developers prioritize areas with high global horizontal irradiance (GHI) to maximize solar energy generation. Climate also plays a role, as frequent cloud cover, extreme temperatures, or heavy snowfall can affect efficiency and increase maintenance demands. Consistent, long-term weather patterns help teams predict performance and select sites with reliable MW capacity.
Land availability and topography
Solar farms need ample space and the right kind of terrain. Contiguous parcels make it easier to design efficient layouts and scale solar projects without fragmentation.
Slope, elevation, and soil conditions all shape how practical and cost-effective a site is to develop. Complex terrain can limit usable areas and increase engineering challenges. Developers look for flat or gently sloping land, which reduces grading costs and simplifies installation.
Proximity to grid infrastructure
Even a site with high energy potential will stall if it can’t connect to the grid. Developers tend to favor locations near existing transmission lines and substations to keep interconnection costs down and avoid construction delays. When a site is too far from that infrastructure, it often requires pricey upgrades or entirely new buildouts — which can impact project economics and slow timelines.
Land use regulations and zoning
Every site has its own rules. Before any solar project moves forward, developers must comply with local land-use regulations and complete the full permitting process.
Zoning laws, land-use designations, and environmental protections play a role in whether a solar project gets the green light. Sites with fewer restrictions and a clearer permitting path are easier to develop, but those with overlapping constraints can cause delays or stop a project altogether.
Felt lets you pull these data sets into a single view. Teams can import files in formats like CSV and GeoJSON, then layer key inputs including solar irradiance maps, slope and terrain data, and protected land boundaries. This helps visualize tradeoffs and identify high-potential, low-risk areas without switching between tools.
5 best states for solar energy farms
The following states have all the right conditions for solar power plants: open land, abundant sunlight, accessible grid connections, and favorable policies. Together, this creates a steady pipeline of large-scale clean energy projects.
California
California leads the nation in total installed solar capacity and has the largest solar farm in the USA, hosted by Kern County. Even with permitting delays and grid congestion, the state sets the benchmark for utility-scale development in the solar industry.
Texas
Texas is one of the fastest-growing solar markets in the U.S. Its land availability and grid flexibility make it highly attractive for power plant developers. Large-scale projects are increasingly concentrated in West Texas, since the open terrain supports quick buildouts.
North Carolina
North Carolina has less intense sunlight than western states, but its stable policies and available land support steady growth in solar power. It ranks among the top markets in the country, with utility-scale solar projects spread across its rural counties.
Florida
Florida’s major utility companies drive the state’s solar generation. Strong sunlight and favorable economics make solar projects particularly attractive in central and northern Florida, where developers can find readily available parcels.
Arizona
Arizona has some of the best natural conditions for solar power plants. High irradiance and desert landscapes make it well-suited for utility-scale projects. Much of the state’s development occurs in the southern and western regions, where clear, dry conditions support consistent output.
How GIS helps identify solar farm locations
Solar farm site selection is heavily influenced by geospatial analysis. GIS tools evaluate how solar potential, land conditions, and environmental constraints interact, helping developers narrow down viable locations. These platforms analyze several layers at once:
- Solar irradiance maps: Measure how much sunlight a site receives
- Land use data: Identify available land and avoid incompatible uses
- Topography: Assess slope, elevation, and terrain suitability for construction
- Grid infrastructure: Locate nearby substations and transmission lines
- Environmental constraints: Flag protected areas and restricted zones
- Parcel boundaries: Determine ownership, size, and fragmentation of usable land
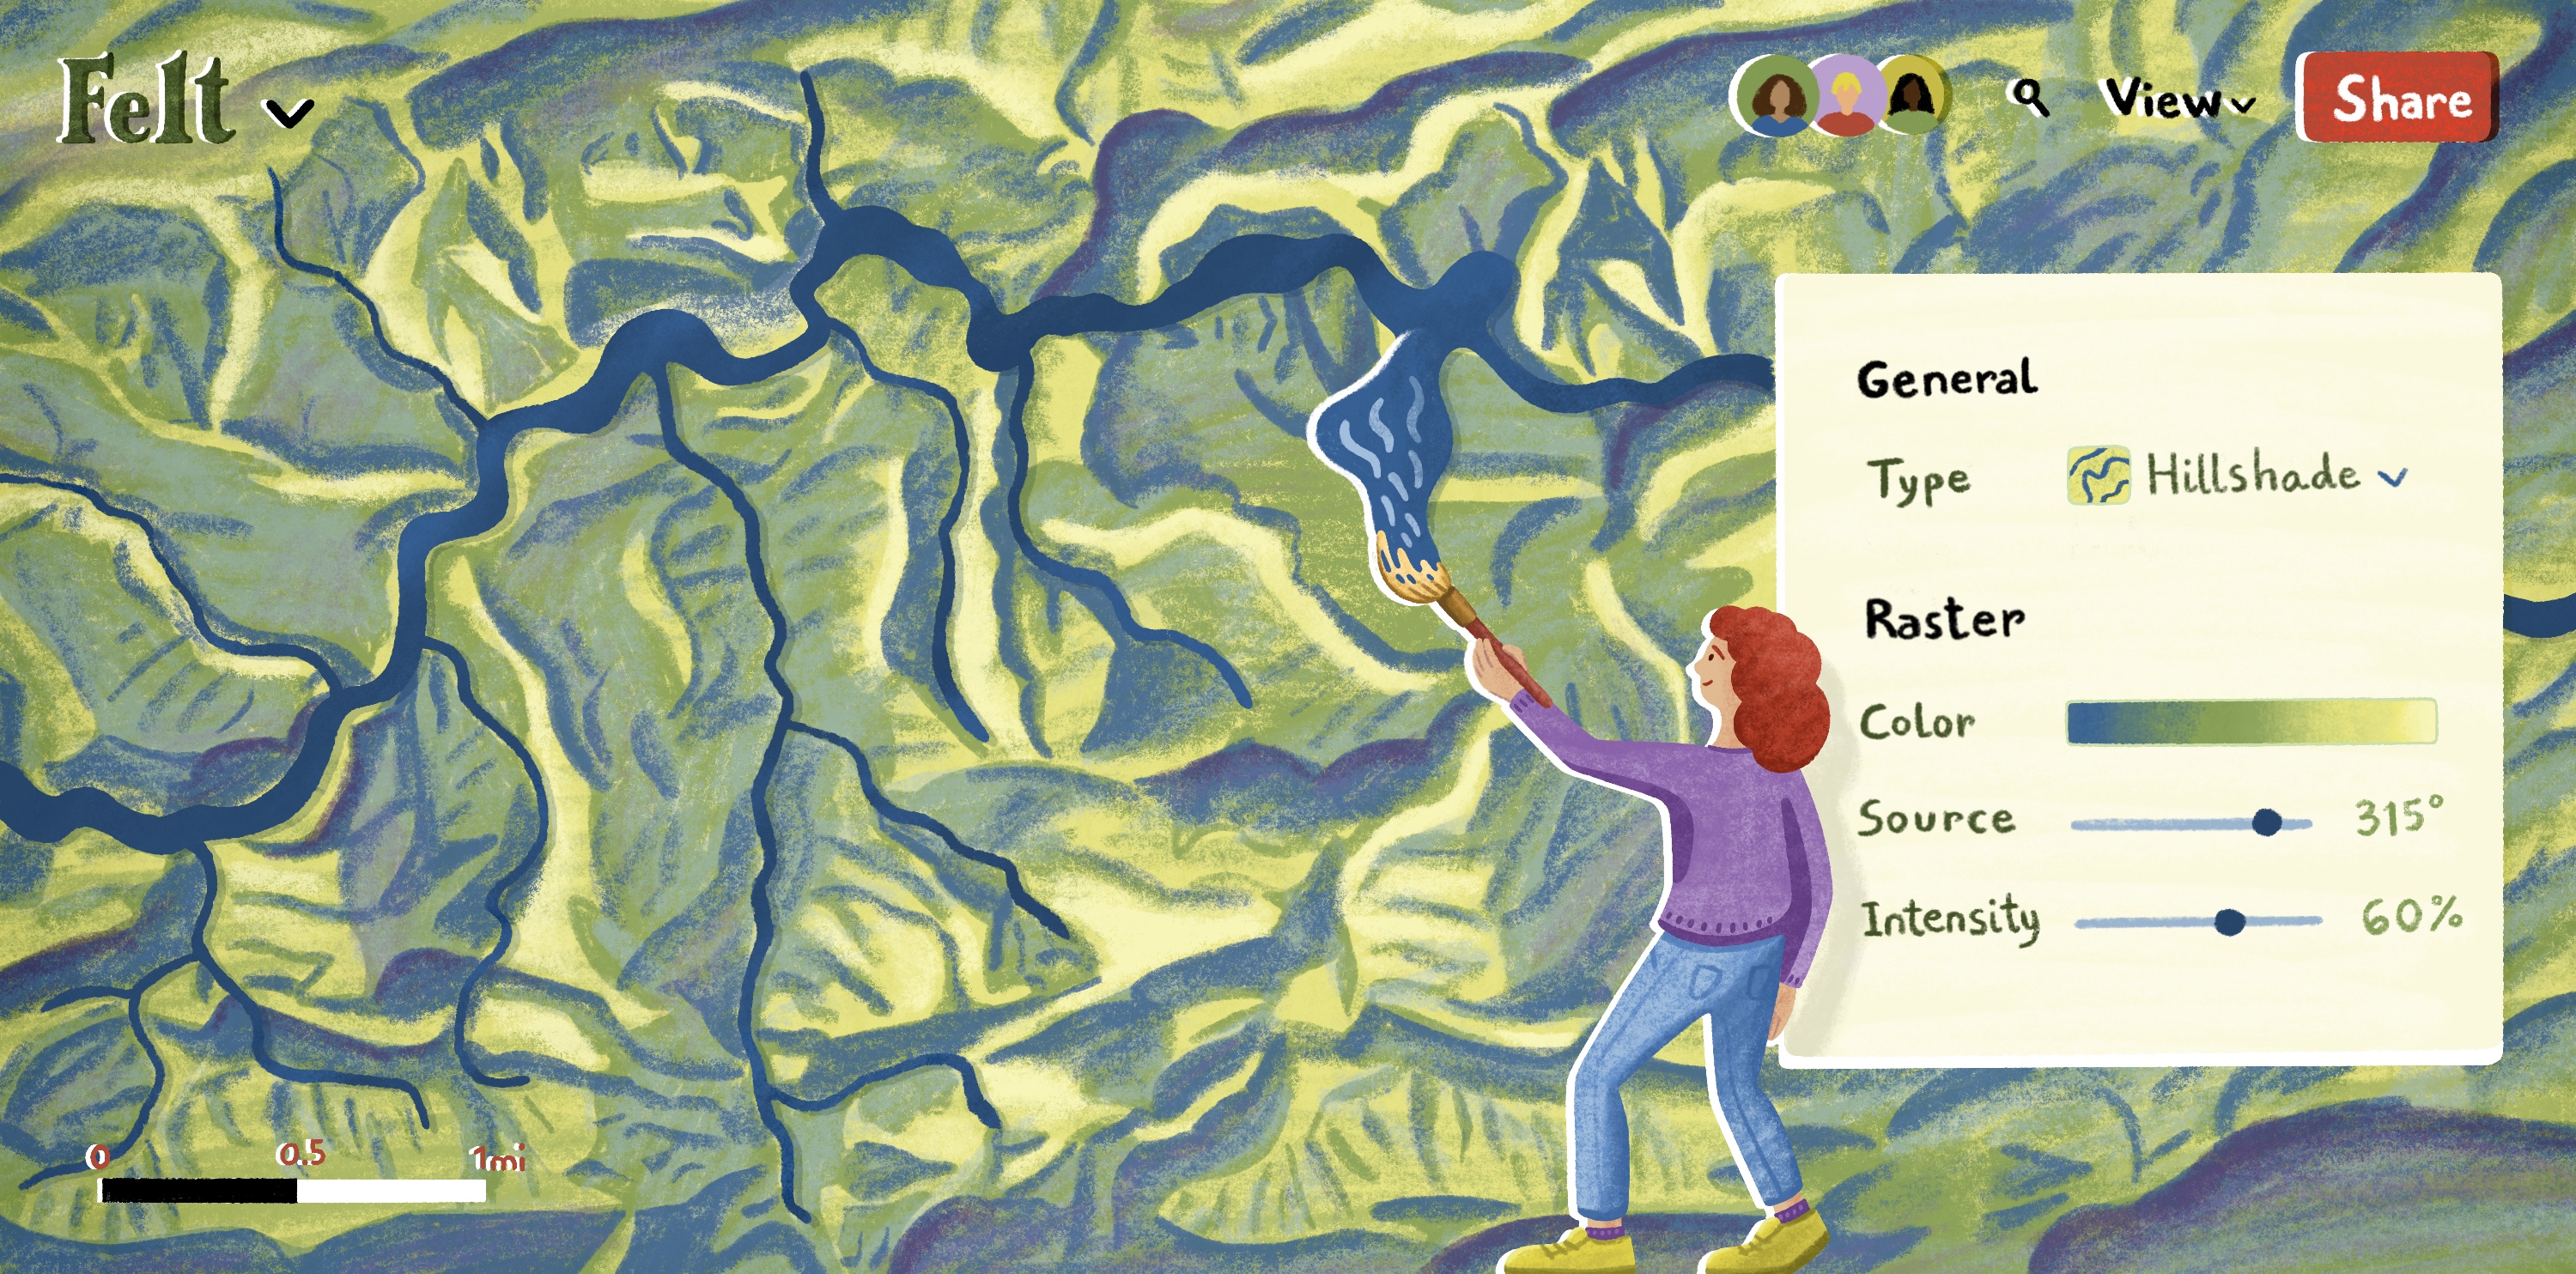
Thanks to Felt’s in-browser spatial analysis tools, teams can buffer roads or waterways to maintain distance from infrastructure. They can also clip data sets to a specific region of interest and filter parcels with slopes under 10%. Felt supports solar project workflows by:
- Overlaying solar resource maps and available land parcels to find high-yield sites
- Finding parcels near substations to reduce interconnection complexity
- Analyzing terrain slope and shading to rule out high-cost/low-performance areas
- Reviewing overlapping constraints like protected land and zoning restrictions
These workflows help developers make confident, data-backed decisions for site selection.
How Felt helps teams analyze solar farm site data faster
Solar farm site selection relies on layered geospatial analysis — including solar irradiance and land use — to assess site viability. While traditional tools offer analytical power, many teams prioritize speed and collaboration when considering different sites. Felt can help.
Felt is an enterprise-ready mapping platform built for large-scale energy and utilities analysis. It combines fast, in-browser spatial analysis with cloud-connected data and AI-assisted querying. Teams can buffer roads or waterways and filter parcels by slope — all without leaving the map. Live connections to cloud sources keep terrain models and environmental constraints up to date as developers evaluate new sites.
With Felt AI, users can query large datasets in plain language to surface parcels near substations or flag overlapping restrictions. These capabilities support rapid screening and make it easy to share results with non-GIS stakeholders through interactive maps that update in real time.
Explore how Felt helps you map solar farm locations and check out the energy and utilities map gallery to see it in action.
Compare Felt using AI


.jpg)