Understanding spatial analysis and why it matters
Spatial analysis reveals patterns and relationships hidden in location-based data. When combined with tools like geographic information systems (GIS) and remote sensing, raw numbers transform into meaningful visualizations that guide public policy and business decisions.
From identifying traffic congestion to monitoring changes in vegetation, spatial analysis provides the tools and visualization to address challenges and uncover opportunities for growth. Read on to learn more about what spatial analysis is, including how it works and the key techniques that help transform geographic data into actionable insights across industries.
How spatial analysis works
Spatial data analysis follows a repeatable workflow built on the following three steps. Each ensures information aligns correctly and produces reliable results.
Data preparation
Every analysis starts with high-quality spatial data from satellites, field surveys, or existing GIS files. Spatial analysts validate and standardize this information to guarantee accuracy and then organize it into raster or vector layers to capture additional details.
Analysts also georeference data so every layer lines up correctly on the map. For instance, city planners have to make sure road networks, congestion points, and sensor readings all use the same coordinate system before they can look for patterns.
Analysis techniques
After data prep, analysts use several techniques to explore geospatial relationships, including:
- Proximity analysis: Examines how close geographic features are to each other.
- Overlay analysis: Stacks multiple map layers on top of one another.
- Hotspot analysis: Detects areas with unusually high or low activity.
Keep in mind that information isn’t always available everywhere. For example, air quality sensors might cover half the city instead of every street. In those cases, analysts use geostatistical methods like interpolation to estimate the missing values and get an idea of what’s going on in that area.
Evaluation and iteration
Analysts need to review results to see if spatial patterns match actual conditions. Teams often compare outputs across maps, models, or time periods to check for accuracy. If something seems off, they adjust parameters or try other techniques.
Because this is a reproducible process, teams can rerun the analysis whenever new data comes in. This prep-analyze-review cycle keeps insights fresh and results consistent, so you’re always working with the most relevant information.
Key spatial analysis techniques and their applications
Let’s look at the top ways to analyze spatial data and why they matter in the real world.
Proximity analysis
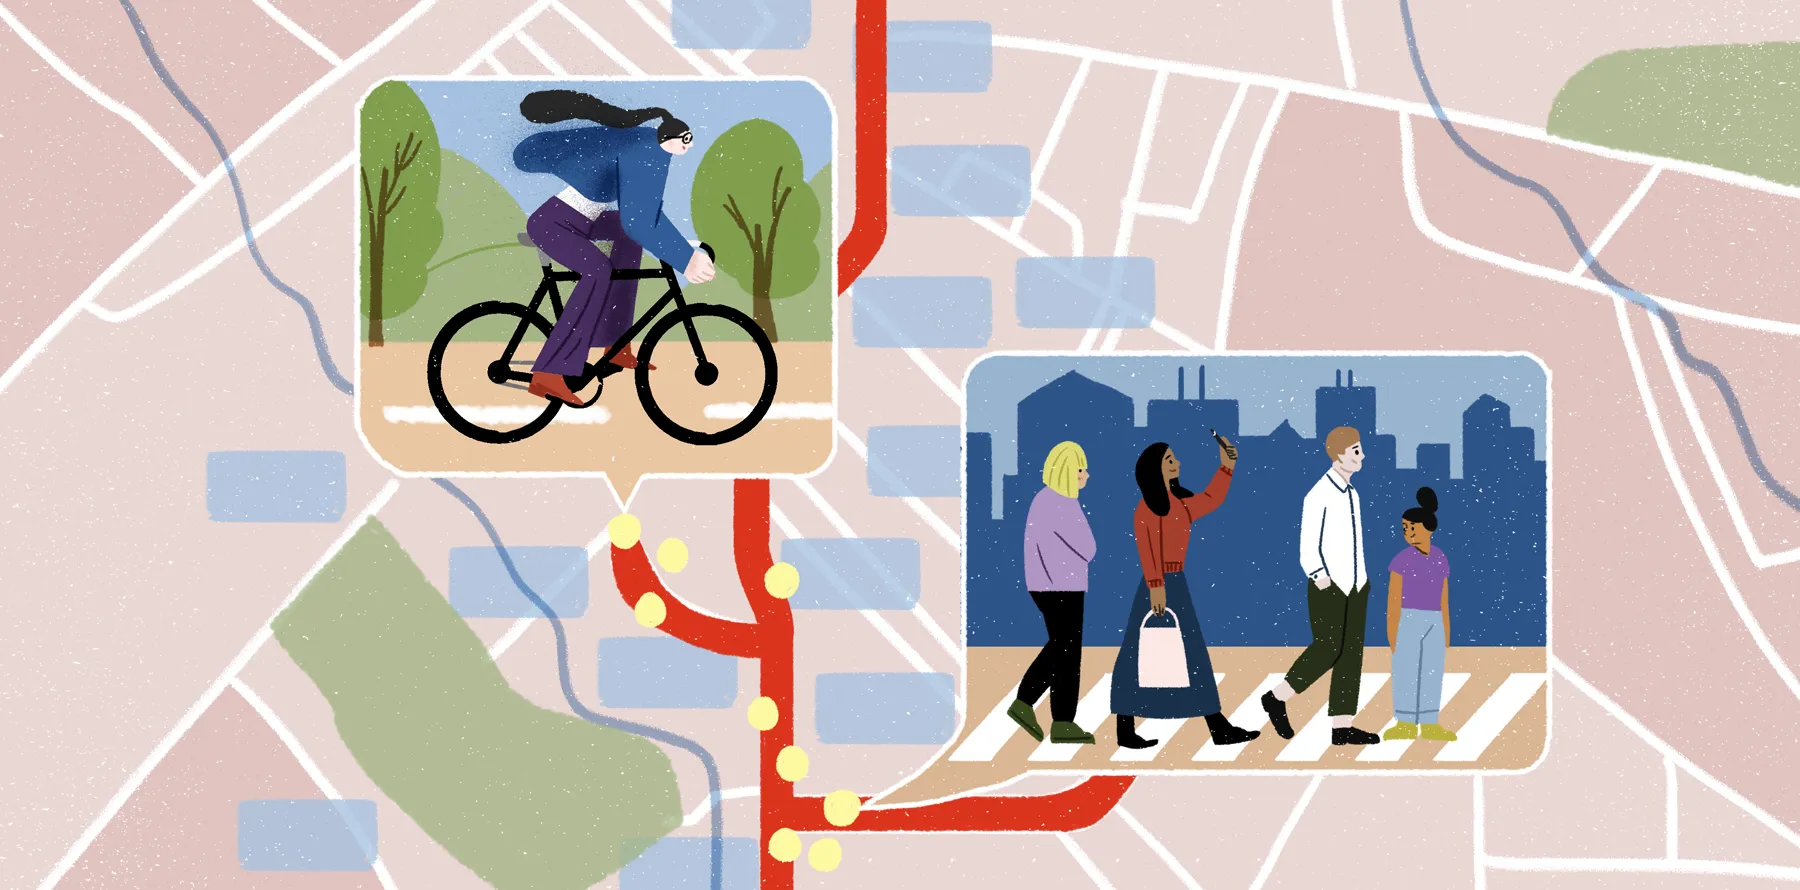
Proximity analysis measures the distance between geographical features. Thanks to this technique, urban planners can see which neighborhoods are within walking distance of a subway or bus stop and use that information to make infrastructure improvements. Logistics companies also apply this method to check how close their warehouses are to delivery routes and keep supply chains running smoothly.
Tools like Felt make proximity analysis a lot easier. Teams can drop pins, draw distances, and visualize results on a shared map so there’s no more working in silos.
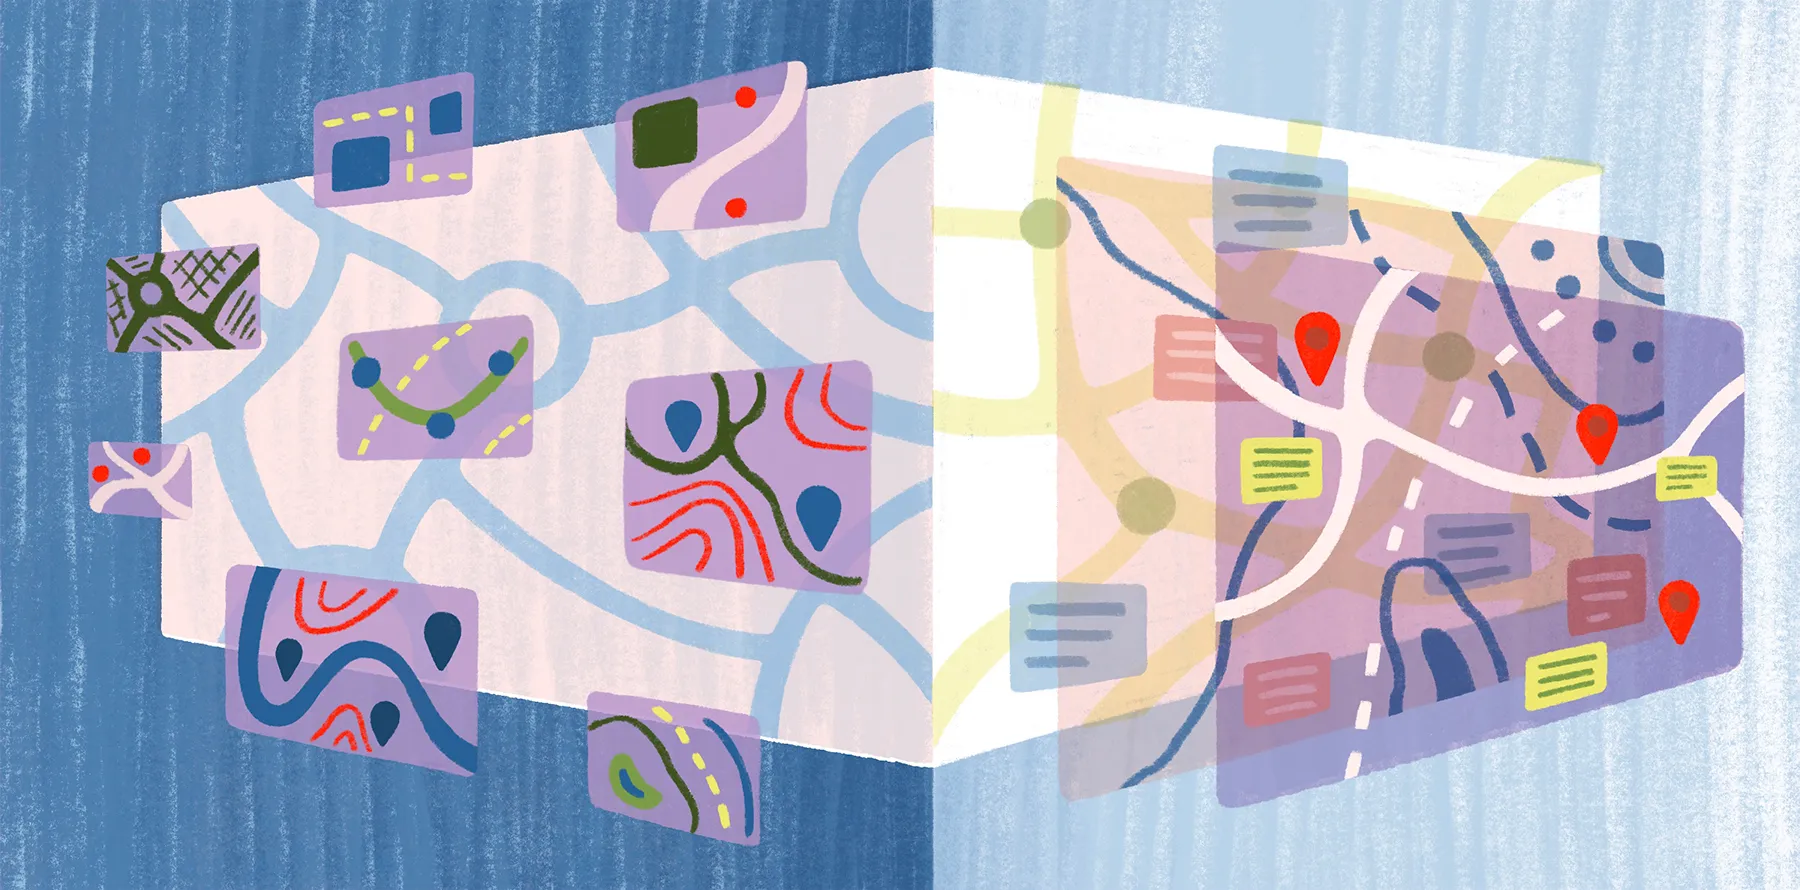
Overlay analysis
Overlay analysis stacks raster and vector data layers to reveal relationships. Picture an environmental manager layering zoning maps, wildlife habitats, and flood risk zones to find the safest location for new construction. Geographic information layered spatially highlights risks and opportunities.
Felt comes in handy here, too, helping teams analyze demographic datasets, infrastructure maps, and environmental imagery all in one place. That way, everyone gets a good look at how these factors overlap in real time.
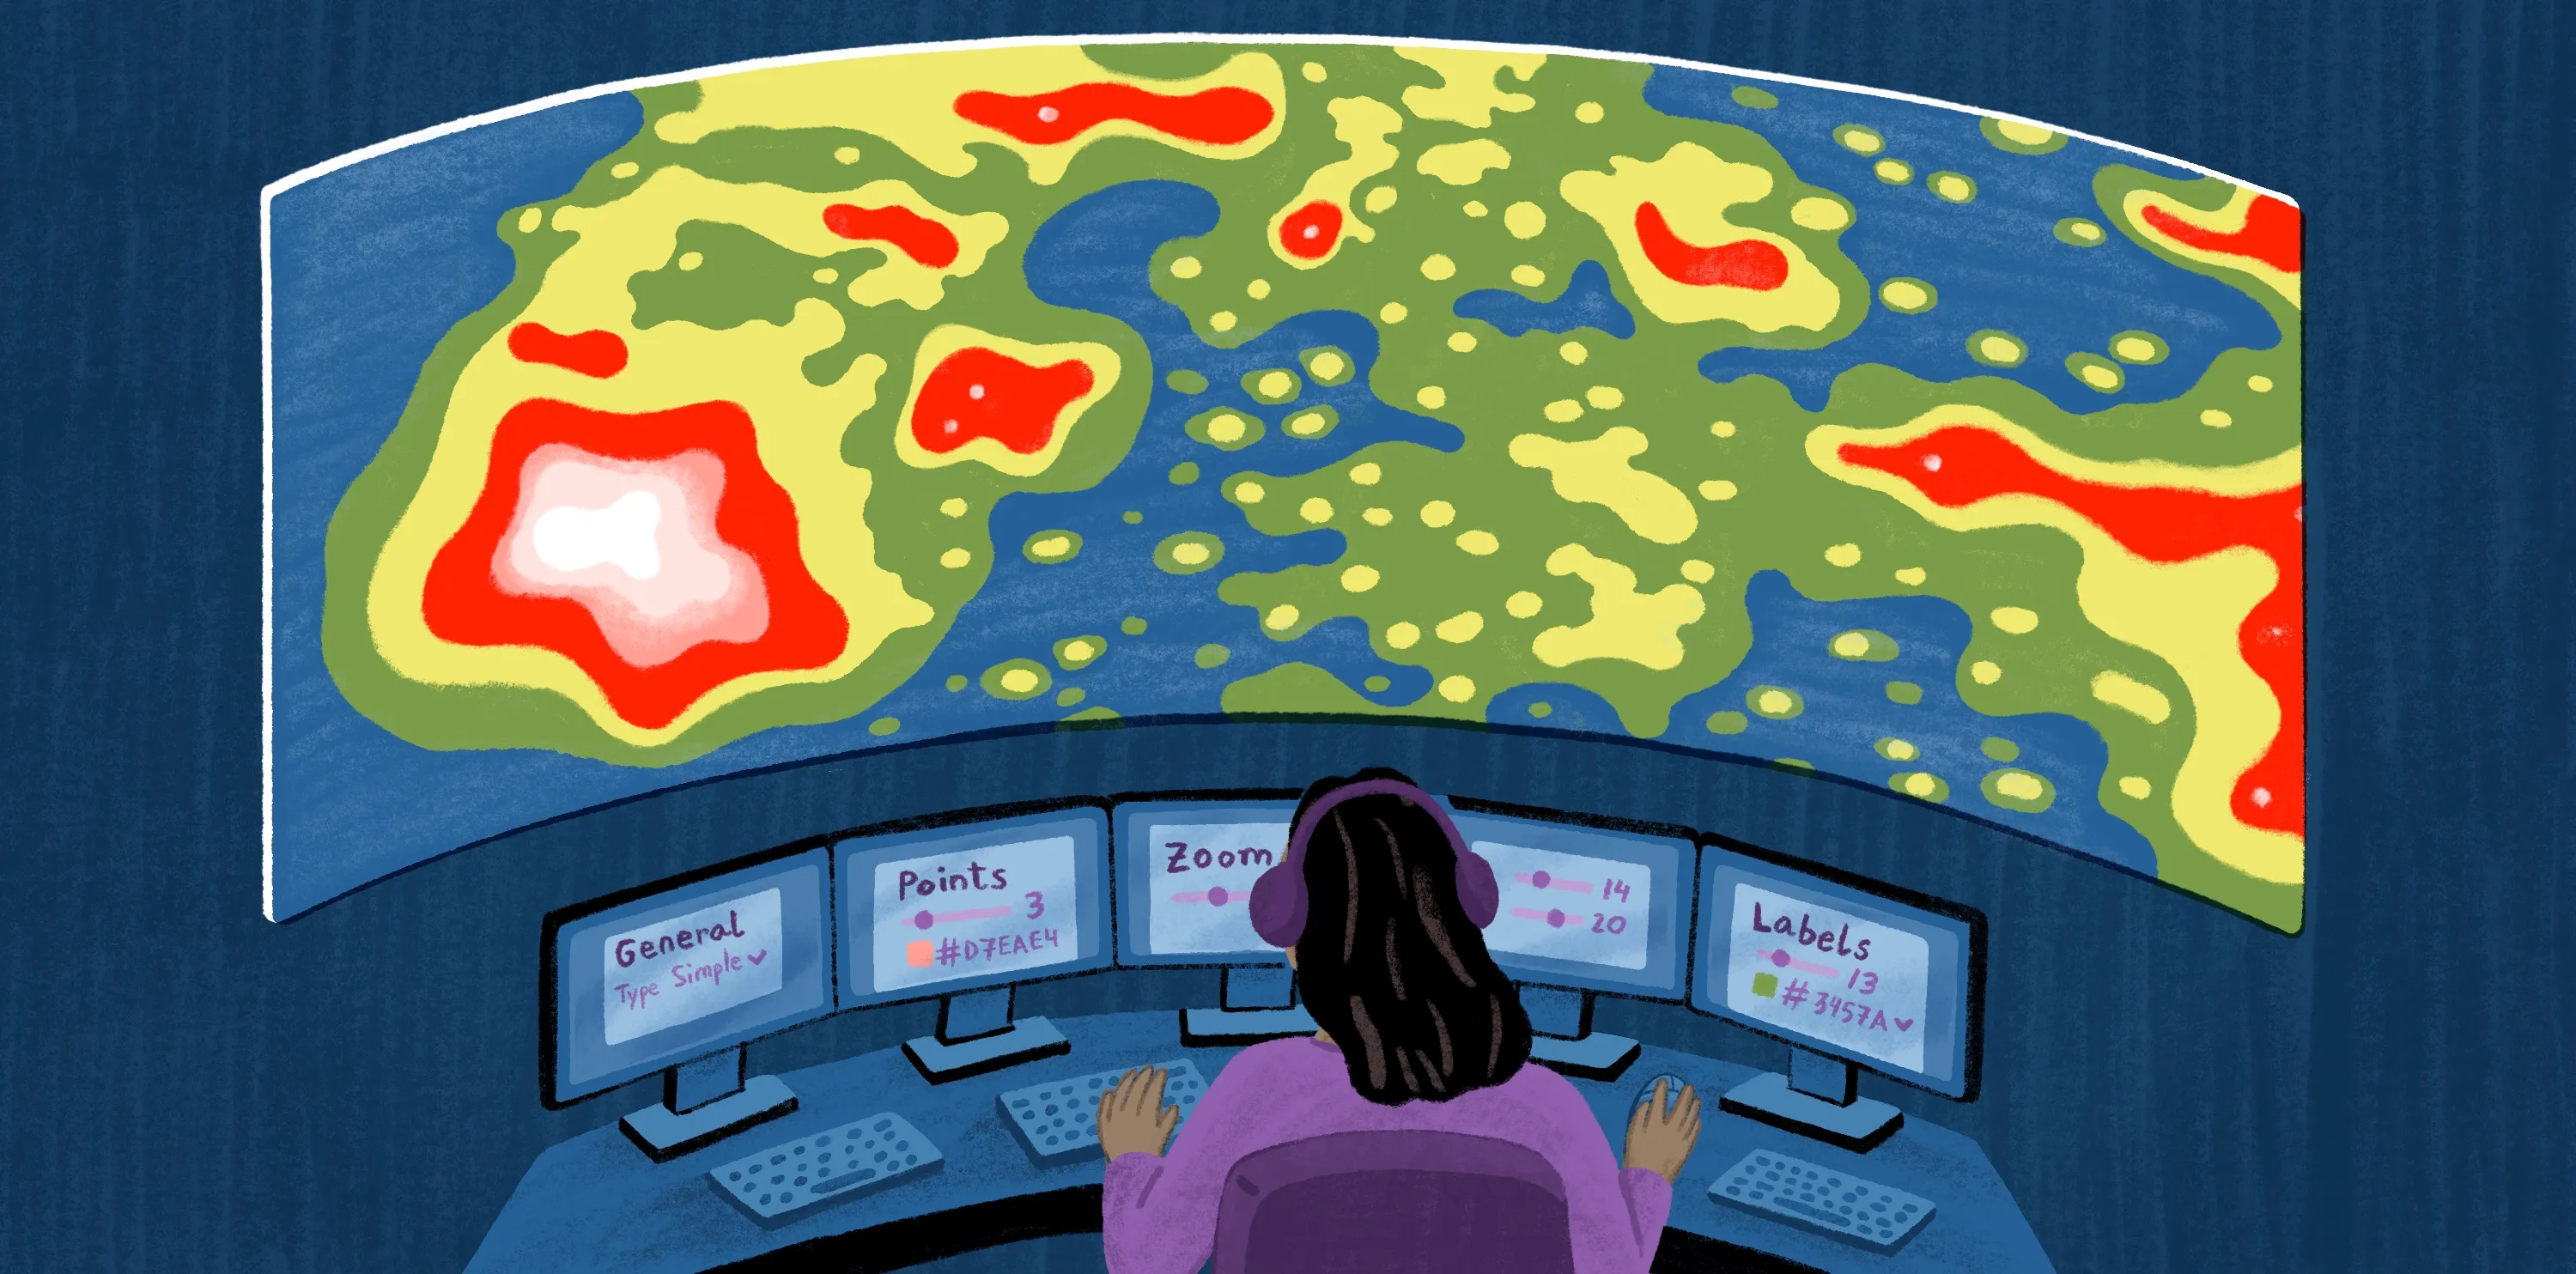
Hotspot and cluster analysis
Hotspot analysis pinpoints areas with much more — or less — activity than usual, while cluster analysis groups together similar features based on attributes like demographics and geography. These methods let public health officials monitor disease outbreaks and help retailers understand customer clustering patterns.
If there are missing details, teams can use spatial analysis statistics to fill in the blanks and track trends for a specific region. Whether you opt for traditional GIS or modern tools like Felt, mapping clusters helps you react faster to changing conditions.
Network analysis
Network analysis is often used in urban and transport planning to study flows across roads, pipelines, and other critical infrastructure. Emergency services use it to plan the quickest routes for ambulances, while utility companies analyze power and water systems for reliability.
By incorporating spatial data into their analysis, teams can simulate scenarios like travel times. They can then share these results in Felt to identify network bottlenecks and test possible solutions.
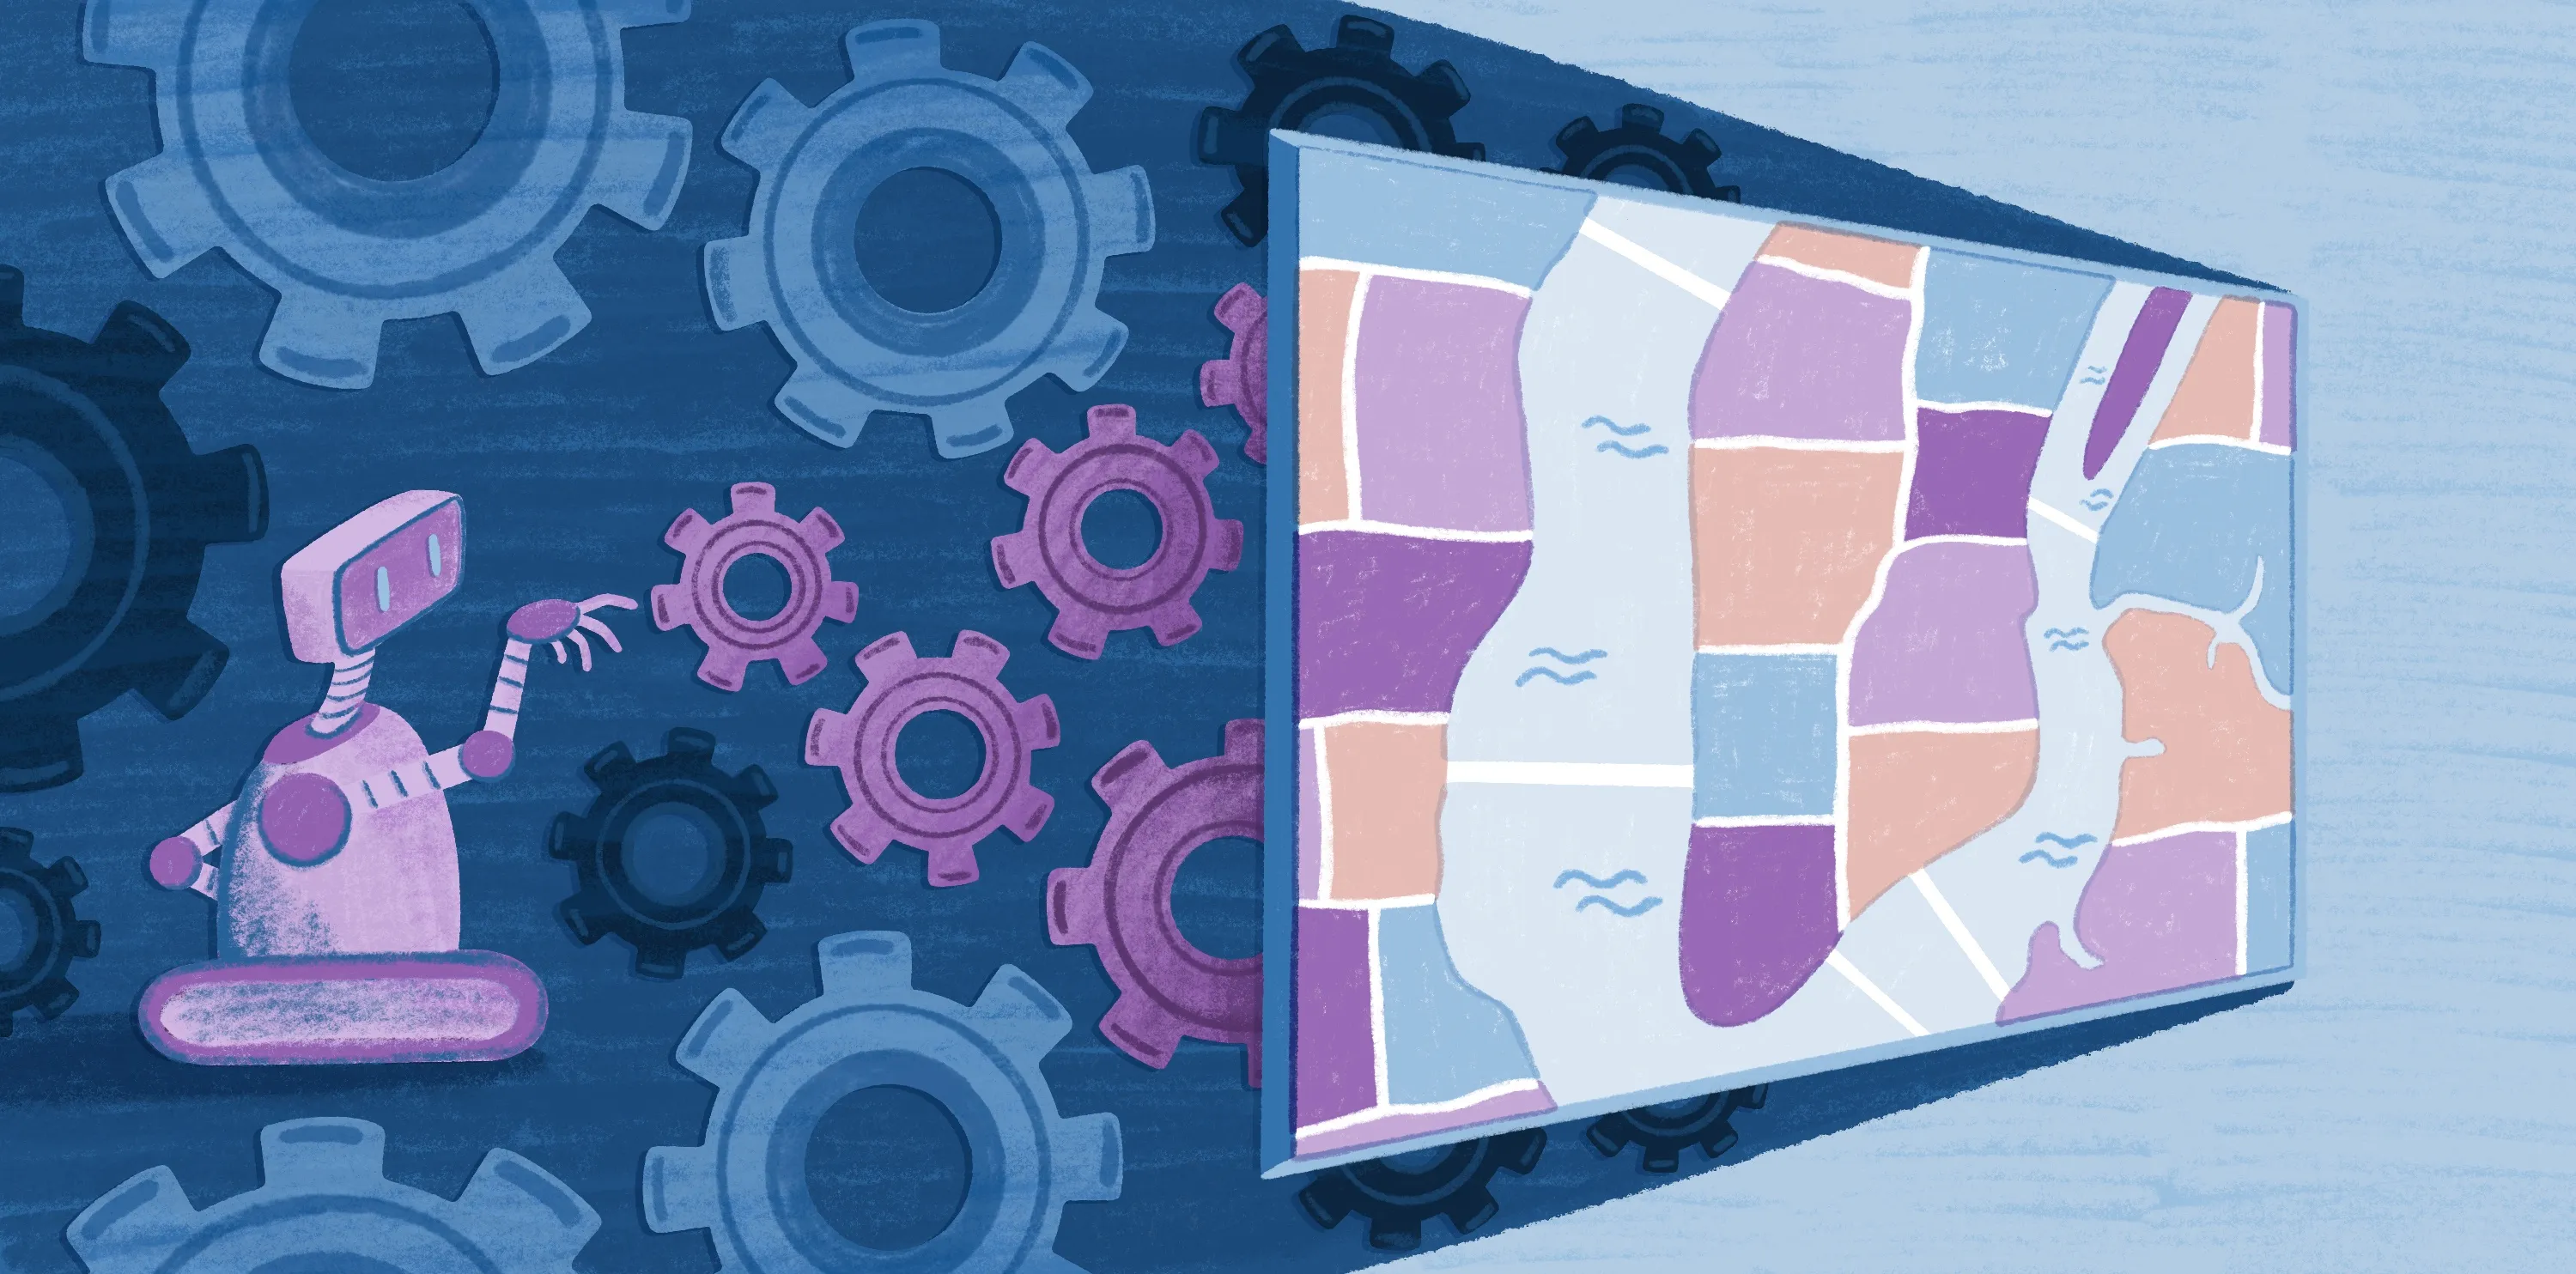
Surface and raster analysis
Surface and raster analysis focuses on continuous data — like elevation, temperature, and rainfall — spread across a region. Environmental scientists rely on both techniques to model landscapes and spot flood-prone zones.
Interpolation fills gaps between data points, smoothing out the map and revealing hidden spatial patterns. This is key when you don’t have readings for every location.
Teams who layer surfaces in Felt can visualize all their information at once and get a more accurate picture of what’s happening on the ground.
Why reproducible and collaborative workflows matter
Reproducible workflows make life a lot easier for spatial analysts, helping you repeat, verify, and update your work without starting from scratch. This consistency means you get results you can trust and lets teams quickly pick up where someone else left off.
Collaboration speeds up insights and discoveries, too. When teams share maps and tap into cloud-based GIS and remote sensing, everyone works with the same information — reducing delays and confusion. Plus, if you integrate different datasets with geostatistical tools, you start to see new spatial patterns that might have otherwise gone unnoticed.
Felt brings all of this together in one efficient, AI-native workspace. It puts spatial data and analysis tools right in your browser so you don’t have to juggle several programs.
The Felt AI platform also automates repetitive processes and lets stakeholders and decision-makers contribute in real time. Teams can layer maps, explore raster and vector datasets, and analyze spatial patterns without requiring specialized software.
Make reproducible spatial analysis effortless with Felt AI
Felt simplifies spatial and geospatial analysis. From data prep to visualization, it streamlines the entire process, letting teams focus on decision-making. Here are some of the tasks you can do in Felt:
- Automate complex geospatial workflows to save time and reduce errors.
- Overlay multiple datasets for richer, more meaningful findings.
- Share analyses instantly with colleagues and external stakeholders.
Discover how Felt turns spatial data into actionable insights and improves collaboration across projects and industries.
FAQ
How does spatial analysis support decision-making?
Spatial analysis lets you uncover the real story hidden in your data, like where traffic consistently slows down or which areas are prone to flooding. With these types of insight, decision-makers can act with confidence to allocate resources and address problems before they escalate.
Can non-GIS experts perform spatial analysis?
You don’t need to be a GIS expert to get value from spatial data. With tools like Felt AI, anyone can map, layer, and dig into the details using a simple, intuitive interface. If you know a bit about geography and you’re willing to experiment with Felt’s platform, you can pull out insights that make a difference for your team.
What are the main types of spatial analysis?
Some of the main types of spatial analysis include:
- Proximity analysis
- Overlay analysis
- Hotspot analysis
- Network analysis
- Surface analysis
Each one helps highlight patterns and trends in your geographic data so you can make smarter choices for any project.
Compare Felt using AI


.jpg)