At its core, geospatial analysis adds “where” and “when” context to raw spatial data. This context transforms information into actionable insights. Tools like geographic information systems (GIS) capture and clarify key data points. These insights inform everything from urban planning and disaster response to public health.
Read on to learn what geospatial analysis is, how it works, and why it’s indispensable.
What is geospatial analysis?
The definition of geospatial analysis centers on examining data based on time and location on the Earth’s surface. Unlike general data analysis, it adds a geographic layer that reveals patterns and relationships invisible without spatial context.
This approach uses cartography, spatial modeling, and GIS to interpret location-based records and imagery. With spatial analysis, organizations move beyond raw figures to see how events unfold across space and time.
Whether tracking environmental changes or managing public health concerns, geospatial analytics offer in-depth insights that traditional methods alone often miss.
What are the benefits of geospatial analysis?
What makes geospatial analysis so essential is that it brings clarity to complex data. By highlighting where and when events occur, teams gain a clear view of patterns and trends that influence real-world outcomes.
Here are the top benefits of using geospatial analysis:
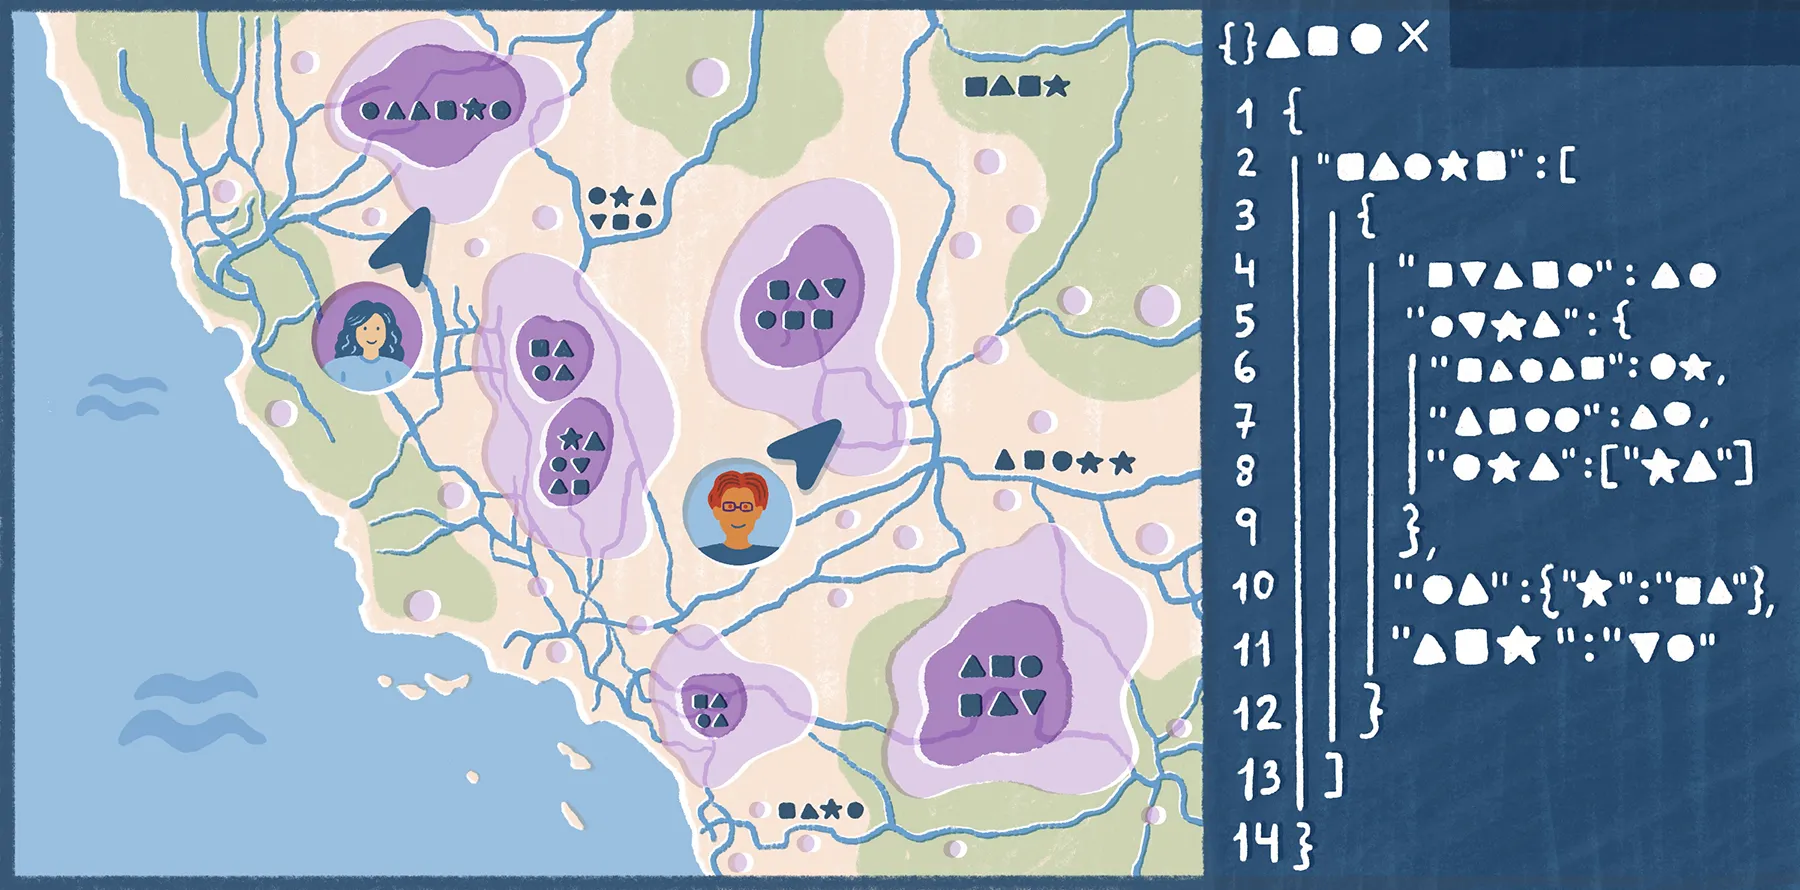
- Better decision-making: Geospatial visualization tools — such as maps and GIS — give decision-makers and policymakers the insight to make accurate, evidence-based decisions.
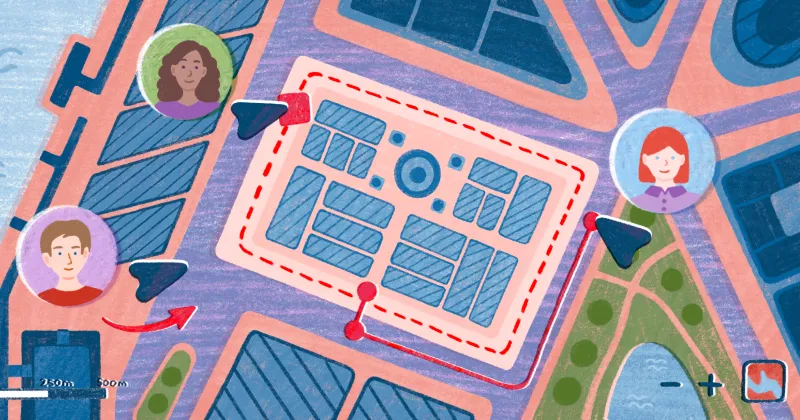
- Improved efficiency: Geospatial data shows you where resources are needed most. From optimizing delivery routes to designing a city’s infrastructure, spatial analysis helps organizations reduce waste, save time, and maximize their impact.
- Enhanced risk management: Using spatial analysis, you can monitor risks in real time. Whether mapping natural disasters or assessing business vulnerabilities, spatial data is a powerful tool for proactive planning and rapid response times.
- Stronger communication and collaboration: Visualizing geospatial data through maps and imagery makes complex information easy to share and understand. This clarity strengthens collaboration, as everyone works from the same insights and priorities.
- Innovation and discovery: Combining spatial data with advanced modeling and computational methods helps spot patterns that inspire new ideas and innovation.
Key concepts in geospatial analysis
Geospatial analysis relies on several key concepts, spanning data types, visualization, and GIS software. Here’s a look at the elements that help teams address challenges and solve complex problems at scale.
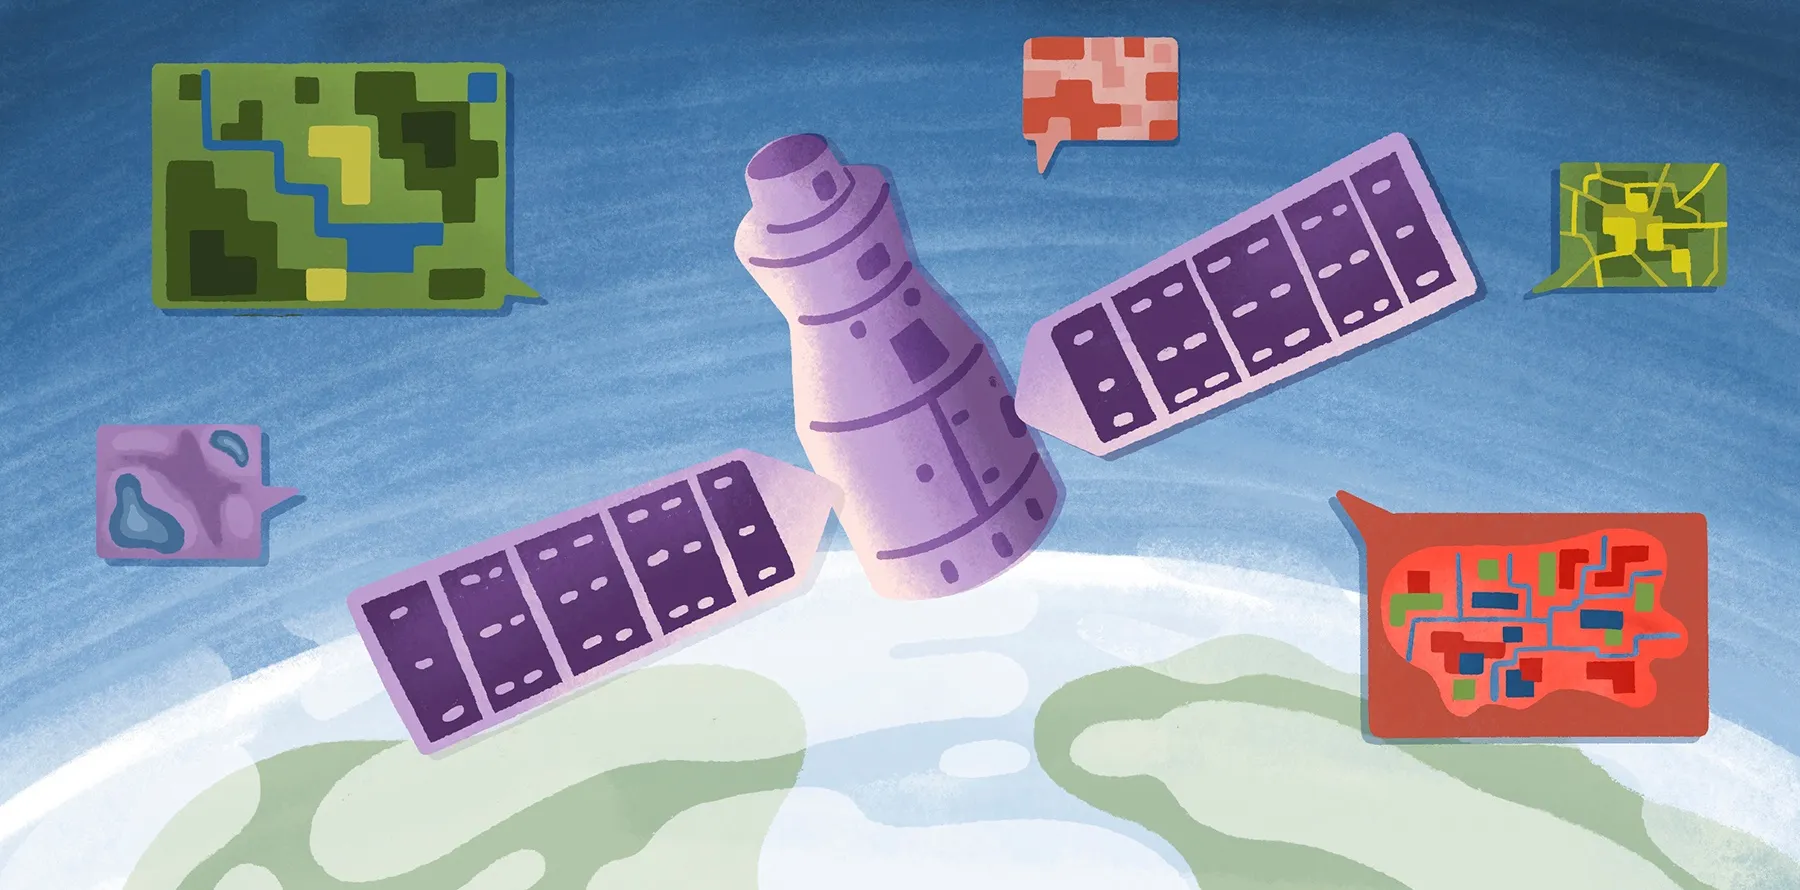
Geospatial data (vector, raster, real-time)
Geospatial data comes in several formats. Vector data represents discrete features such as roads, boundaries, and points of interest. Raster data captures continuous information like elevation, temperature, and satellite imagery.
Real-time geospatial data from sensors and mobile devices help teams respond quickly to shifting conditions. For example, cities use live traffic feeds to adjust stoplight timing and ease congestion.
Spatial patterns and relationships
Geospatial analysis highlights patterns not visible from raw data alone. These include clustering, distribution, and proximity between locations.
A retail business analyzing spatial data may find that customers within a certain radius of a store are more likely to buy their products. Alternatively, public health agencies might use clustering to track disease outbreaks in specific neighborhoods.
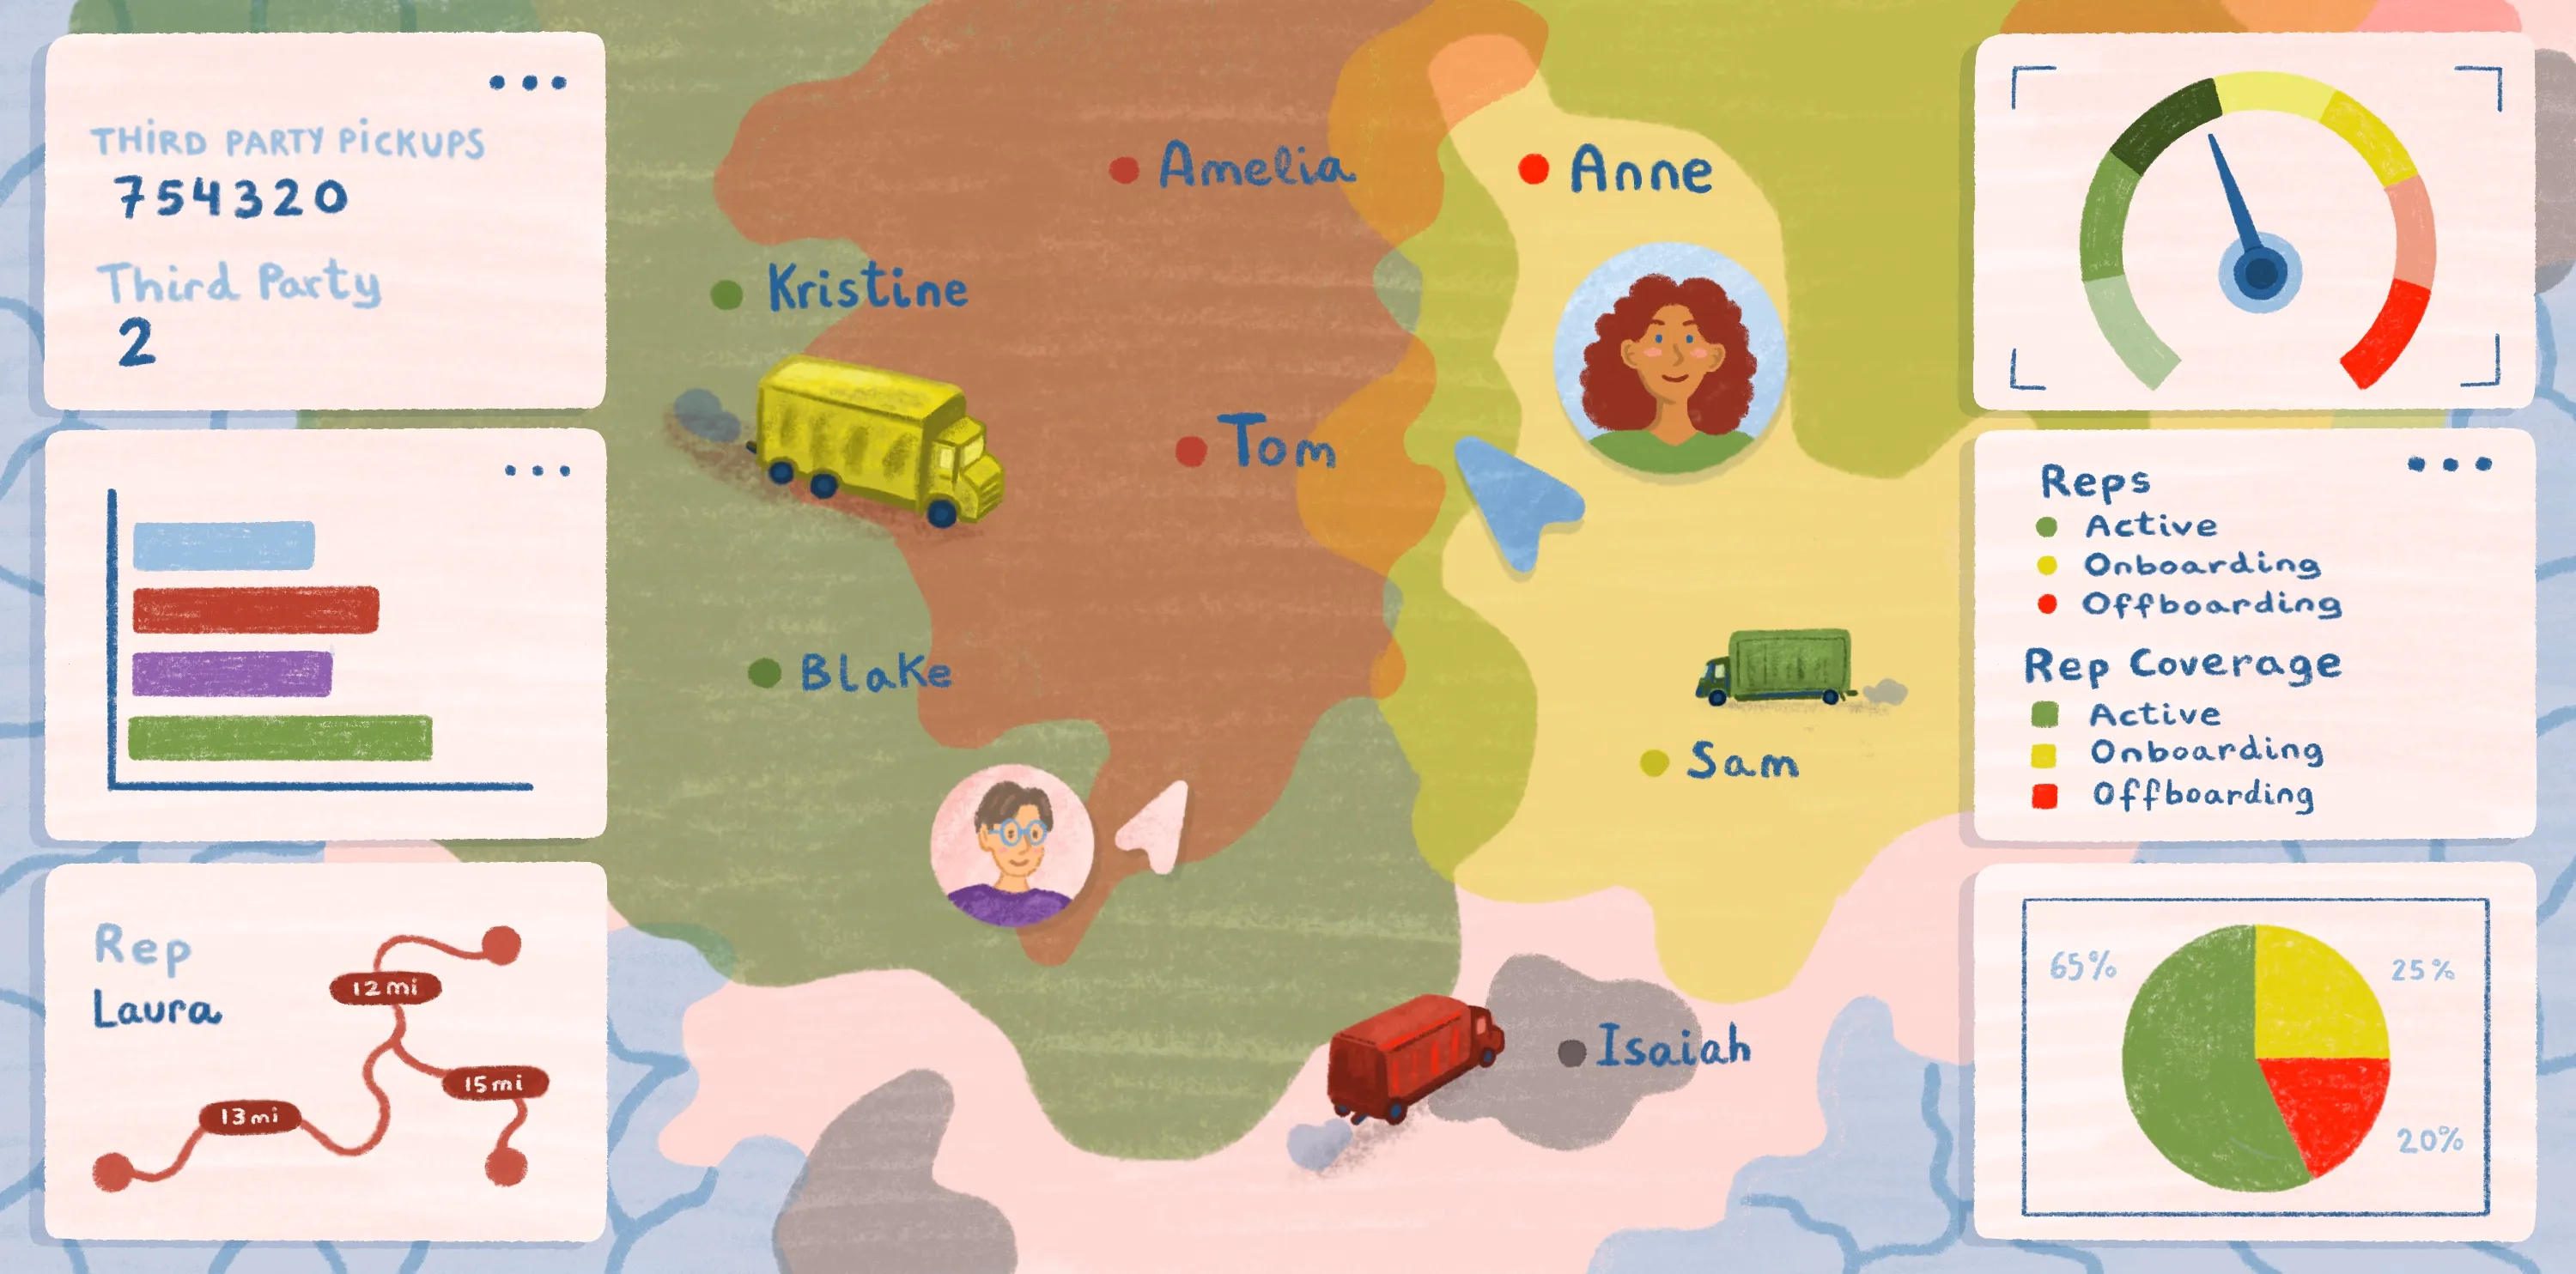
Visualization and dashboards
Geospatial mapping, charts, and interactive dashboards make trends easy to spot and act on.
Teams display remote sensory imaging on dashboards to monitor deforestation. Businesses may use customer location maps to plan store openings. Pairing visual tools with spatial analysis helps decision-makers detect trends and act confidently.
Geographic information systems
GIS software has the tools and features to collect, manage, and analyze spatial data. It combines vector details, raster imagery, and tabular information to provide a comprehensive view of geographic phenomena.
One spatial analysis example is how emergency responders use GIS to overlay flood maps with population data to prioritize evacuation zones. Without GIS, this process is much slower, more fragmented, and far less actionable.
Applications of geospatial analysis
Geospatial analysis supports decisions across countless industries. It links spatial data to real-world challenges. From climate science to commerce, many organizations use geographic insights, satellite imagery, and spatial visualization to direct next steps. Here are key fields and sectors where spatial insights drive smarter decisions.
Urban and regional planning
Spatial data is essential to guide development and management of cities. City and government officials analyze population density, transportation networks, and land use to make informed decisions about where to build.
GIS tools help identify underdeveloped areas in need of new public transit routes. This improves urban mobility, reduces congestion, and promotes equitable distribution of resources.
Disaster management
With the help of geospatial analysis, agencies can prepare for and respond to crises. Satellite imagery tracks natural disasters like hurricanes, wildfires, and floods in real time.
Emergency responders can analyze satellite images for wind patterns to predict how a wildfire will spread. Similarly, geospatial visualization tools show which roads are accessible after earthquakes to guide relief efforts.
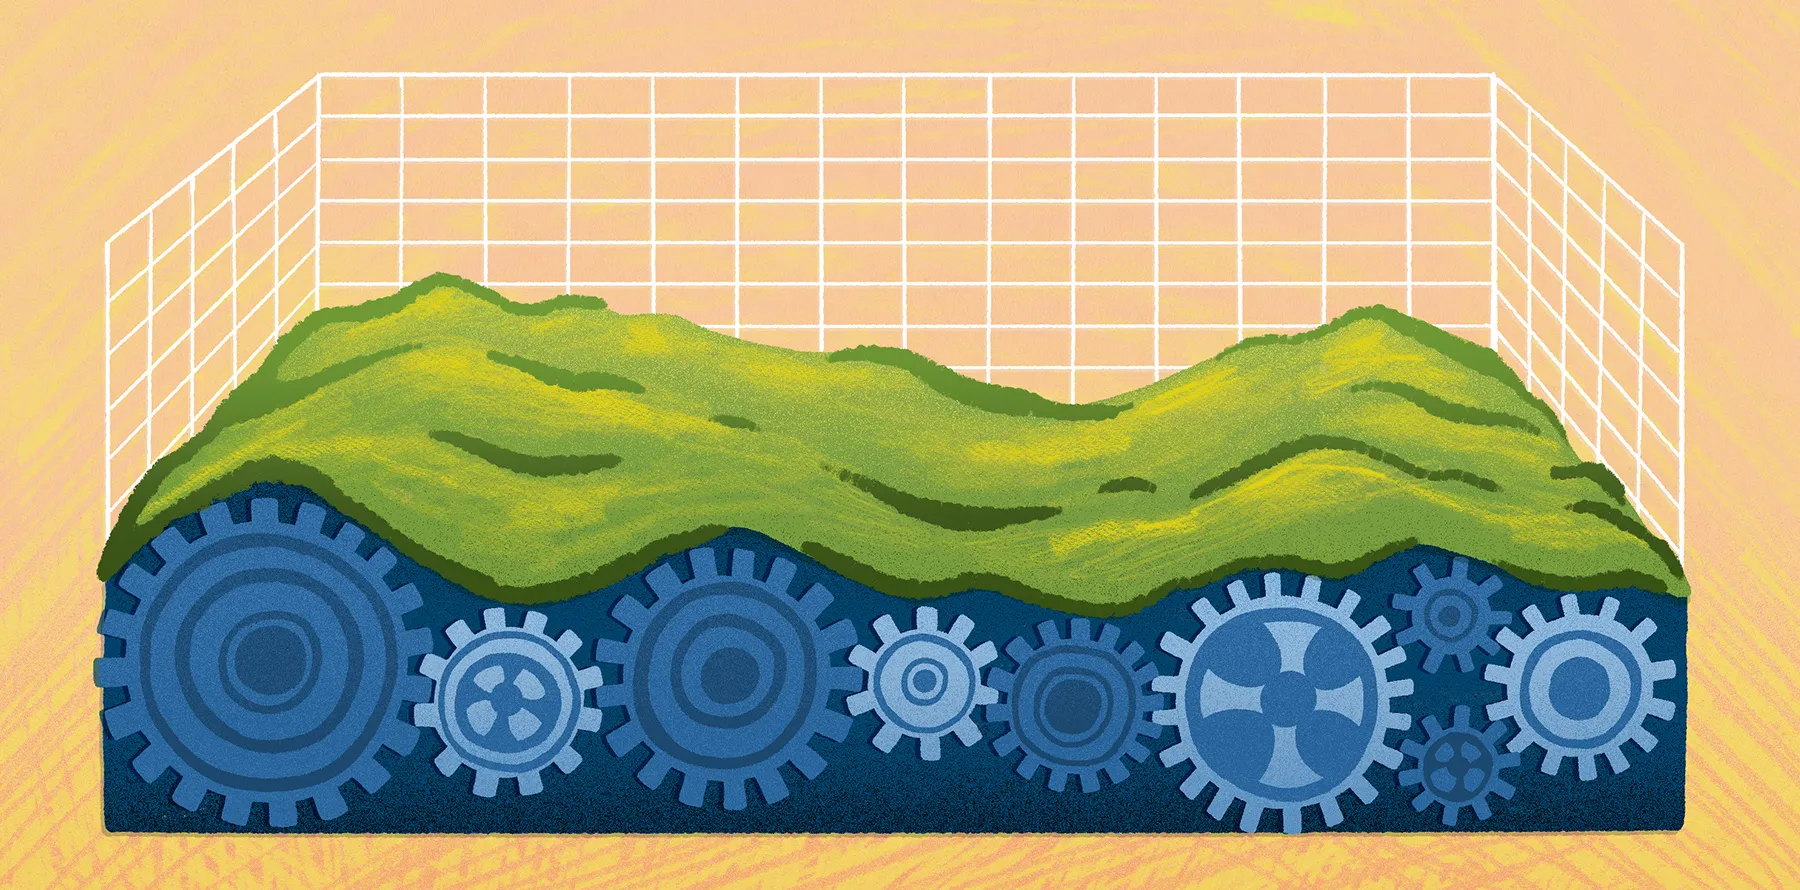
Environmental management and climate research
Researchers use spatial data from satellites and remote sensing technologies to monitor deforestation, melting ice sheets, and changing weather patterns over time. Satellite imagery also shows how urban expansion contributes to the loss of wetlands, which play a vital role in biodiversity and flood protection.
Visualizing these geographic changes supports evidence-based policies, conservation strategies, and global climate research.
Public health and epidemiology
Geospatial analysis helps public health experts pinpoint and respond to disease patterns. By combining infection-rate data with geographic and demographic details, researchers detect clusters and track how diseases spread.
For example, public health teams use satellite imagery to assess environmental risks, like standing water, which contributes to mosquito-borne diseases. And during the COVID-19 pandemic, geospatial visualization tools mapped outbreaks in real time. These insights guided decisions about lockdowns and vaccine distribution.
Insurance and risk assessment
Insurers use geospatial analysis to quantify risks and establish policies. With GIS tools, they can evaluate property exposure to infrastructure hazards like extreme weather events and soil instability.
For example, GIS models reveal how rising sea levels may impact coastal real estate properties. This geographic perspective helps insurers calculate premiums and encourages risk-mitigation strategies.
Business and market intelligence
Geospatial analysis transforms how businesses understand their operations. Instead of relying solely on traditional sales or demographic data, companies use spatial data to detect trends and gain deeper insights.
A retailer could use GIS visualization to spot areas underserved by grocery stores, while logistics firms might analyze traffic and delivery routes. Even satellite imagery plays a role, tracking the movement of goods across different regions.
These insights help businesses make data-driven decisions and stay agile in shifting markets.
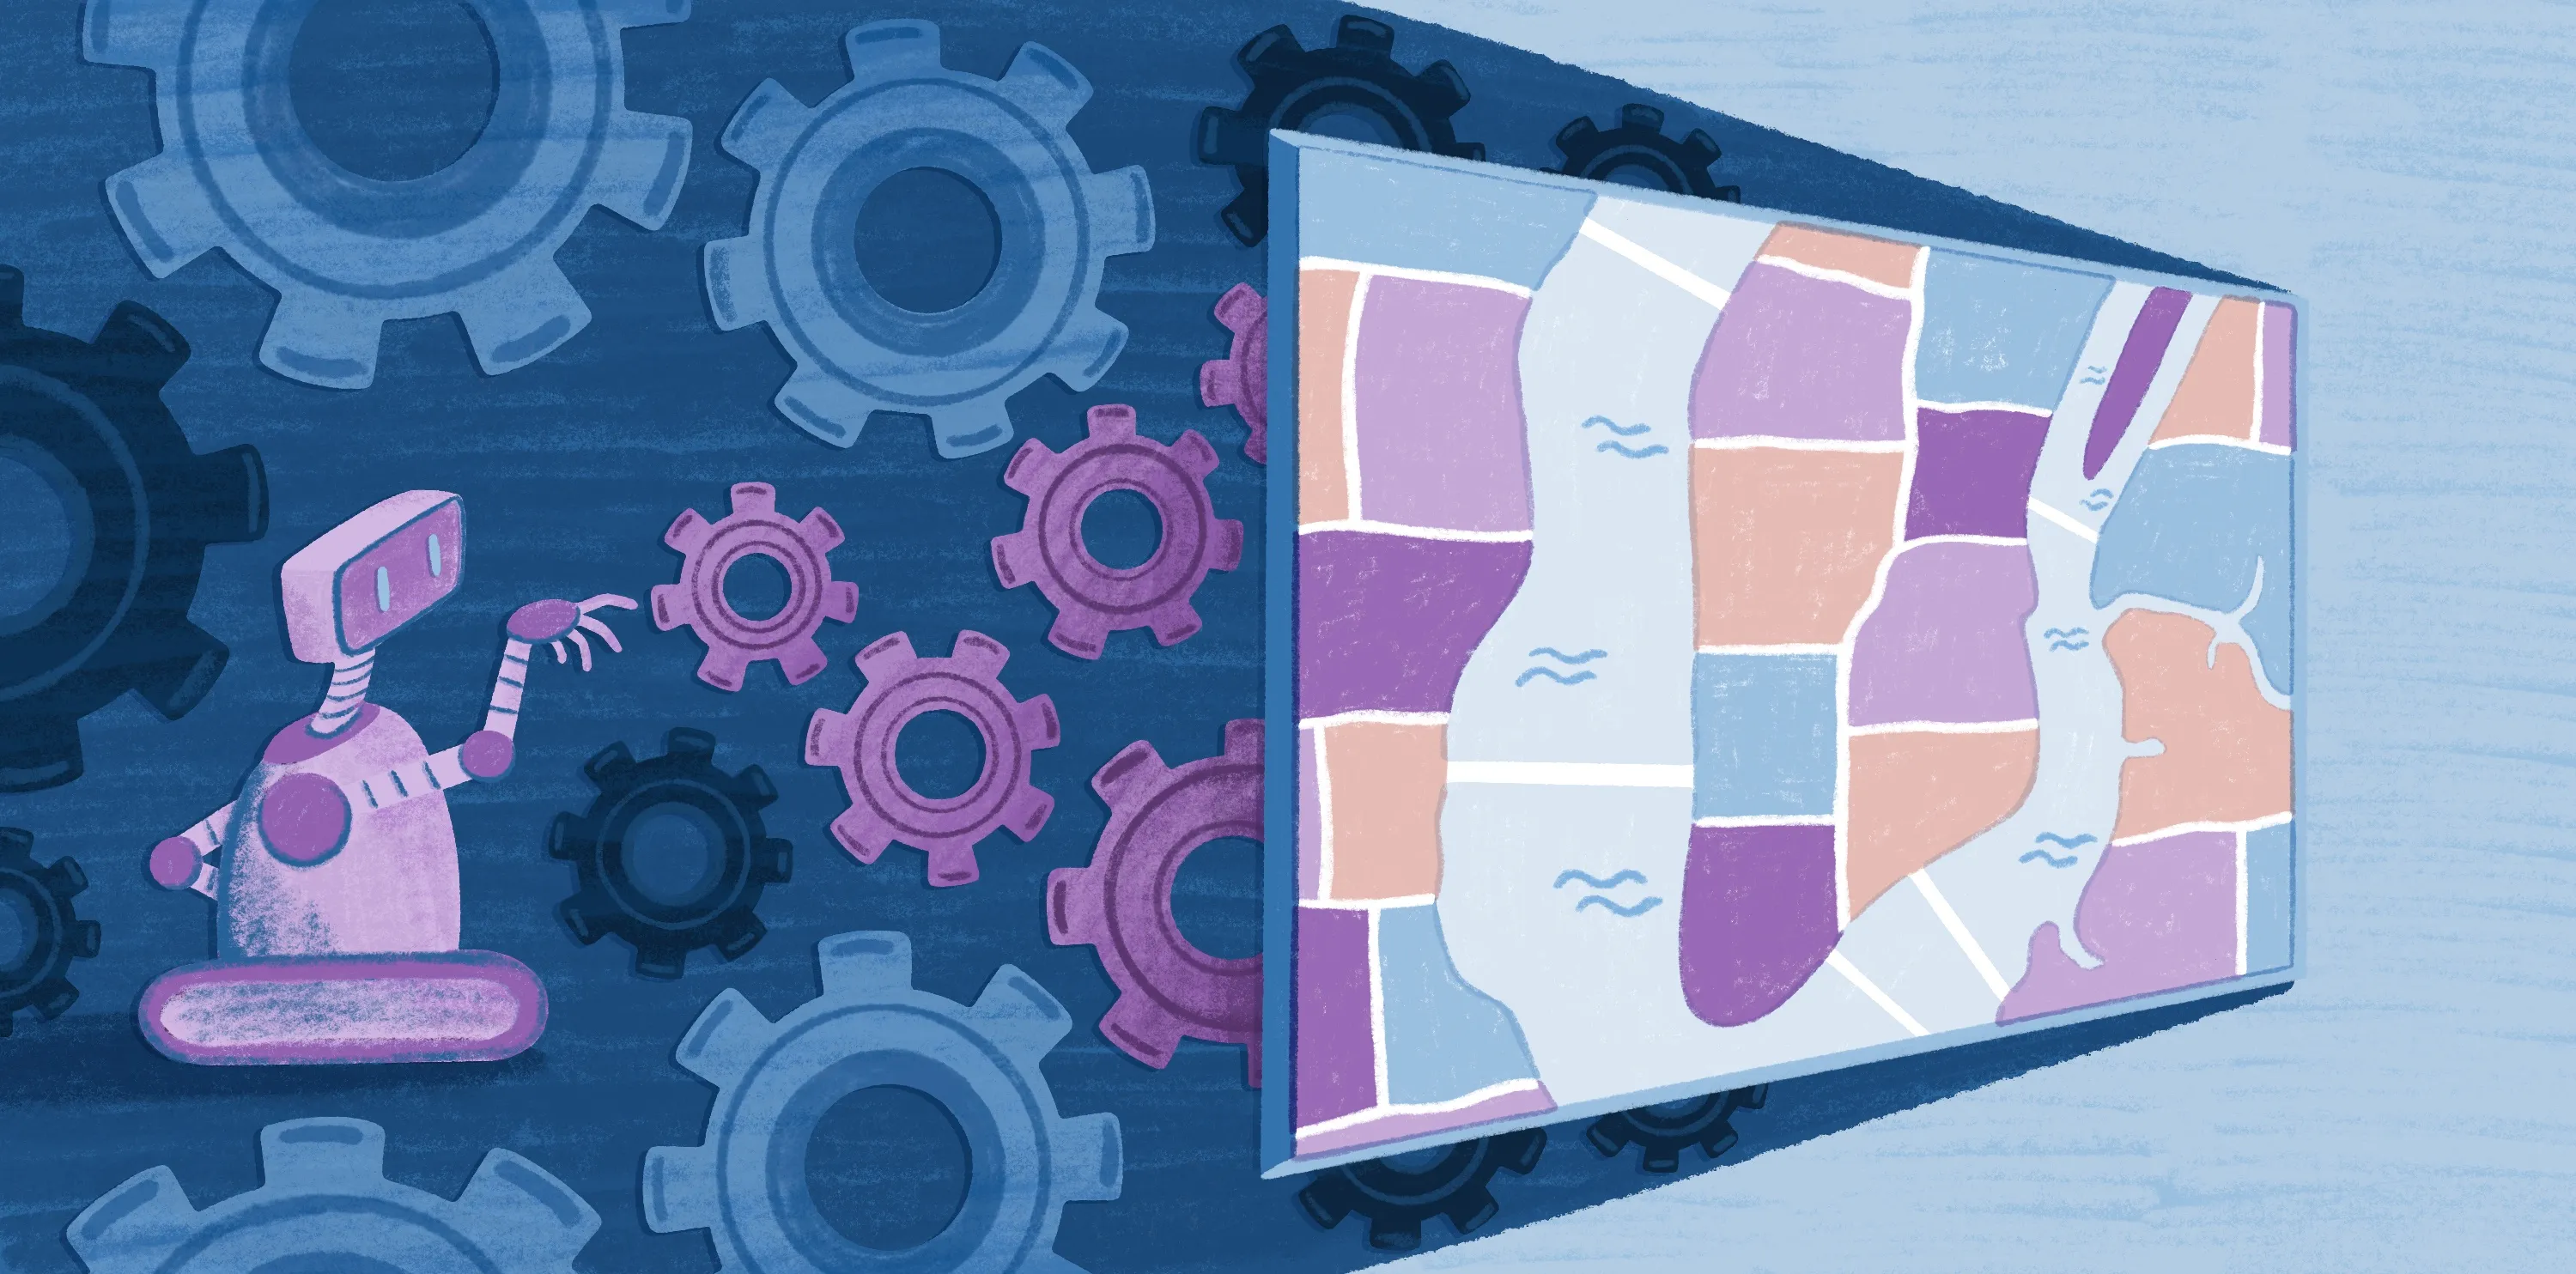
Experience the Future of Geospatial Analysis With Felt
Turning raw spatial data into meaningful insights requires a combination of tools and expertise. But with the right platform, teams work faster and collaborate more effectively.
Felt is an AI-native and cloud-based Web GIS that makes it easy to build and deploy modern spatial tools. It lets teams create interactive map dashboards in seconds — no coding required. Whether you’re working with thousands or millions of data points, Felt delivers unmatched performance and clarity so you can explore spatial data without compromise.
Discover the speed, simplicity, and power of modern Web GIS firsthand. Try Felt today or book a demo to see your team move from data to decisions.
FAQ
What types of data are used in geospatial analysis?
Geospatial analysis uses vector and raster data. Vector data includes points, lines, and polygons, often in formats such as .shp, .geojson or .kmz. Raster data covers continuous surfaces like elevation and temperature.
Geospatial analysis also relies on real-time data from GPS devices and satellite imagery. This combination helps track changes across time and space.
What is an example of geospatial analysis?
A practical geospatial analysis example is tracking disease outbreaks in public health. Analysts examine spatial data on demographics and infection rates to help identify patterns and guide interventions.
What are the methods for geospatial data processing?
Geospatial data processing involves cleaning, integrating, and visualizing datasets. Using GIS and spatial analysis software, teams can interpret vector and raster data and apply techniques like overlay and proximity analysis to extract actionable insights.
Compare Felt using AI