New Workflows Unlocked: Introducing Spatial Filters with CSV Export
As we wrap up 2024, we’re excited to announce a powerful new addition to Felt’s enterprise dashboards: Spatial Filters.

As we wrap up 2024, we’re excited to announce a powerful new addition to Felt’s enterprise dashboards: Spatial Filters.
This feature, combined with our new CSV export capability, transforms how teams interact with location-based data and makes spatial analysis accessible across your organization.
Breaking Down Data Silos with Spatial Intelligence
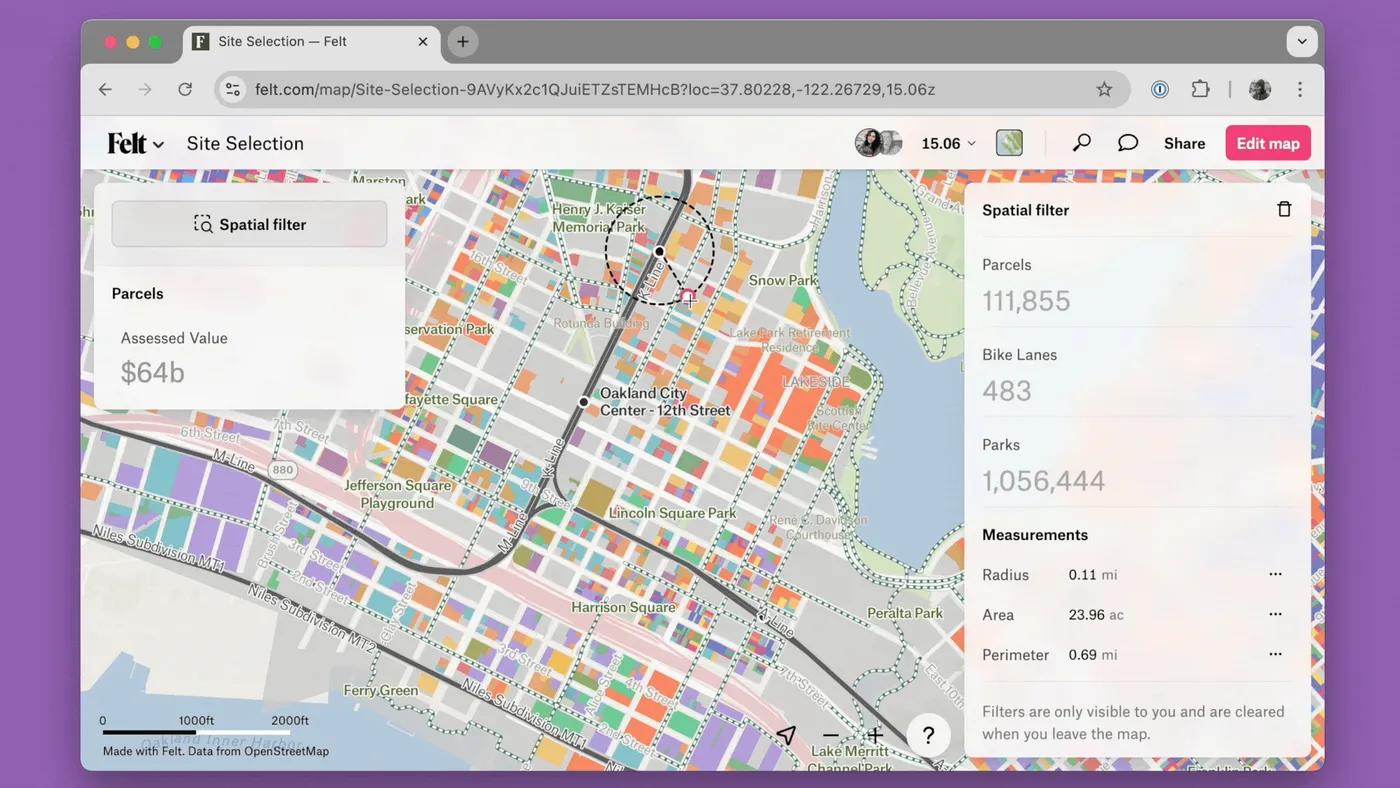
Since launching Felt dashboards, we’ve seen organizations transform how they share and analyze location data. Teams that once struggled with siloed geospatial information are now making data-driven decisions with ease. Today, we’re taking this capability to the next level by introducing Spatial Filters – a feature that puts the power of custom, on-the-fly queries directly in the hands of your dashboard viewers.
What Are Spatial Filters?
Spatial Filters allow dashboard viewers to create custom geometries – circles or polygons – and instantly filter map data based on these spatial boundaries. Think of it as drawing a shape on your map and getting immediate insights about everything within that area.
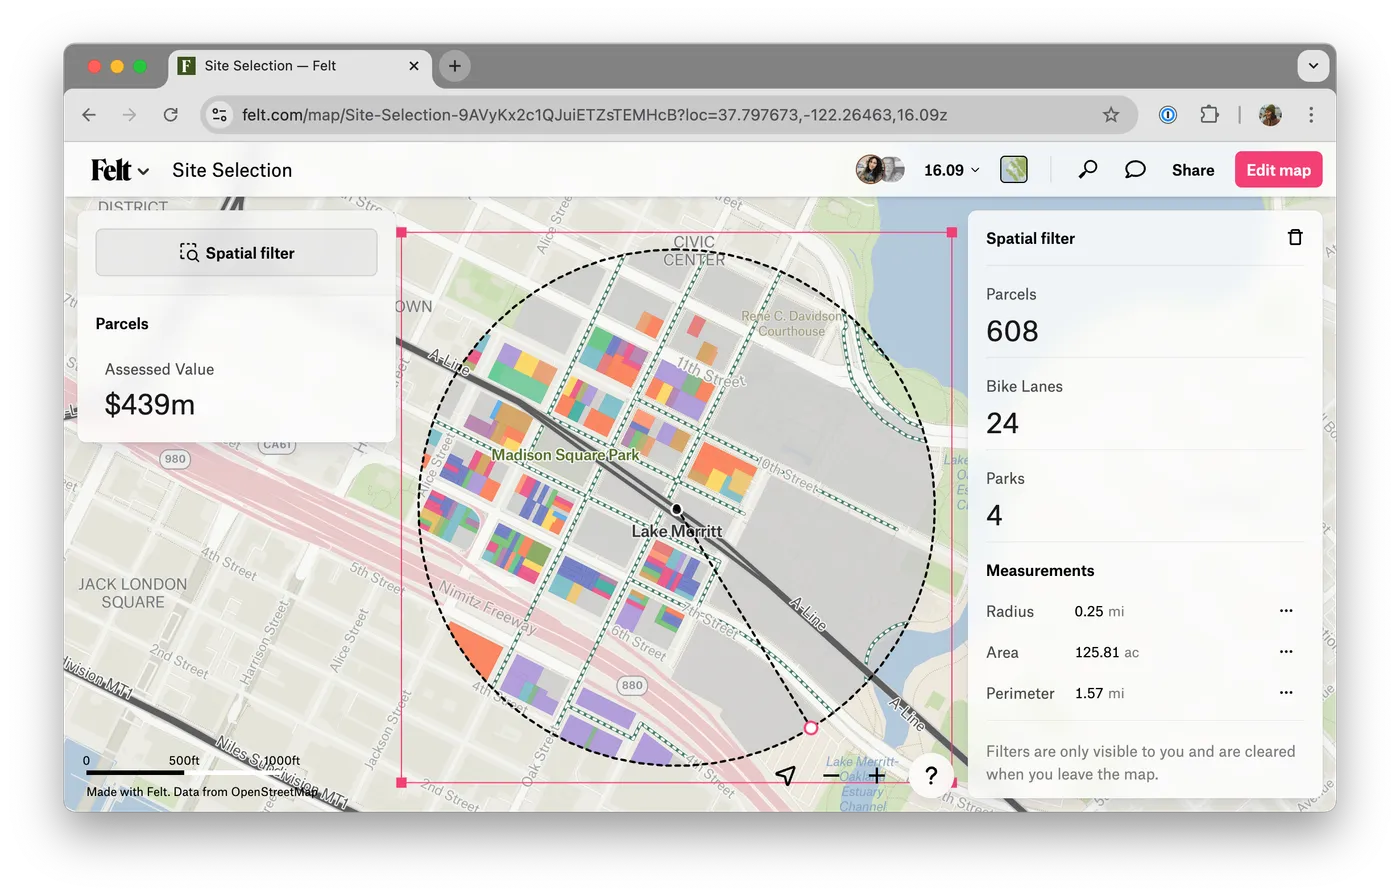
The applications of Spatial Filters span across industries and use cases. Here are just a few examples of questions you can configure for instant response:
- Renewable Energy: Is there sufficient capacity in existing infrastructure to support new development?
- Sales Operations: How many potential customers live within proximity of our new store locations?
- Emergency Response: How many homes fall within a hurricane’s projected path?
Export and Act
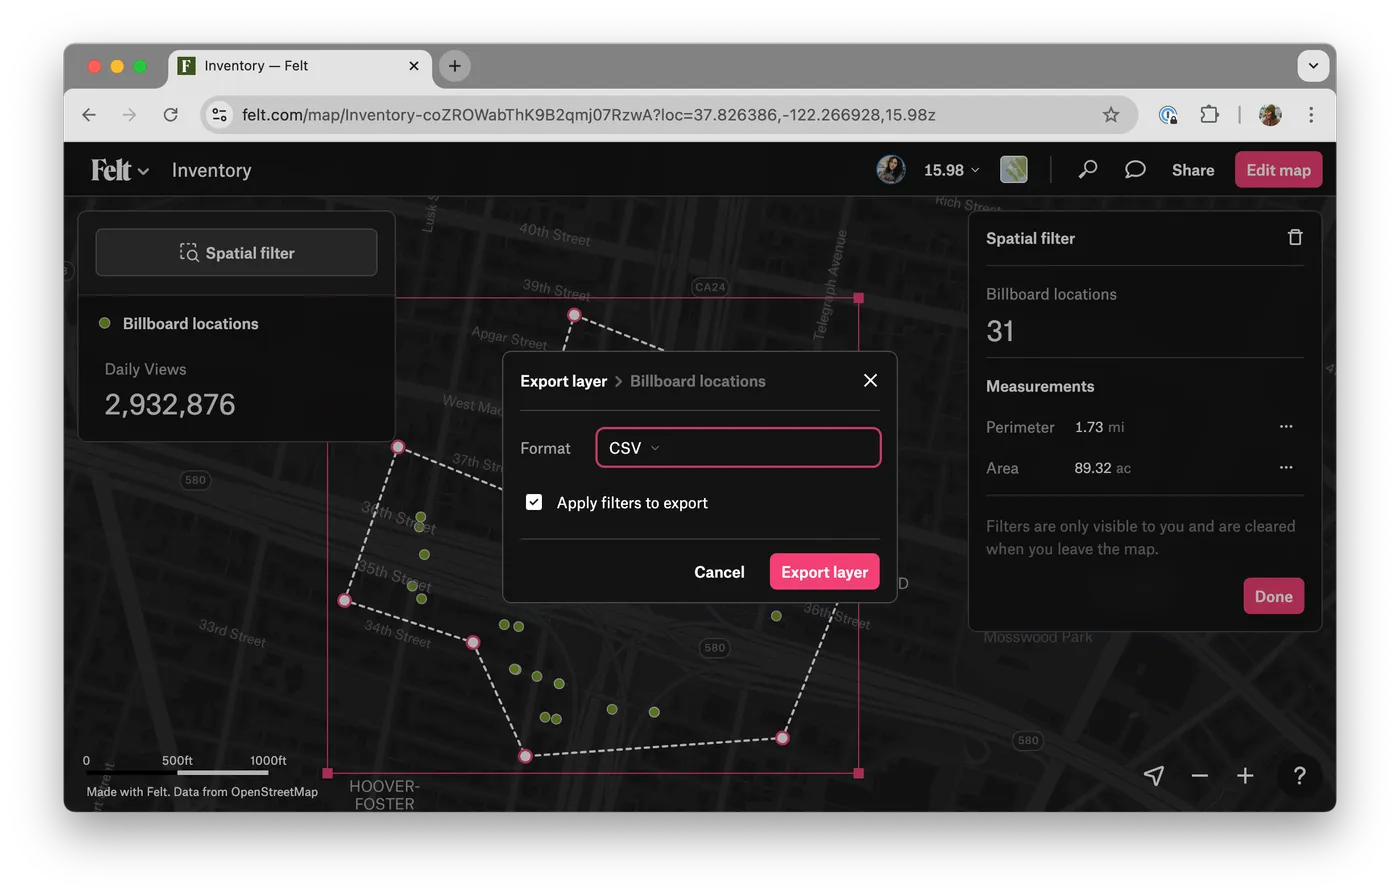
What makes this release especially powerful is its pairing with our new CSV export functionality, allowing users to take away just the data need. Users can now:
- Define their spatial area of interest
- Filter relevant data points
- Export the results for use in other business tools, like Excel or Google Sheets
This workflow opens up endless possibilities, giving technical teams their time back: operations teams can quickly export and analyze revenue data for select stores, sales teams can pull lists of addresses take action without involving additional support – the options are truly endless. If you’ve been waiting for a comprehensive GIS platform your teams will actually adopt, start building with Felt dashboards today. Reach out to our experts to get started with a pilot.
Wrapping up 2024
Looking back on this year’s launches, we are proud of the what we’ve unlocked for our users:
- 9 new dashboard components for building self-serve viewer experiences including statistic, bar chart, histogram, filter, timeseries, find, measure and now spatial filter!
- 8 new native database connectors including Postgres, Snowflake, Databricks, Redshift, BigQuery, ESRI, STAC and Microsoft SQL Server, so you’re always connected to your source of truth.
- An intuitive Javascript SDK that makes building custom spatial applications fast and easy.
- A REST API with a Python SDK and webhooks to ensure you can automate any of your spatial workflows and maximize your efficiency.
- More powerful ways to view your largest datasets with native H3 visualization support and and data filters.
- More ways to integrate Felt into your workflows with data export format support and our PowerBI integration.
- Enterprise grade security and five regional hosting options to always keep your data safe.
The sum of these parts is thousands of hours saved from the slog of coordination through PDF maps, complex internal DIY engineering efforts, and struggling to load large datasets in the browser. We are so grateful you are on this journey with us and we can’t wait to share what we’ve got coming for you in 2025!