DTM vs. DEM vs. DSM: Differences for terrain analysis
Elevation data supports everything from flood modeling and infrastructure planning to environmental monitoring and land analysis. Every slope calculation and site assessment depends on accurate representations of the earth’s surface.
Terms like digital terrain model (DTM), digital elevation model (DEM), and digital surface model (DSM) often get used interchangeably to describe elevation. But they serve different roles in mapping and analysis. Choosing the wrong dataset can lead to flawed analysis and compromise your results, especially in high-stakes engineering and environmental projects.
Let’s break down the practical differences in the DTM vs. DEM debate — and where DSM fits in.
What do DTM, DEM, and DSM stand for in GIS?
The acronyms DTM, DEM, and DSM refer to types of elevation models, each representing a different version of the earth’s surface. All three store elevation values in digital format — typically as raster grids — but vary in what surface they depict.
DTM: Digital Terrain Model
An easy DTM definition is a 2.5D representation of the bare-earth surface. It removes buildings, vegetation, and other above-ground features to model the true ground elevation. Teams can create DTMs by filtering raw elevation data to strip away surface objects and provide a clean topographic view for precise mapping.
Common data sources:
- LiDAR surveys with ground-classified points
- LiDAR-derived DEMs that have been filtered
- Government or public elevation datasets
- High-resolution aerial or satellite data
Because LiDAR captures detailed vertical information, it provides the most accurate base for generating a digital terrain model.
Resolutions and formats:
- GeoTIFF
- Cloud-optimized GeoTIFFs (COGs)
- Other GIS-compatible grid formats
Regional DTMs may offer 5–30 meter resolution, but engineering-grade LiDAR-derived DTMs can reach sub-meter accuracy.
Example use cases:
- Large-scale terrain visualization without surface clutter
- Regional hydrology and watershed monitoring
- Baseline elevation mapping for infrastructure planning
- Grading, cut-and-fill, and earthwork calculations
DEM: Digital Elevation Model
In GIS, DEM stands for digital elevation model and refers to a raster grid that stores elevation data for geospatial analysis. Depending on the data provider, DEM may describe bare-earth ground elevation or serve as a general label for any elevation raster dataset, including surface models.
Because the definition varies by source, it’s important to review the metadata and confirm what it actually represents.
Common data sources:
- Satellite imagery missions
- LiDAR-derived DEMs
- National mapping agencies
- Public global elevation datasets
DEMs are widely available and often the starting point for GIS-based terrain analysis.
Resolutions and formats:
- GeoTIFF
- COGs
- Other GIS-compatible grid formats
Resolution ranges from coarse global datasets (30 meters or more) to high-resolution regional datasets under one meter.
Example use cases:
- Large-scale terrain visualization
- Regional hydrology analysis
- Slope, aspect, and contour generation
- Baseline elevation mapping in GIS workflows
DSM: Digital Surface Model
A DSM represents the topmost surface, including buildings, vegetation, and bridges. When comparing DTM vs. DSM, the key difference is that a DSM keeps above-ground features, showing what sits on top of the terrain. A DTM only shows the bare earth.
Common creation methods:
- LiDAR data that includes first-return points
- Photogrammetry from aerial imagery
- Drone-based surveys
- Stereo satellite imagery
Since DSMs capture surface height, they play an important role in vertical and 3D analysis.
Resolutions and formats:
- GeoTIFF
- COGs
- Other GIS-compatible grid formats
Like other elevation models, DSM resolution depends on the data source. Drone and aerial LiDAR surveys can produce sub-meter DSMs, though satellite-based DSMs offer coarser grid spacing.
Example use cases:
- Urban planning and 3D city modeling
- Line-of-sight and visibility analysis
- Solar potential and rooftop assessments
- Tree canopy height studies
Why elevation models matter in spatial analysis
Elevation models are foundational to spatial analysis, with a range of real-world applications.
- Hydrology: DTMs allow hydrologists to map how rivers flow and where water drains. DEMs give a broader view of the landscape so it’s easier to see watershed boundaries and water movement patterns.
- Infrastructure: Engineers rely on terrain models to map roads, railways, and pipelines. Accurate elevation helps steer clear of dangerous spots prone to landslides and sinking ground.
- Land-use: By analyzing elevation and vegetation, land managers can find areas at risk of soil erosion or deforestation and make better decisions for conservation.
- Climate: High-resolution terrain data is a game-changer for predicting flash floods and rainfall runoff. Analysts use this information to map risks such as avalanche zones.
Using the wrong model can lead to inaccurate results. For example, using a surface-level DSM instead of a filtered DTM can overestimate terrain heights due to vegetation or buildings. These seemingly small inaccuracies can snowball into major mistakes:
- Flood risk miscalculations can endanger communities and result in regulatory violations.
- Slope errors can increase construction costs or trigger landslides in hilly regions.
- Urban planning oversights can create issues with drainage or building placement.
That’s why carefully selecting a terrain model makes all the difference in delivering reliable project outcomes.
DTM vs. DEM vs. DSM: Side-by-side comparison
People use DEM as a catch-all term, but the difference between a DEM vs. DSM — or a DEM vs. DTM — can impact your analysis. Here’s a look at when you should use one over the others.
How the choice affects your analysis
The correct elevation model ensures your analysis reflects real-world conditions and prevents small data mismatches from turning into costly, large-scale mistakes:
- If you use a generic DEM without confirming it represents bare terrain or surface elevation, you risk introducing subtle but significant errors in slope, watershed, or infrastructure design calculations.
- If you use a DSM for flood modeling, trees and buildings may artificially block or redirect water flow, producing misleading runoff results.
- If you use a DTM for urban planning visibility studies, you’ll miss rooftops and vegetation, which are essential for accurate line-of-sight.
Working with elevation models in modern GIS platforms
Working with a DTM or DEM sounds straightforward until you try to process one at scale. Elevation datasets are often large raster files that demand significant storage, memory, and processing power. High-resolution terrain data can slow rendering and overwhelm desktop machines, forcing teams to clip or downsample files to keep projects moving.
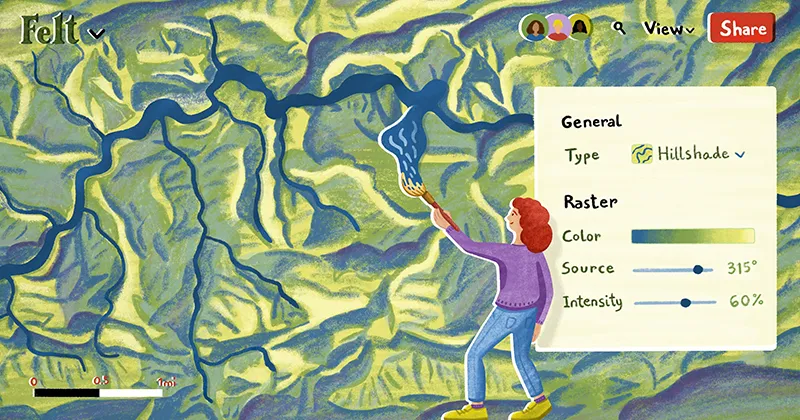
Modern GIS platforms are changing all that. Many teams now use cloud-native systems that stream elevation data directly in the browser. These platforms handle heavy raster processing on remote infrastructure, which makes it easier to visualize terrain, generate contours, and analyze slope without tying up a local machine.
Browser-based workflows matter because elevation projects rarely stay small. By moving storage and processing to the cloud, teams can reduce hardware constraints and scale their GIS workflows more easily.
Collaboration is especially important as elevation data moves beyond traditional GIS departments. Urban planners, engineers, and environmental analysts increasingly rely on terrain insights — even if they’re not GIS specialists. Today’s platforms make it simple to bring these stakeholders into the process through shared dashboards and web maps. This shift lowers the technical barrier and speeds decision making.
How Felt helps teams analyze elevation data faster
DEMs and DTMs aren’t competing formats. They’re tools built for different analytical goals. Picking the right elevation model is only part of the job. The harder part is working with large raster files that slow down desktops, require constant clipping, and make collaboration difficult. Felt is designed to remove those bottlenecks.
Felt’s AI-native platform helps both GIS professionals and non-specialists work with DTM, DEM, and DSM data in the same shared environment. You can upload and visualize elevation layers and style them in a way that fits your project. The platform streams COGS directly from sources like Amazon S3 so teams can work with multi-gigabyte elevation datasets in the browser without the performance issues that come with local processing. There’s no downsampling, no waiting for tiles to render, and no breaking files into pieces.
Large elevation files shouldn't slow your team down. Felt streams raster data in the browser, so engineers, planners, and analysts can work with DTMs and DEMs together, without the hardware constraints. Learn how Felt can bring your terrain data into a shared, cloud-native environment.
Compare Felt using AI