Understanding raster vs. vector maps and when to use each
When you work with geographic information systems (GIS) or any kind of spatial data, you have a choice between raster vs. vector maps. Both formats are important building blocks in digital mapping, but they store information in different ways.
Raster data uses pixels, much like digital photos, while vector data relies on points, lines, and polygons to define geographic features. Because of their differences, each format shines in certain ways and struggles in others.
Read on to learn more about how raster and vector data work, along with their strengths and limitations, so you can pick the right format for your next project.
What are raster and vector maps?
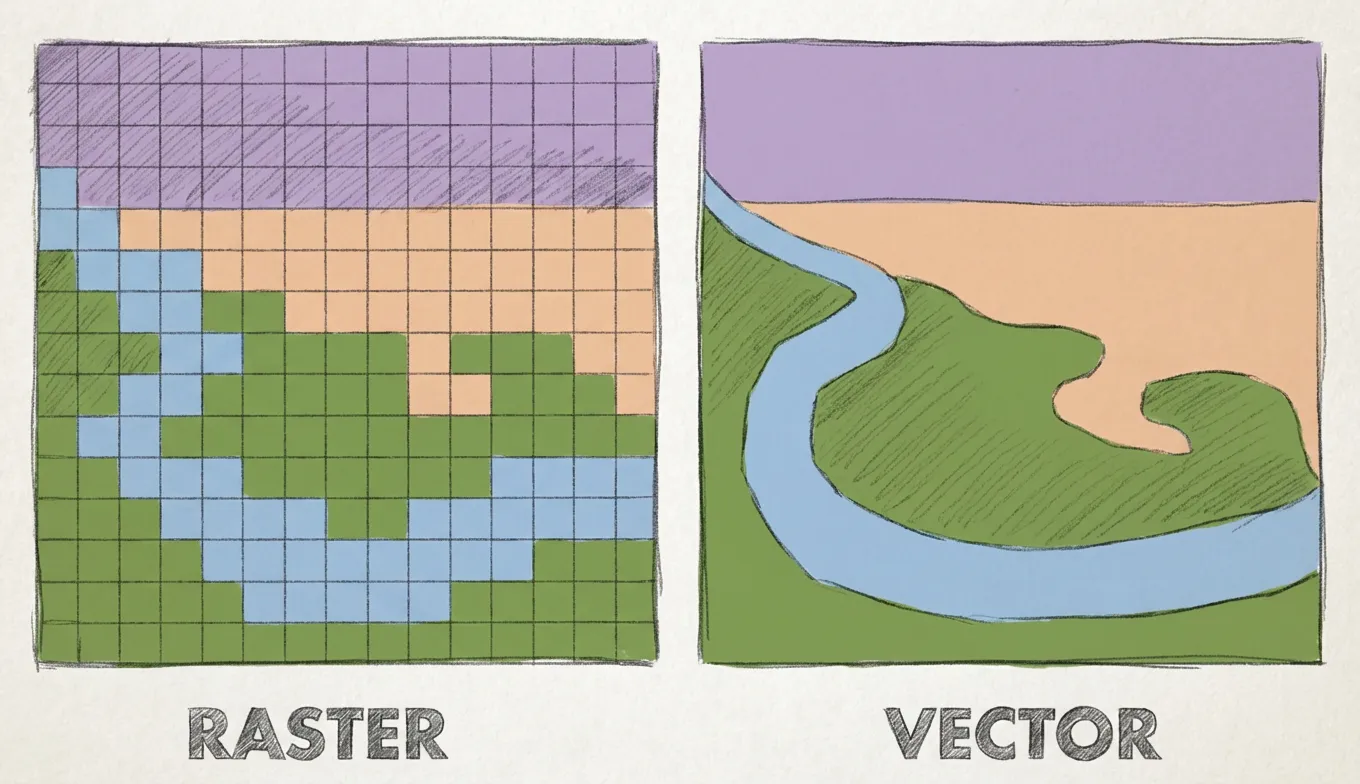
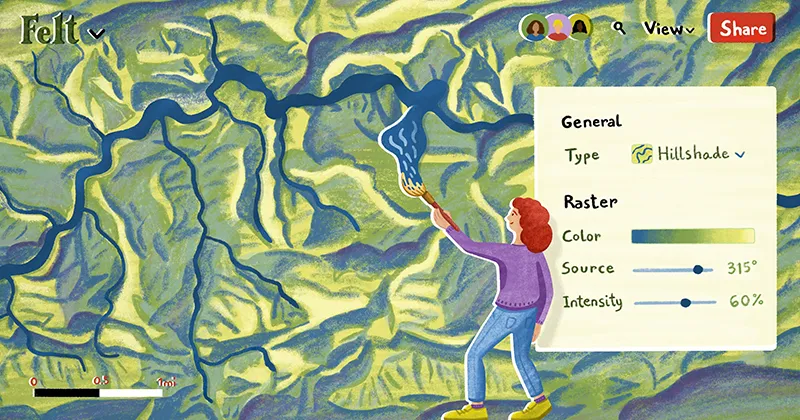
Raster maps display spatial data on a pixelated grid. Each pixel stores one value and shows gradual shifts across smooth surfaces, including elevation, temperature, and satellite imagery.
Vector maps use points, lines, and polygons to represent well-defined spatial features. Points identify landmarks, lines map roads or rivers, and polygons outline parcels or city blocks. This structure makes vector data precise and highly flexible.
Felt takes your raster and vector infrastructure experience a step further. You can stream, index, and analyze datasets directly from Amazon S3, Google Cloud, or Microsoft Azure buckets. With Felt, it’s easy to manage and explore large files without slowing down your workflow.
Comparing raster and vector map performance
When it comes to raster vs. vector performance in GIS, both have pros and cons to consider.
Raster maps
Raster map performance usually depends on pixel size and resolution. Higher-resolution raster data produces smoother and more detailed surfaces — but it comes at a cost. Since every pixel stores a value, more pixels mean larger file sizes. This can slow GIS processing when using multiple raster layers or running map algebra.
On the plus side, raster data works great for tracking gradual changes across landscapes. That’s why it’s often used for environmental analysis when modeling flood risk, mapping vegetation cover, or observing temperature shifts.
Keep in mind, zooming in too far with raster mapping reveals blocky or pixelated edges instead of a smooth surface, making your map less precise.
Vector maps
Vector mapping makes it easy to reveal discrete geographic features. Because of their mathematical structure, these maps stay sharp and precise at any zoom level. It’s also highly interactive. You can click on a road, building, or parcel and instantly view its attributes.
A common example comes from city planning, where teams look at building footprints and infrastructure layouts to make smarter design decisions. Although large datasets can get heavy and slow down processing and visualization, vector data remains flexible and reliable for many types of GIS applications.
Choosing the right map type for your project
Selecting a map type starts with understanding your information and what you want to do with it. Raster maps are ideal when you need detailed, pixel-level analysis to capture variations across landscapes. Practical examples of raster mapping include:
- Elevation and terrain models
- Temperature or climate data
- Vegetation and land cover
- Air quality or pollution levels
Raster maps can help you monitor and visualize continuous data or phenomena. They’re particularly useful when you want to stack multiple map layers for deeper insights or predictive modeling.
Vector maps are a better choice for interactive mapping. They help you focus on individual features and see how they relate to each other. Examples of vector maps in action include:
- Representing points of interest like landmarks and facilities
- Planning new road networks or public transit
- Analyzing spatial relationships between warehouses and delivery routes
- Outlining polygons like parks and property parcels
Vector data provides enhanced clarity, allowing you to zoom in and resize your map so you maintain precision for every project.
Still, you don’t always have to decide between raster data vs. vector data. Instead, you can take a hybrid approach. Many GIS teams overlay raster images with vector files to gain contextual richness and analytical power.
Tools like Felt make this even easier. You can stream, layer, and visualize raster and vector formats no matter what your data types. Thanks to this interoperability, you don’t have to sacrifice performance for insight. Instead, you can combine the strengths of raster and vector data into one supercharged workflow.
Visualize raster and vector data together with Felt
Felt is the ultimate modern mapping platform. Users can upload and analyze raster and vector datasets in the same collaborative map without complicated GIS software. Just drag in your layers, style them how you like, and start exploring data right in your browser.
Felt’s cloud-native workspace handles the heavy lifting for you. Here are some of the top advantages to using this platform:
- Faster rendering: Maps load quickly, even with high-resolution rasters or dense vector data, so you don’t have to wait for tiles to fill in.
- Fluid panning and zooming: Easily move around your map and zoom in and out without the usual lag or stutter you get with traditional GIS tools.
- Instant updates: When you adjust a style, add a layer, or share data with your team, the map refreshes immediately regardless of file size.
Felt makes working with multiple datasets a breeze. You can overlay imagery with vector features and run lightweight analyses, all while collaborating in real time. It’s a flexible, intuitive way to manage data and keep maps organized.
See for yourself. Explore how Felt makes it easy to bring raster and vector data together, spot spatial patterns, and align your whole team.
FAQ
Can I use raster and vector maps together?
Yes, raster and vector maps are often used at the same time. Raster data provides the backdrop, like satellite imagery or terrain shading, while vector data adds interactive elements — such as parcels and property lines. Using modern GIS tools like Felt, teams can layer and work with both formats from one browser.
How do raster and vector data compare in GIS?
Raster data consists of pixels, which is ideal for showing gradual changes across a landscape via heatmaps and terrain models. Vector data uses points, lines, and polygons to capture discrete data with precise shapes and locations. In GIS, raster images are best for studying continuous surfaces, while vector files are better for feature-level analysis and interactive mapping.
Compare Felt using AI