Discover how hexagonal grids work and when to use them
As teams search for better ways to display distance, movement, and relationships on a map, hexagonal grids have become a popular choice over square grids.
The difference lies in their structure. A square grid connects each cell to four neighbors, leading to potential directional bias. A hex connects to six evenly spaced neighbors, resulting in a more balanced layout.
We’ll provide an overview of what hexagonal grids are, where they’re used, and how to build your own using Felt. Along the way, you’ll see why a hex might be the right choice for your next grid-based map and when a square still makes sense.
What is a hexagonal grid? And how does it relate to GIS?
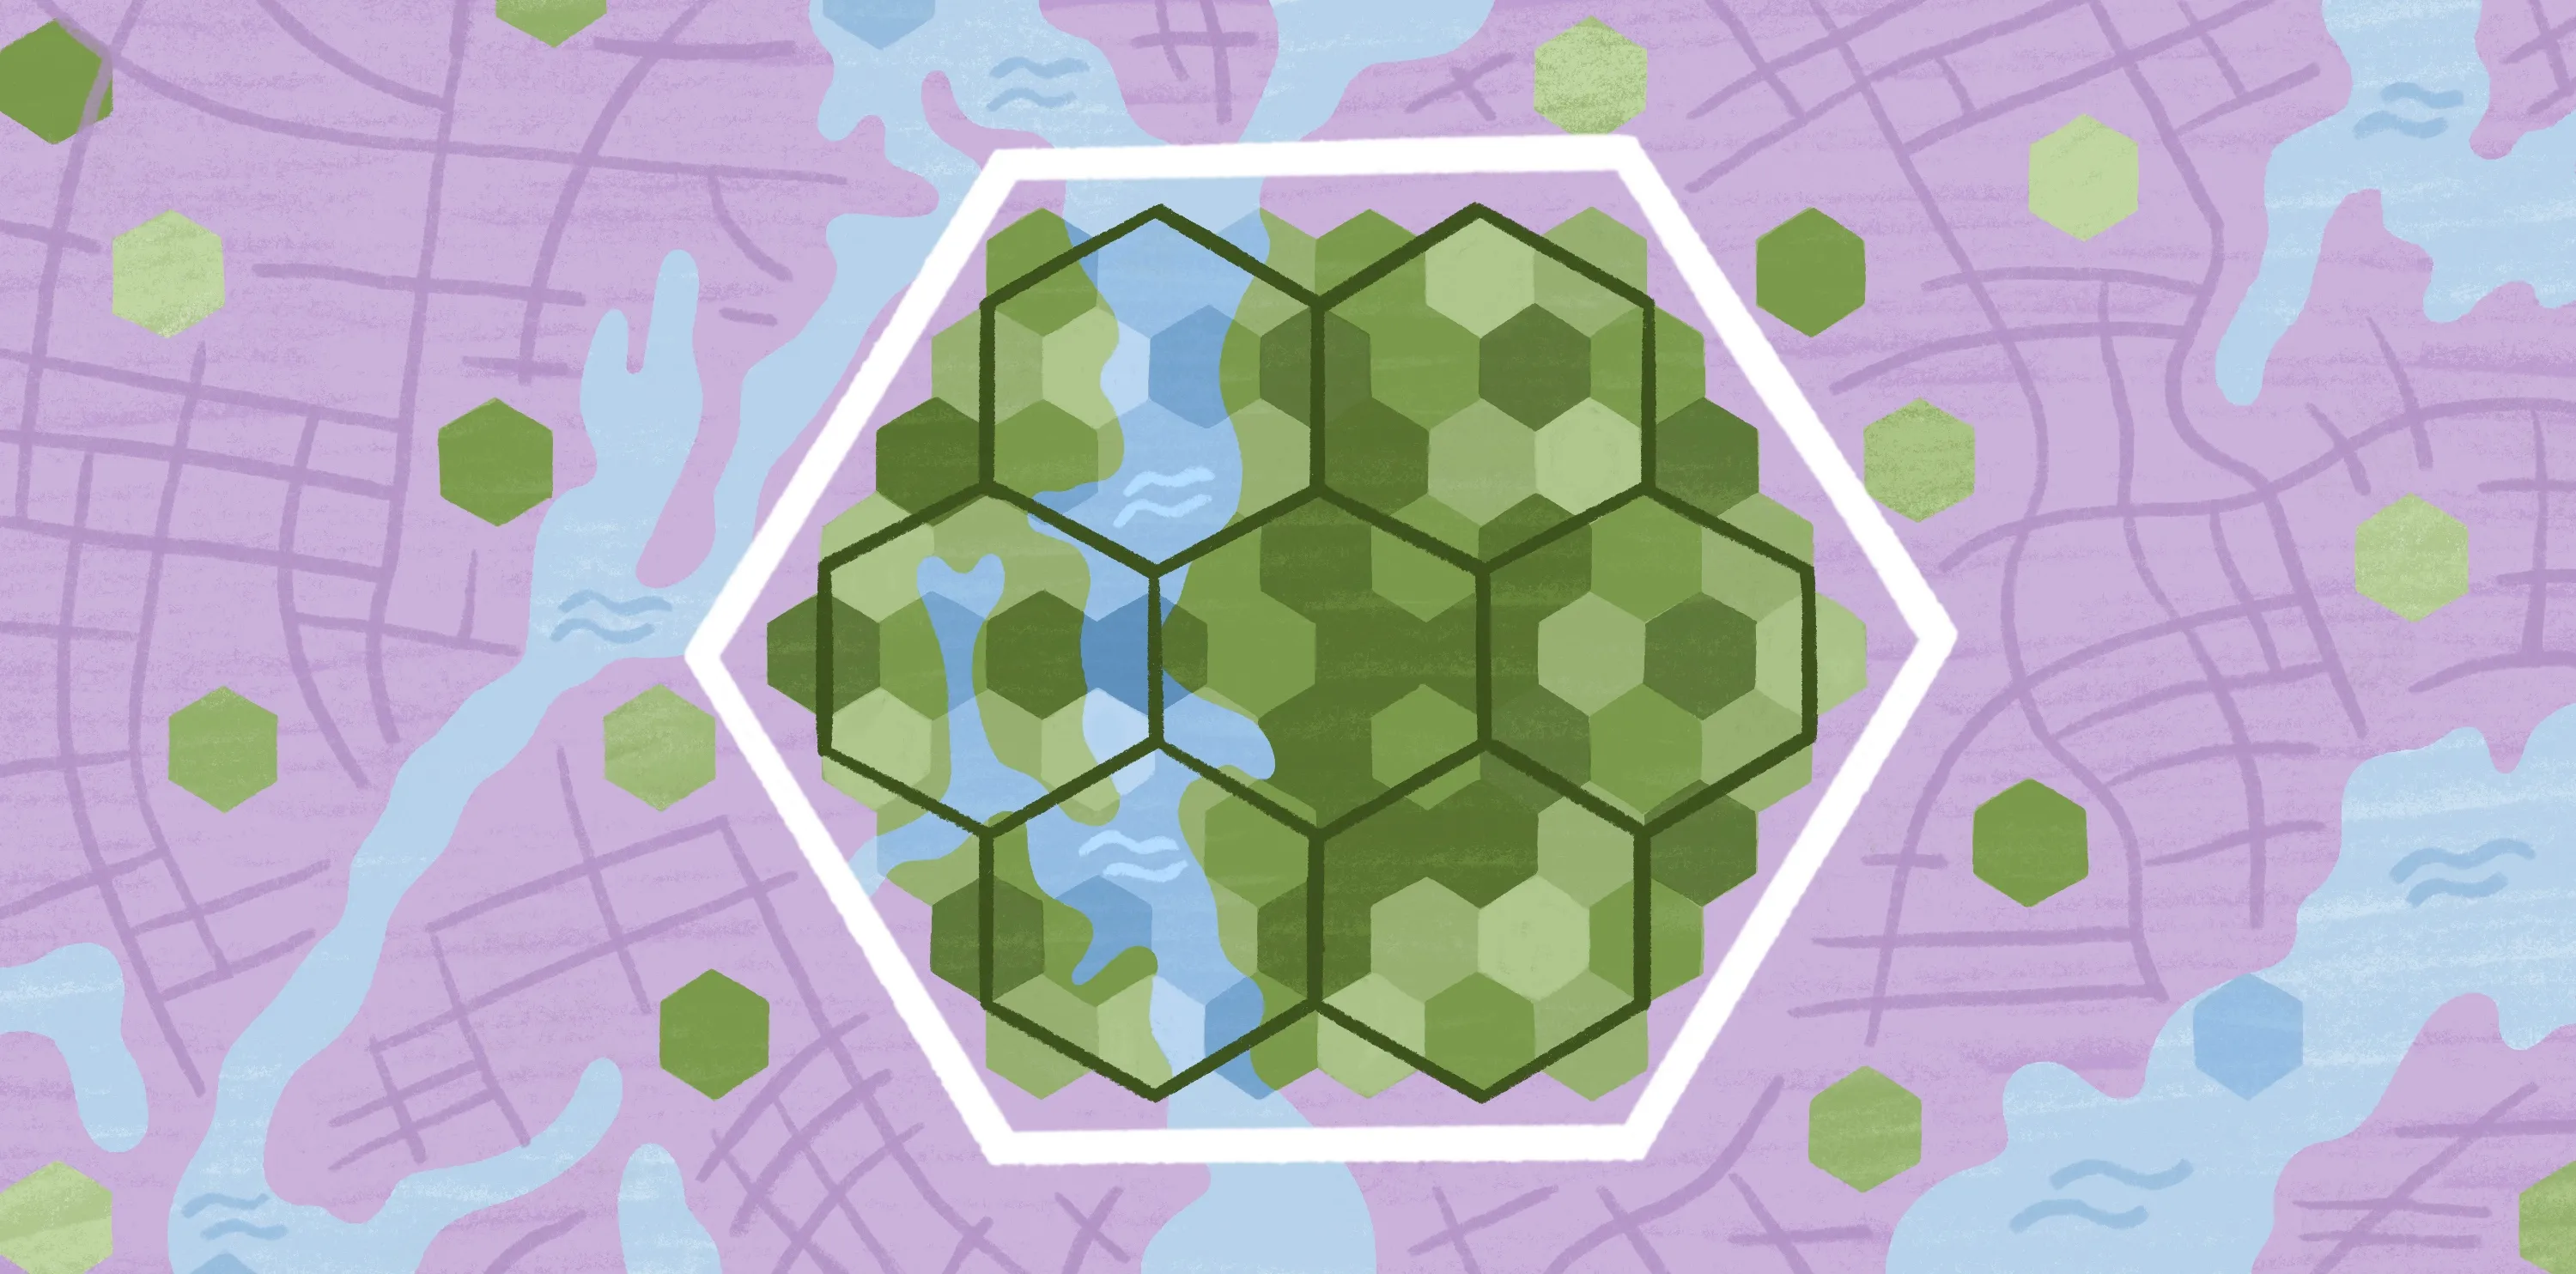
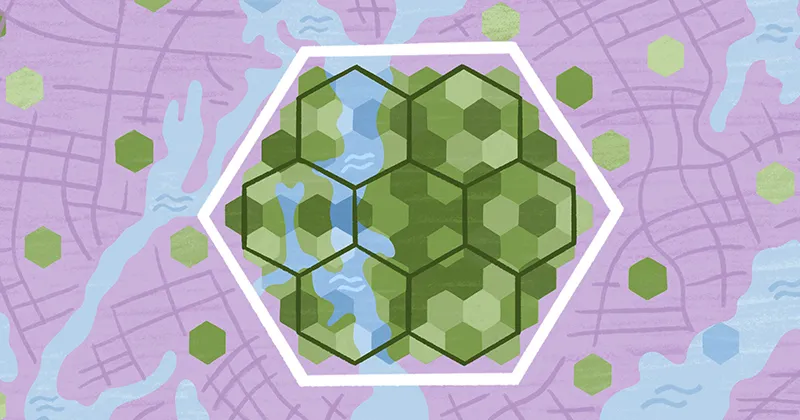
A hexagonal grid is a spatial framework made up of interlocking hexagons that fit together with no gaps. Unlike square grids, where each cell connects more strongly in some directions, hex grids maintain nearly equal distance to each neighbor.
This lack of directional bias is what makes hexagonal grids ideal for mapping and spatial analysis. Analysts often use them in geographic information system (GIS) applications to visualize data, as well as for finding patterns in density and movement.
7 key properties of hexagonal grids
These seven properties explain why hexagonal grids are such a versatile choice for map building:
- Tessellation: Regular hexagons fit together without gaps or overlaps on the map. This creates a smooth grid surface that supports accurate tiling across large regions.
- Uniformity: Each hex cell touches six neighbors at nearly equal distance.
- Isotropic: A hexagonal grid behaves the same way in every direction, unlike square grids, which favor horizontal and vertical movement.
- Reduced bias: Each hex has balanced relationships on all sides, helping reduce directional and boundary bias.
- Curvature: Hexagons approximate circular neighborhoods more naturally than squares, which helps when modeling geographic features that spread outward in all directions.
- No acute angles: With no sharp angles, hexagonal grids are easier to read and interpret, particularly for large-scale projects like density mapping.
- Efficiency: Hexagonal grids cover space more efficiently while preserving accuracy, making them a strong choice for GIS mapping and analysis.
When to use a hex grid on a map: 7 applications
A hex grid isn’t the right fit for every map, but there are times when it outperforms other grid types. Here are examples that show where a hexagonal grid delivers clearer insight.
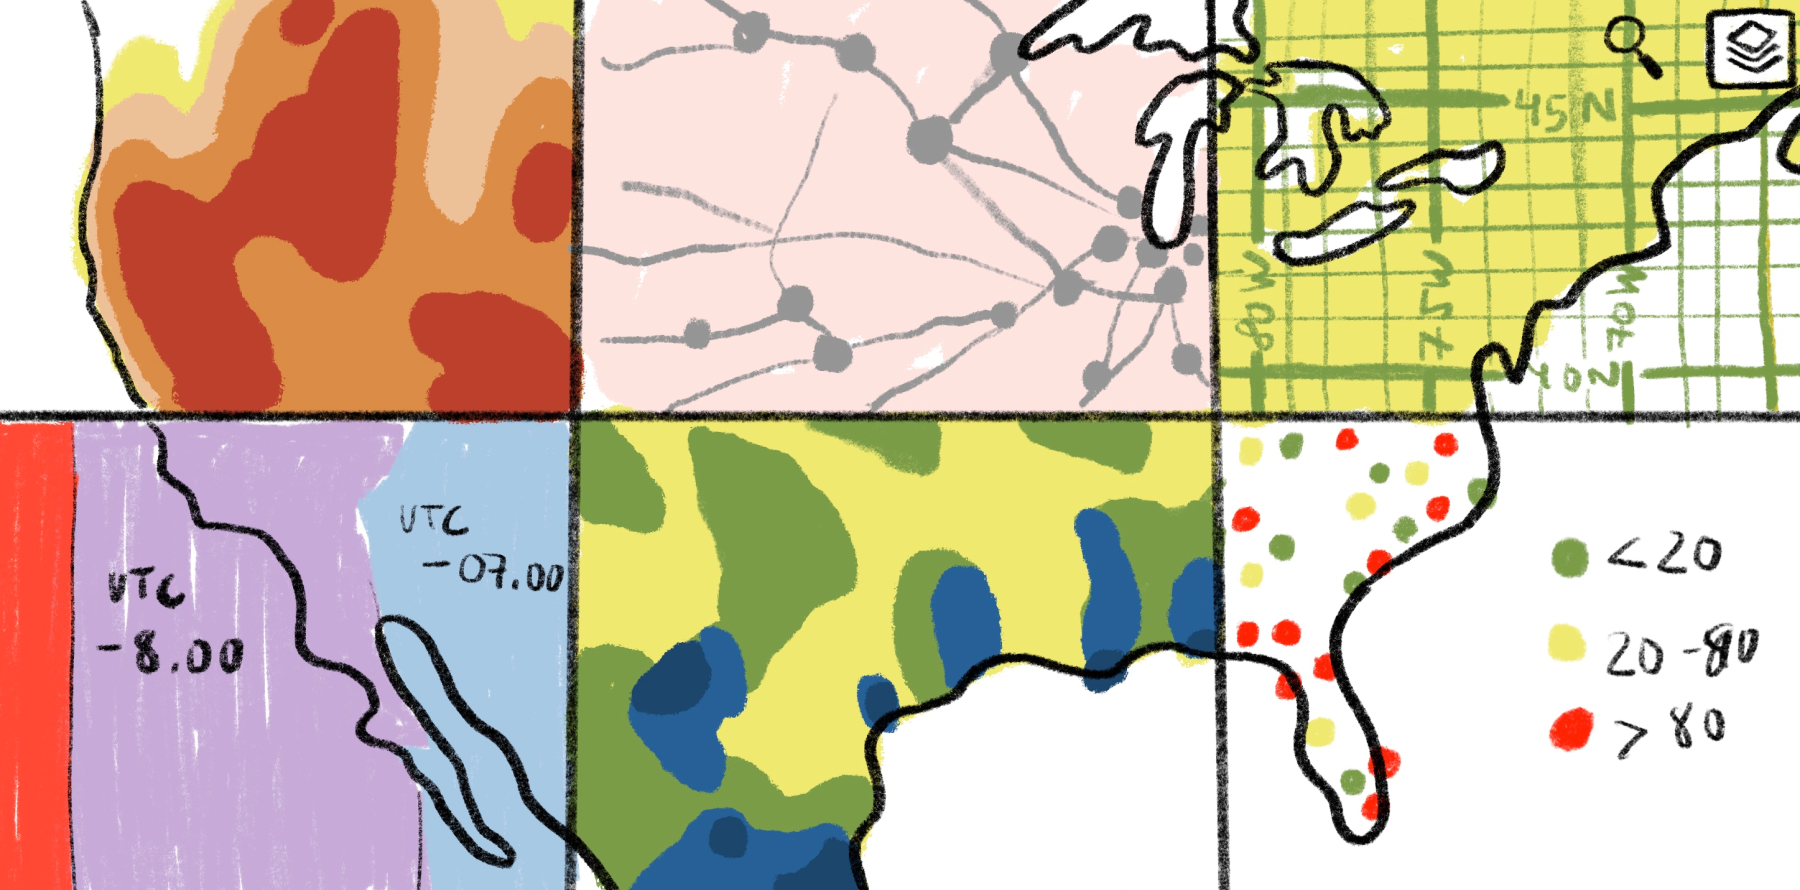
Hexagons in real-world maps
Real-world data doesn’t fit neatly inside administrative boundaries like county lines and zip codes. Using hexagons, you can apply a consistent grid across your map and visualize patterns that usually stay hidden in a square layout — like activity clusters. A hex map smooths out uneven shapes and makes it easier to evaluate different areas at the same scale.
Urban planning
Urban planners use hexagonal grids to analyze density, land use, and access to services. The structure supports even comparison across neighborhoods. It also helps planners evaluate long-term trends in population growth or service demand.
Transportation
Transportation networks don’t always move in straight lines. Roads curve around hills, railways bend through cities, and bike lanes weave through neighborhoods. Hexagonal grids mirror these movement patterns more naturally than a square layout. They also support movement in multiple directions without bias. This gives planners and engineers a way to analyze travel times and spot congestion points.
This intuitive design is exactly why Uber created H3, an open-source geospatial indexing system. H3 uses hexagonal patterns that accurately, consistently represent the Earth’s surface. This tool helps Uber set dynamic prices, calculate supply and demand, and boost service efficiency.
Telecommunications
Telecom companies frequently rely on hexagonal maps to evaluate signal coverage. The honeycomb-like grid provides an unbiased way to see large areas and identify weak zones. This helps them strategically plan for new towers and make service more reliable.
Site selection
Site selection depends on comparing locations fairly, giving each option an equal basis for evaluation. Hexagonal grids support this process, as they create a neutral framework for layering demographic and demand data. By removing administrative boundaries, hexes help planners assess opportunity and risk to pinpoint the most promising locations.
Spatial analysis
Hex grids offer a clean way to aggregate and analyze spatial data. Their uniform shape prevents distortions that can arise from irregular boundaries. This helps analysts observe patterns in density and proximity. These qualities make hexagonal grids a popular choice in GIS workflows, enabling reliable, data-driven analysis for public health, environmental monitoring, and emergency planning.
Gaming
Hexagonal grids are widely used in strategy and simulation games because they make movement feel fair and predictable. Since each hex sits the same distance from its neighbors, players can judge range at a glance instead of stopping to count or second-guess moves. That consistency helps reduce confusion and gives designers a solid foundation for building depth without adding unnecessary complexity.
Note: All the above linked examples were created in Felt, showing just how easy it is to work with hex grids across any map or dataset.
How do I add a hex grid to a map? Felt can help
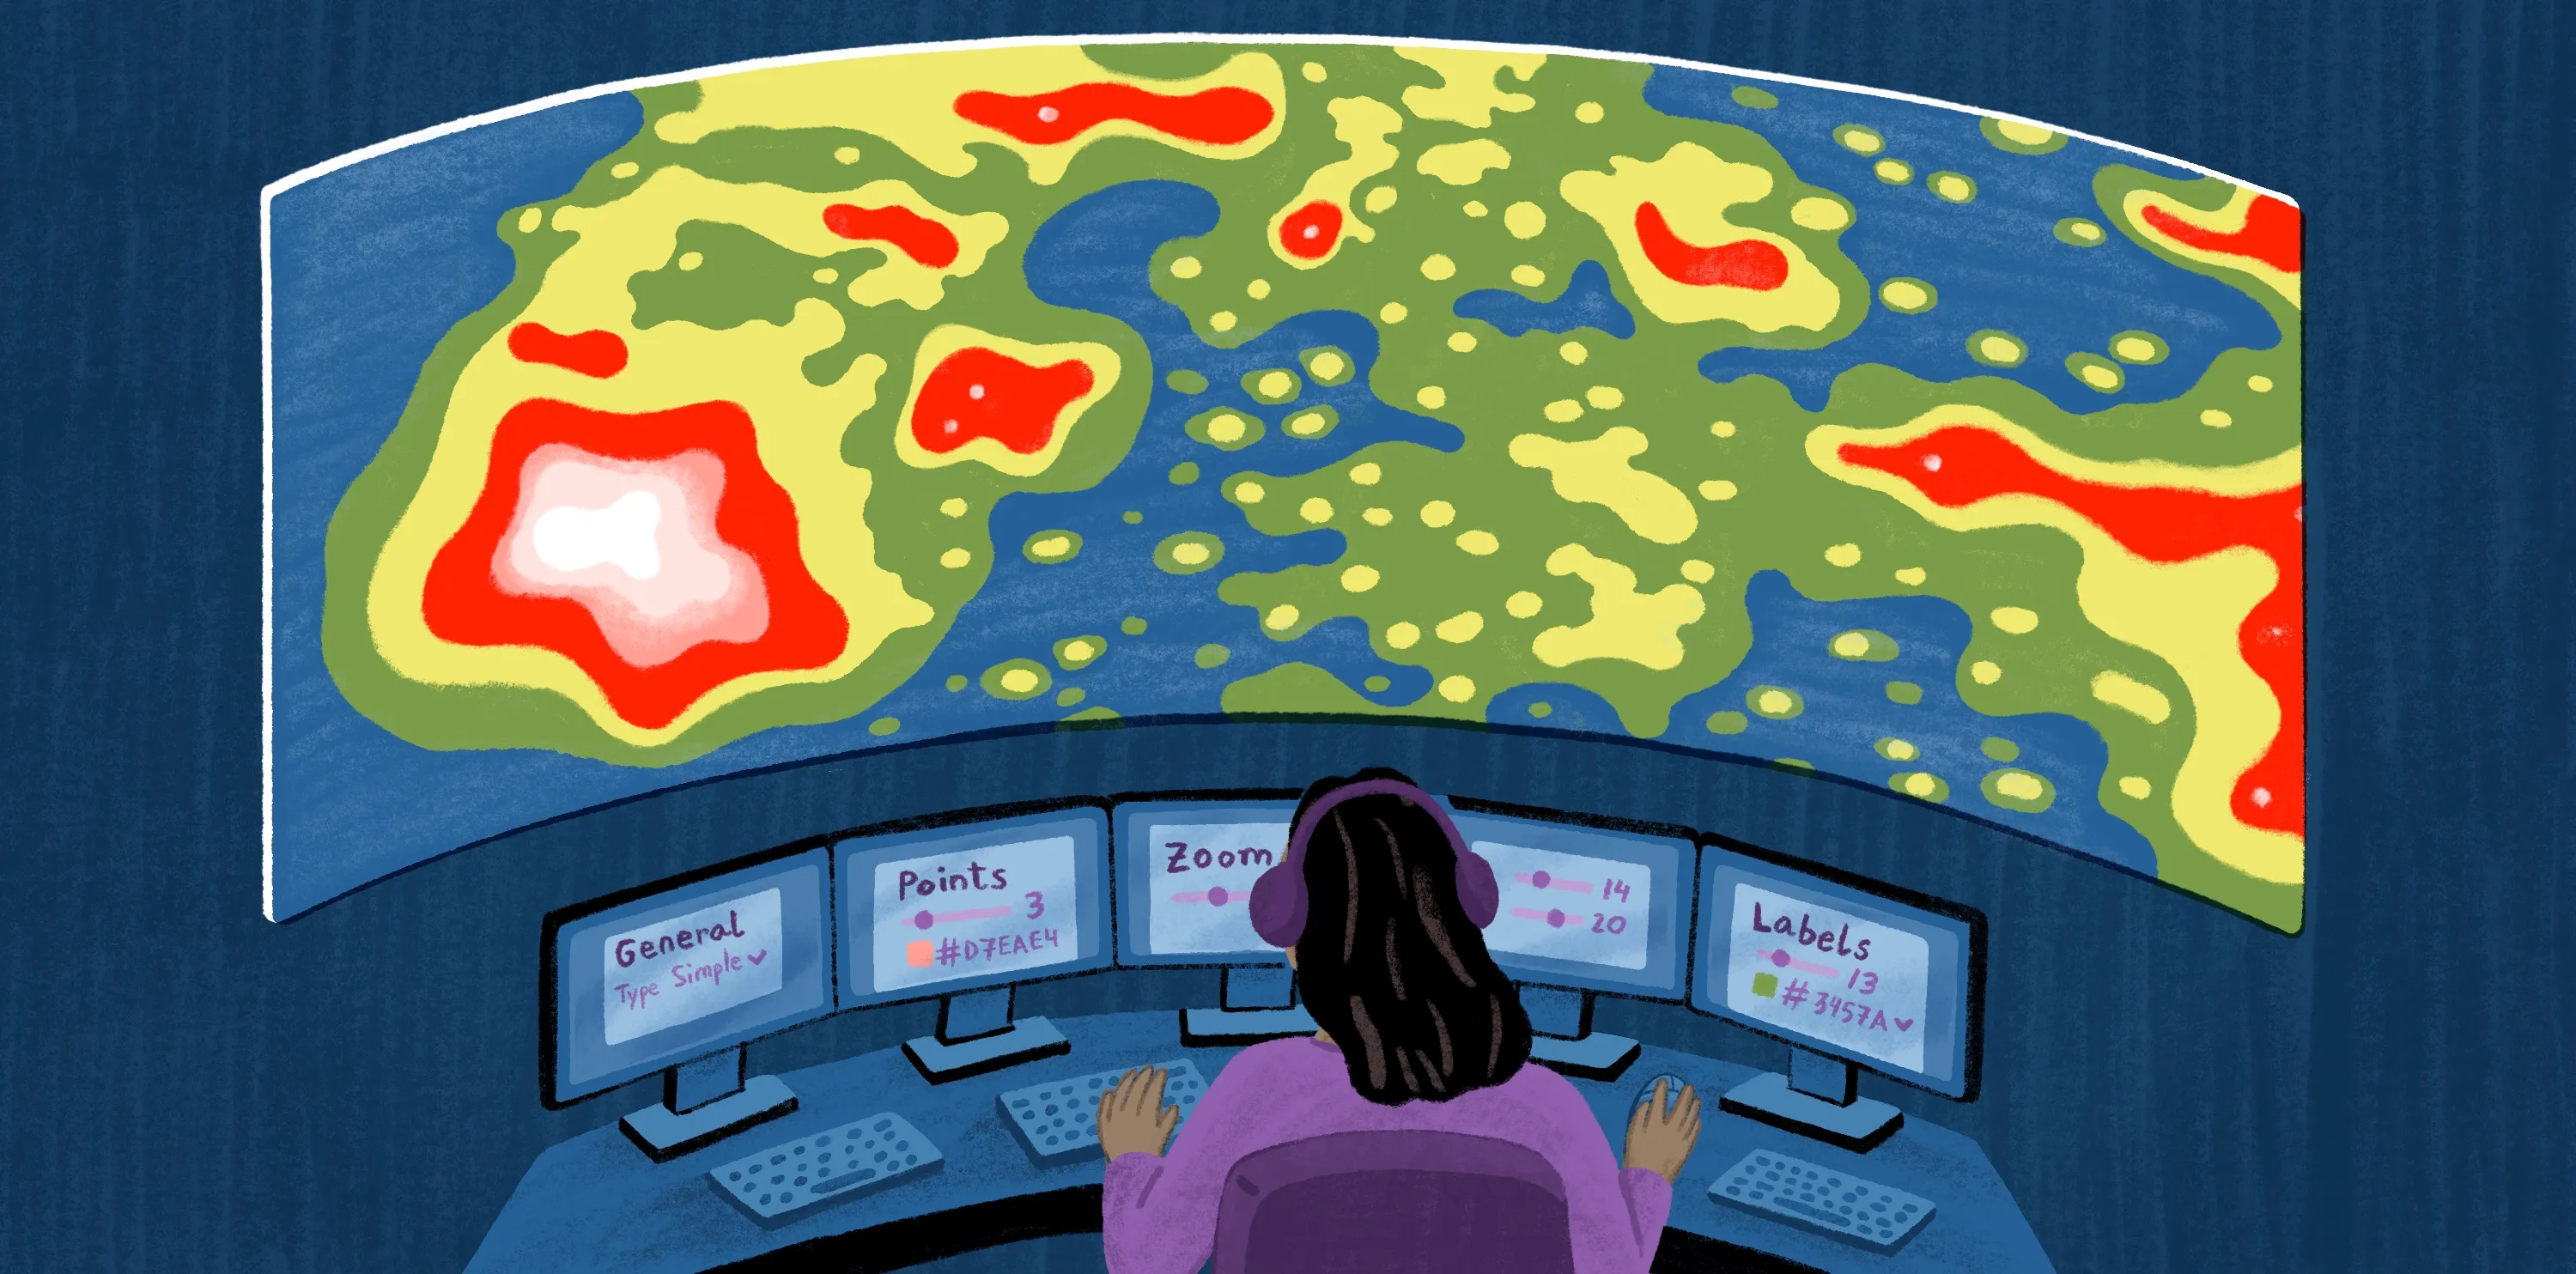
To build a map with hex grids, you typically need GIS to manage spatial data and apply a uniform structure. GIS ensures each cell accurately represents the underlying information. Felt simplifies this process with its intuitive interface, letting you overlay a hex grid and adjust its resolution with automatic scaling.
Felt’s H3 spatial indexing and on-the-fly binning help you instantly visualize geospatial data in hexagonal grids. That way, you can uncover new insights and streamline data analysis for any use case.
Here’s how to add a hex grid to maps in Felt:
- Select H3 visualization: Choose the H3 option to start your hexagonal grid overlay. This divides the map into uniform hexagons and makes sure all subsequent features like resolution scaling work correctly with your data set.
- Automatically bin your data: After selecting H3, Felt groups your data into hexagonal cells. This automatic binning organizes data points that fall within the same hex and creates an easy-to-read map without manual tiling. Felt’s automation saves significant time since patterns in density and coverage are immediately visible.
- Set your visualization to update at every zoom level: Turn on dynamic zoom so your map stays accurate as you move in and out. This preserves spatial relationships and data density at any scale and keeps your map responsive. You can explore both high-level overviews and detailed local patterns with clarity.
- Customize your visualization with a specific resolution: Adjust the hexagon size to your desired level of detail. Low-resolution hexes cover larger areas and show broader trends, while high-resolution hexes reveal fine-grained patterns over smaller regions.
Unlock the power of hexagonal grids with Felt
Felt helps you create maps with hexagonal grids in seconds. It supports hotspot identification and density analysis while offering powerful insights right from your operations dashboard. Set your bin resolution once and Felt handles the rest, automatically optimizing visualization for a seamless mapping experience. As you zoom in or out, your hexes auto-scale to maintain accuracy with every detail.
See for yourself. Book a demo with Felt and explore spatial data in a whole new way.
Compare Felt using AI