Understanding H3 index: The hexagonal grid powering modern spatial analysis
Location data is everywhere, including in deliveries, outages, and customer demand. But turning those dots into something you can measure is difficult. H3 solves that by turning the Earth’s surface into a grid of hexagons and giving each hexagon a unique ID. This approach makes your locations countable and easy to group in a consistent format.
H3 is hierarchical, so you can choose a resolution that fits your goal. You can zoom out for broad patterns or zoom in for local detail while staying inside the same system. H3 is important because teams today aren’t just making maps; they’re applying analytics to massive datasets to produce results.
In this article, you’ll learn what H3 is, how it works, and when you should use it in your spatial analysis workflows.
H3 meaning: What is it and why was it created?
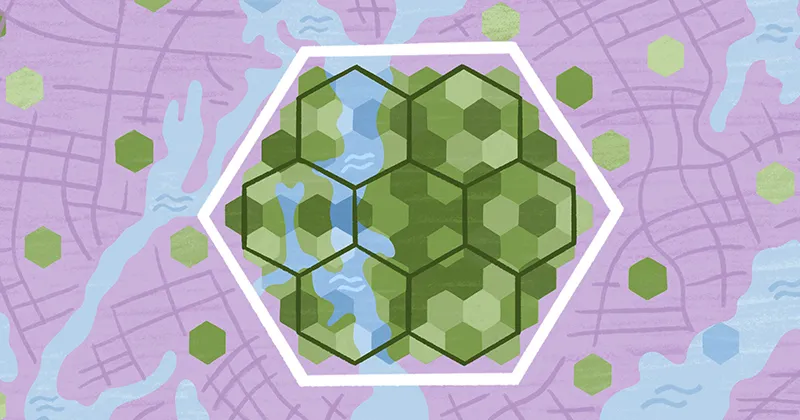
H3 is a hexagon-based, hierarchical spatial indexing system. Think of it as a ZIP code system for the planet, where each code represents a hexagonal cell. When you have a location — like a delivery drop-off, a reported incident, or a customer request — H3 tells you which hexagonal tile it falls into, and you store that tile’s ID alongside your data.
H3 makes geospatial workflows more consistent and scalable than ad hoc latitude/longitude coordinates. Uber created it to support large-scale marketplace analysis and operational decisions. Their teams needed a grid that could support citywide decisions, like understanding supply and demand by area to inform pricing and driver dispatch — without relying on messy, inconsistent boundaries. They also wanted a system that behaved predictably as people moved around a city.
Hexagons were a deliberate choice. You can divide each cell into smaller cells and switch between broader and detailed views without reinventing your analytical approach every time.
How the H3 hexagonal grid works
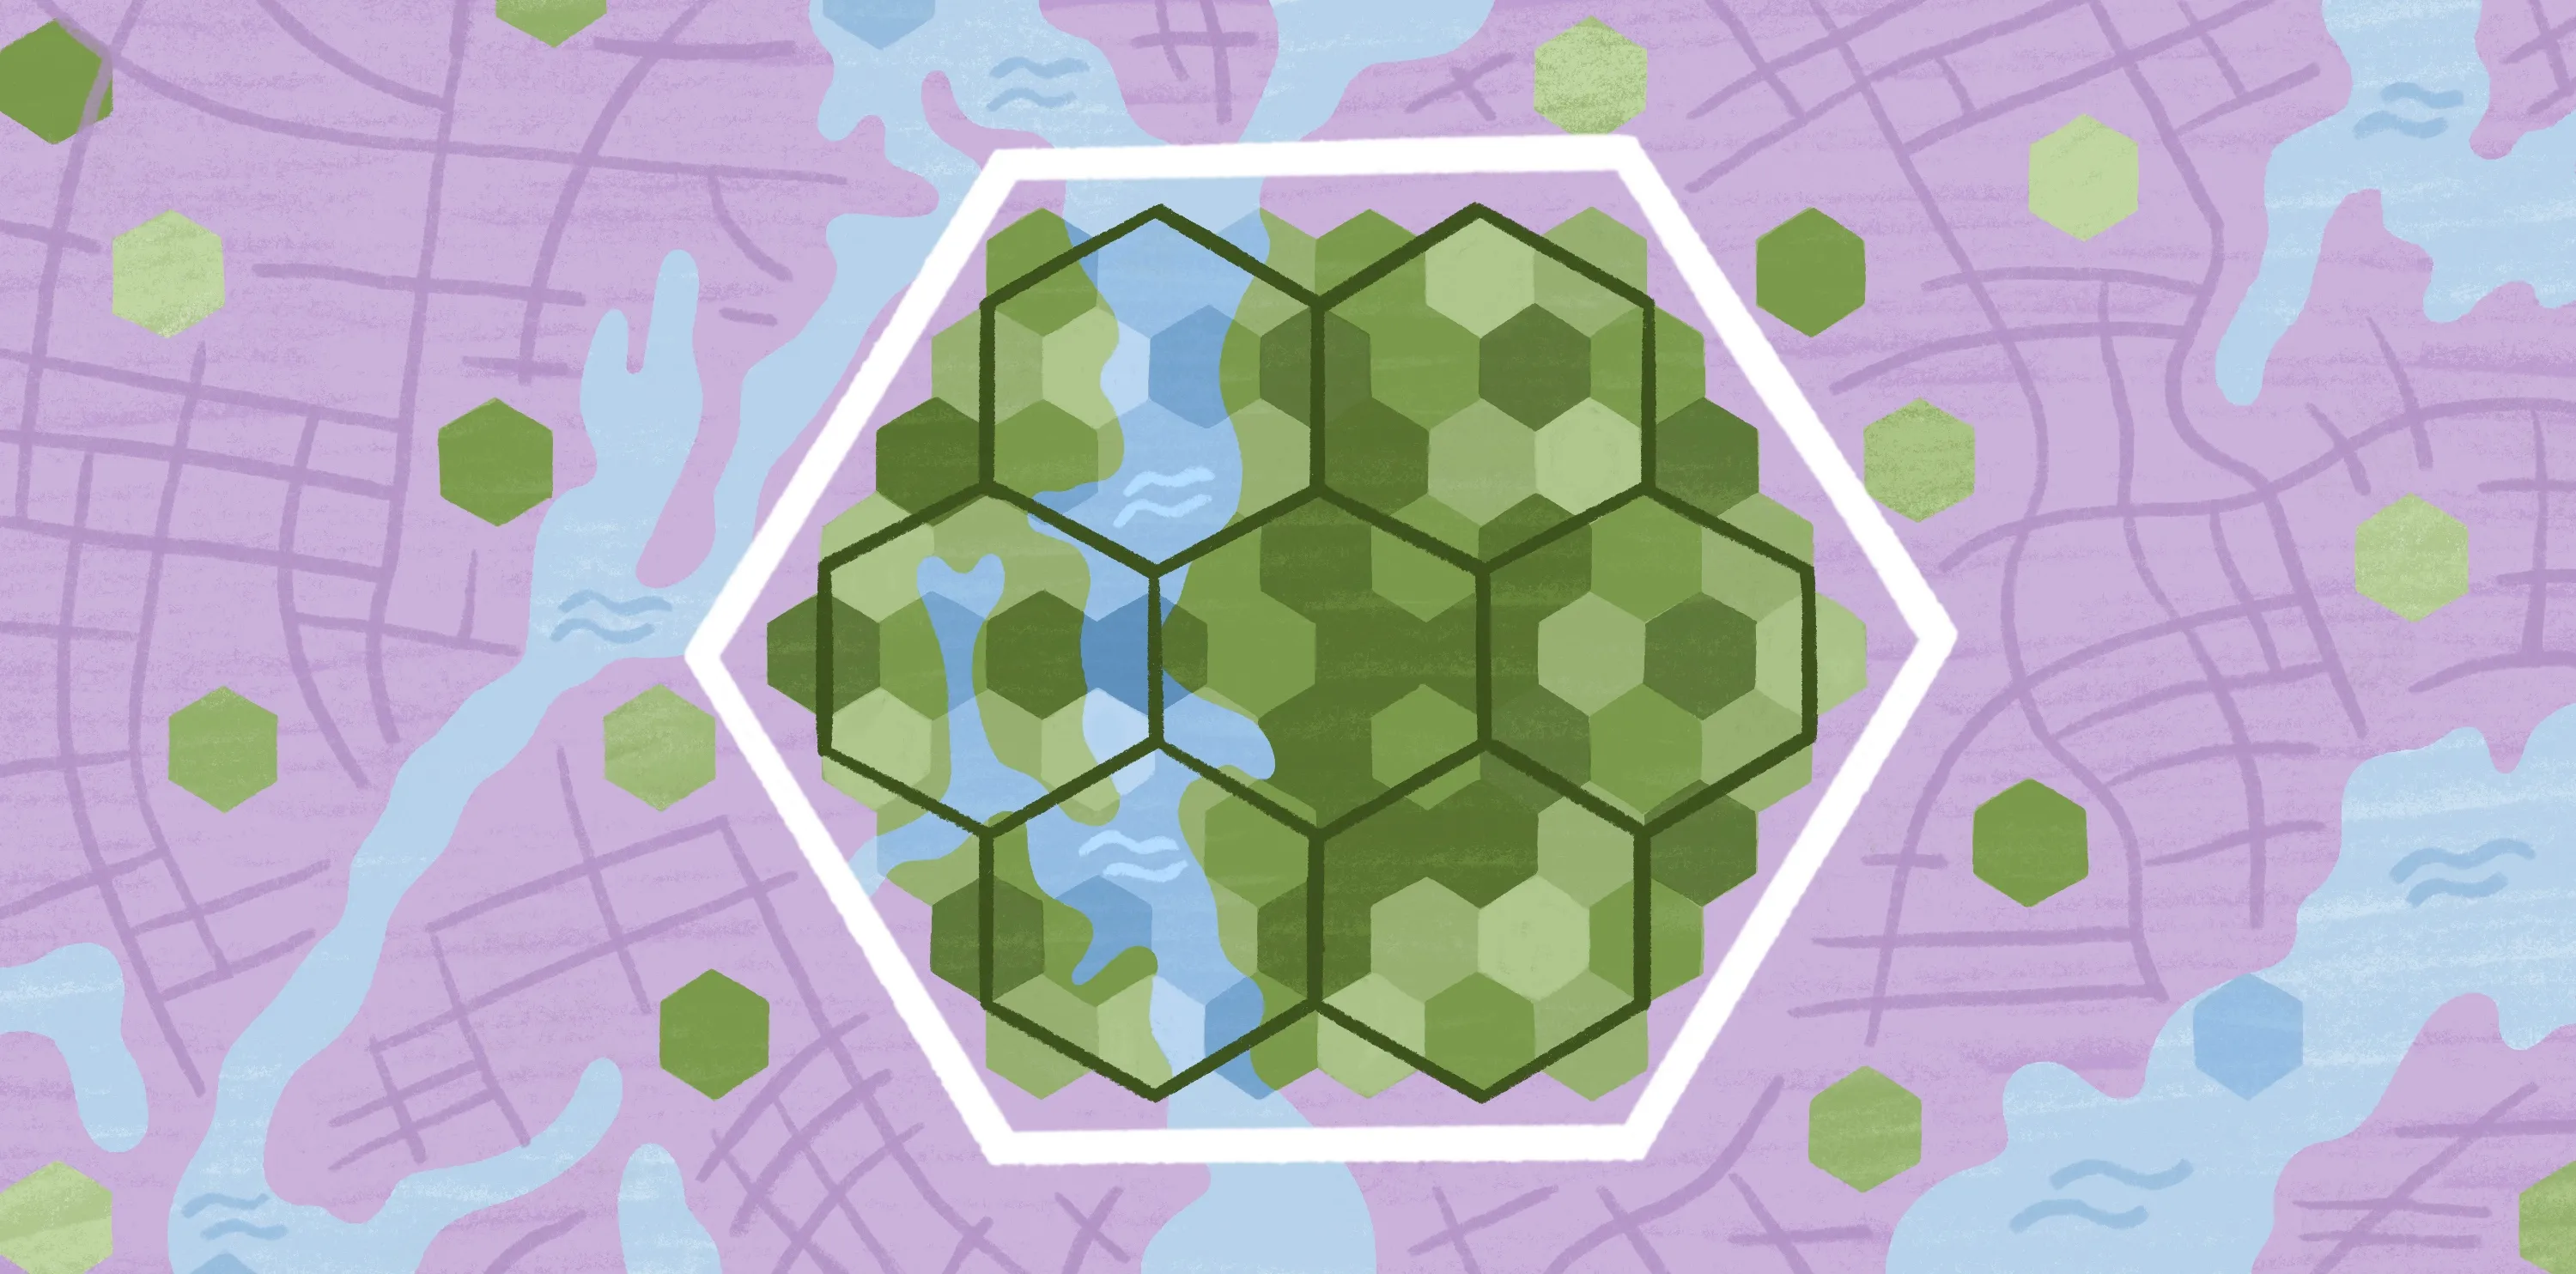
H3 follows a core philosophy: turn the Earth into a set of repeatable, hexagonal tiles so you can summarize location data the same way everywhere. The following sections break down how the grid’s shape, scale, and hierarchy work in practice.
Why hexagons, not squares?
Squares don’t behave the same in every direction. They touch some neighbors along edges and others only at corners. This creates uneven “next-door” relationships when you’re analyzing patterns like movement or gradual change. Uber highlights this neighbor mismatch as a drawback of square grids in mapping analysis.
Hexagons are more even, producing a consistent set of adjacent neighbors. Uber specifically chose hexagons because they reduce quantization errors as people and goods move through a city. Even small movements don’t produce awkward jumps in the grid. This makes neighbor geometry smoother and reduces sampling bias caused by imperfect edge effects.
Resolutions
H3 supports 16 resolution levels from 0 to 15. Moving up a resolution gives you more detail by making cells smaller. Uber describes each finer resolution as having approximately one-seventh the area of the level above it.
A practical way to think about resolution is to choose the cell size that matches the decision you’re trying to make. For example, coarser resolutions work for citywide or regional patterns. Finer resolutions are great for neighborhood-level hotspots or localized comparisons.
Parent-child relationships
H3 is hierarchical, so cells connect cleanly across resolutions. Each hexagon has seven children at the next, finer level, often called “aperture 7.” Pentagons subdivide into six children — five hexagons and one pentagon.
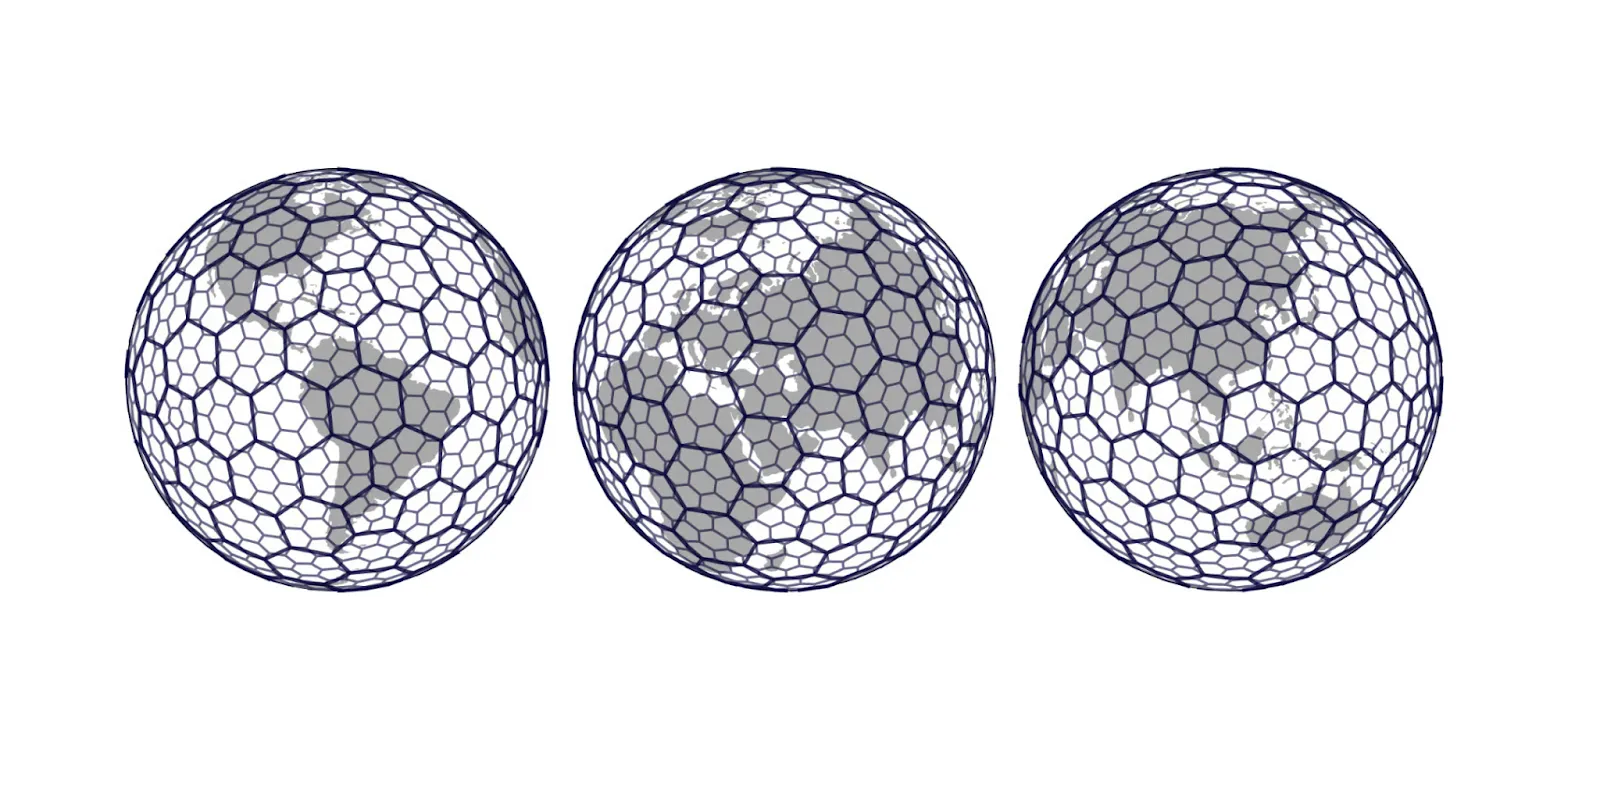
Pentagons have five neighbors and show up because you can’t wrap the entire Earth in perfect hexagons. H3 is still a hexagon-first system, but pentagons are the small stitches or seams that fill in the granular gaps, make the math closer, and let a hex-style grid work on a globe.
Every H3 resolution includes 12 pentagons, while everything else is hexagons. Uber oriented the grid so those 12 pentagons land in less disruptive areas — like placing the vertices in water — to reduce practical mapping headaches, especially in geographic information systems (GIS).
When and why H3 is used in spatial analysis
H3 is most effective when you need to turn scattered location data into stable, comparable areas fast enough to keep up with real-world scale and events. Here are a few common use cases:
- Aggregation of large point datasets: When you have millions of points, raw coordinates are too granular to summarize on their own. With H3, you snap each point into a cell ID and then aggregate by cell, producing clear counts, averages, and rates.
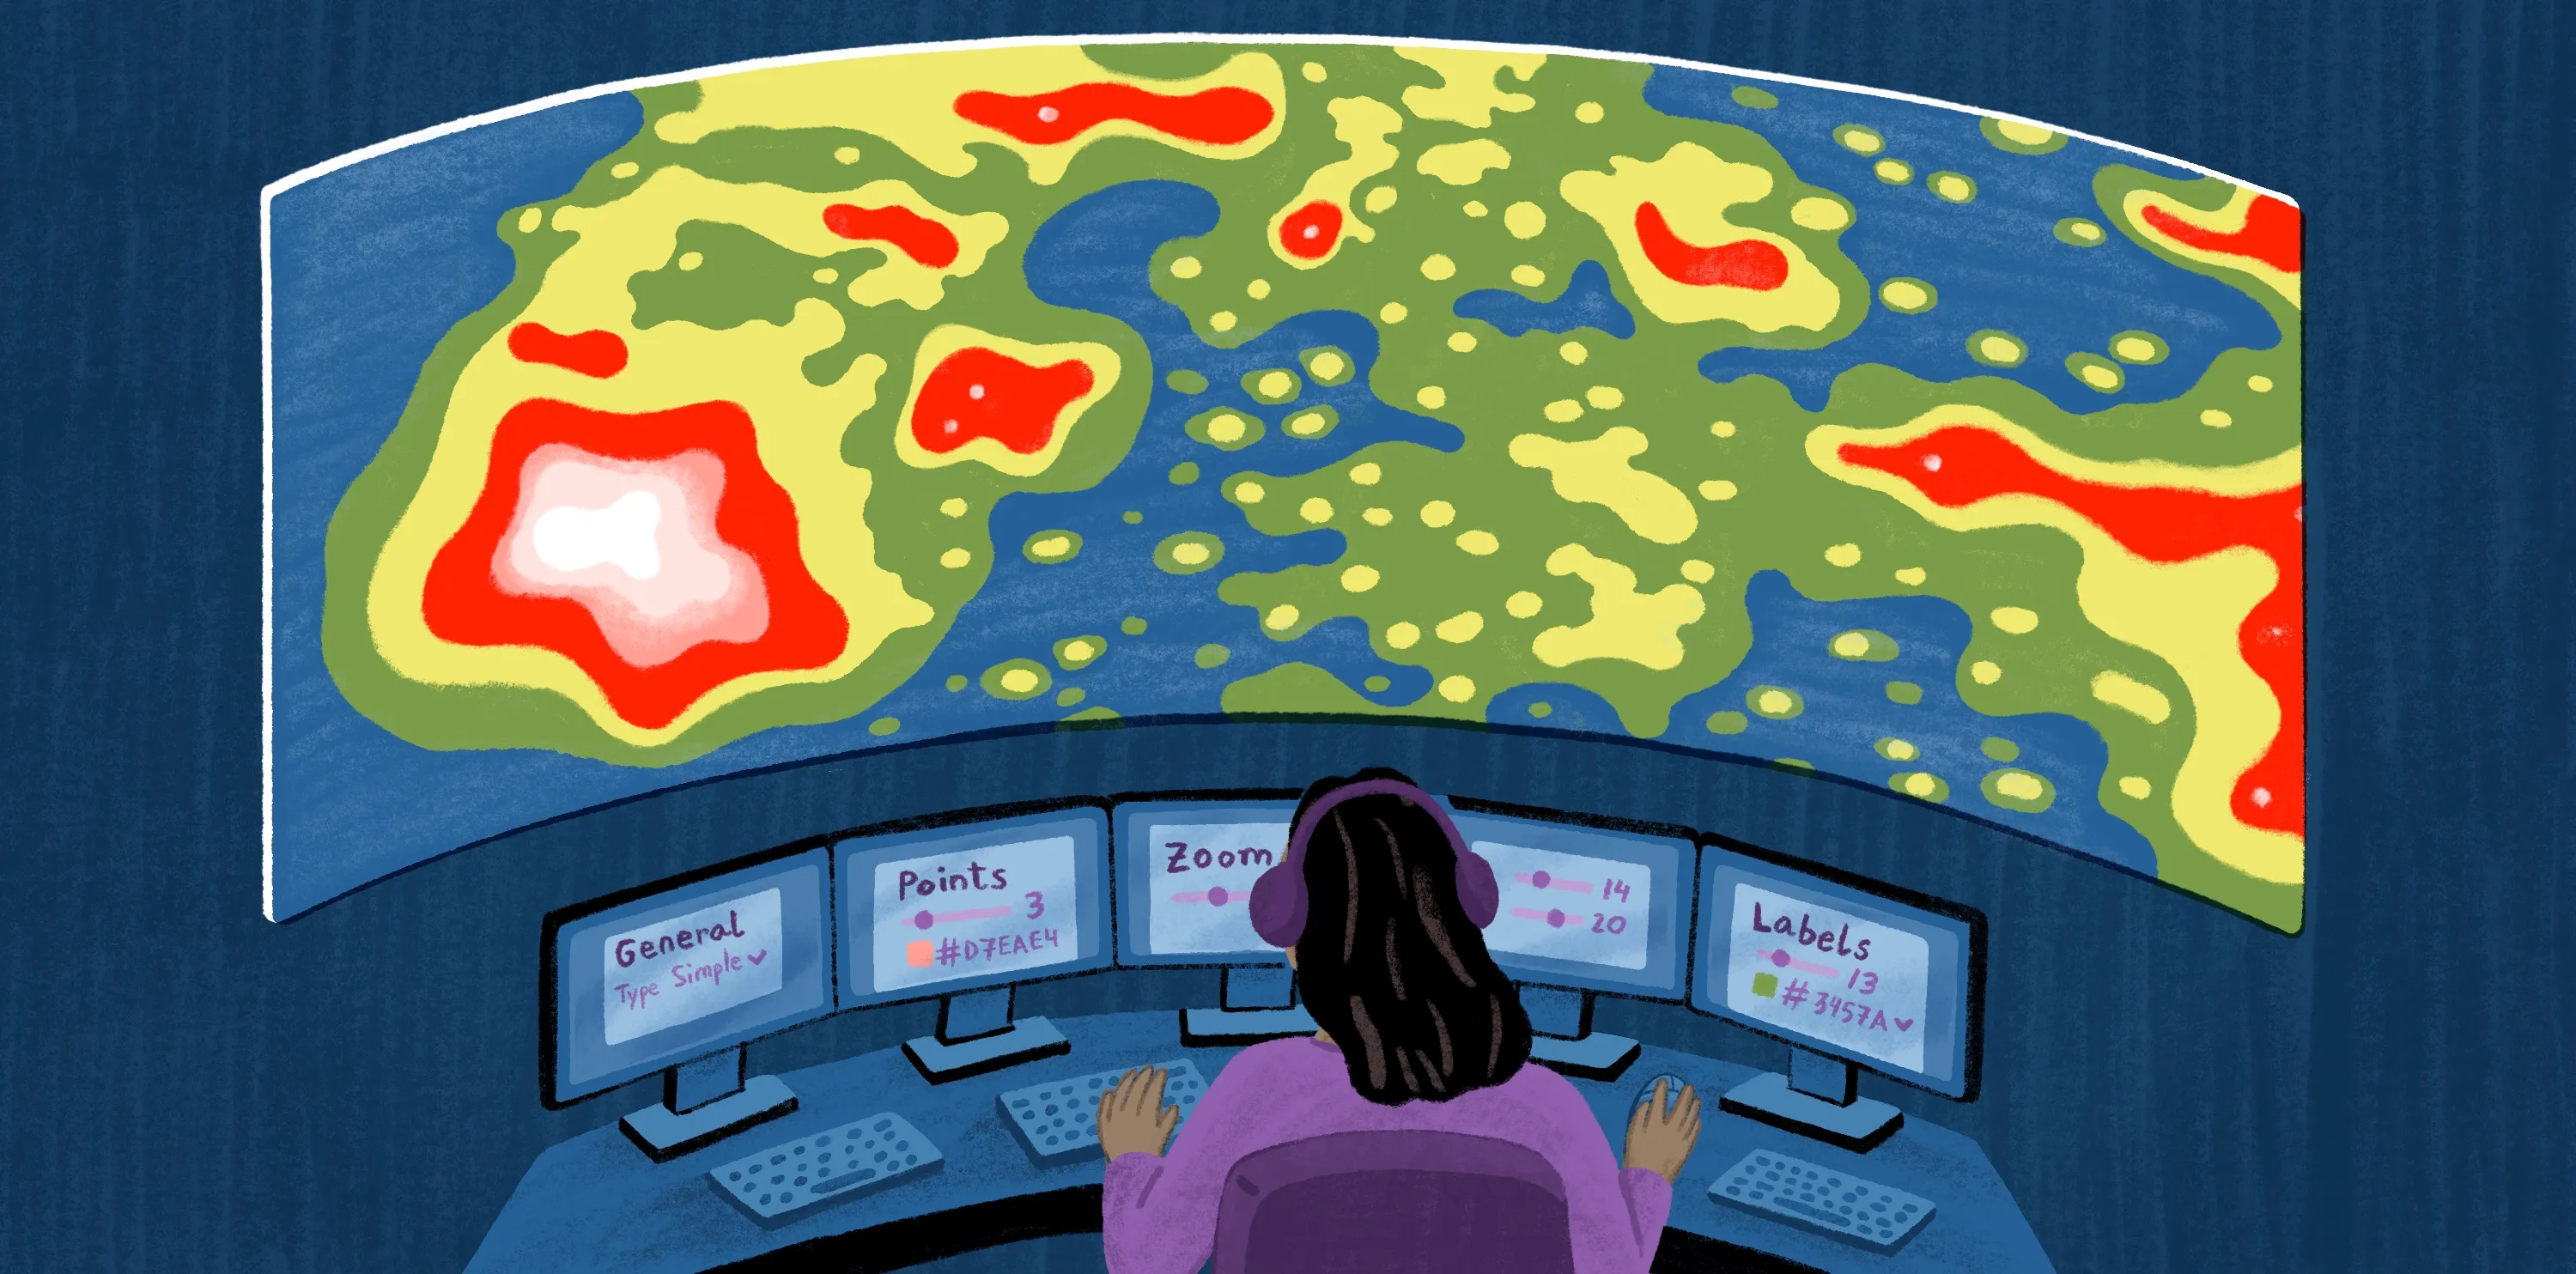
- Density analysis and clustering: Heatmaps often become too noisy or blurry. H3 maps offer a middle ground, where you can pick a resolution, bucket events into cells, and see hotspots appear as clusters of high-value hexagons. Since cells are part of a global grid, you can do this consistently across different areas without reinventing your clusters for every map.
- Comparing patterns across regions: Administrative boundaries are familiar, but they’re irregular and can change, causing your results to shift. H3 is a better fit when you want a neutral comparison layer with the same rules and resolutions, no matter where you conduct spatial analyses.
Why H3 fits modern analytics workflows and beats raw coordinates
H3 works well in large-scale data processing because it turns spatial questions into tabular form. After indexing data to cell IDs, you can group by cell, join datasets on cell, and analyze at different resolutions without constantly running heavy geometry operations. Here’s when H3 is the best fit:
- Choose H3 over raw coordinates: When you need summaries, comparisons, or trends instead of exact positions.
- Choose H3 over administrative boundaries: When you want consistency across places and time, or when boundaries don’t match how your phenomenon behaves — whether through movement, demand, or external environmental signals.
Stick with boundaries when the question is inherently administrative and relates to policies, service areas, or reporting requirements. H3 can still complement them, but it shouldn’t replace them.
Visualizing and exploring H3 data with Felt
H3 can help you see patterns, test resolution choices, and align on what data says to inform impactful business decisions. Now that you know how the hexagonal grid and hierarchy work, the next step is making those insights easy to explore and share without technical complications.
Felt lets you visualize H3 cells directly on an interactive map using native H3 visualizations, including on-the-fly H3 binning for point data and summary stats for quick analysis. You can explore patterns across different H3 resolutions by letting the resolution scale dynamically as you zoom or by choosing a fixed resolution when you want a consistent lens.
Regardless of use case, Felt has a feature to help your team. Plus, Felt is layer-first, so you can combine H3 results with other layers — like boundaries or routes — to understand what and why events happen.
Try Felt today and apply H3 to your mapping experience.
FAQ
How is H3 different from latitude and longitude grids?
Latitude and longitude are coordinates that tell you where a point is, but they don’t automatically provide a consistent unit of area for summarizing data. H3 is different because it’s an indexing system that turns locations and shapes into discrete cell IDs on a mostly hexagonal grid. Once points share the same cell ID, you can group them, compare cells over time, or join datasets using the IDs.
What types of projects benefit most from using H3?
H3 works best when you’re handling large amounts of location data and need results that are easy to aggregate, compare, and visualize. Here are common examples of project types and use cases that benefit most from H3:
- High-volume point datasets: Projects where large streams of raw coordinates need to be grouped into stable cells for clear summaries
- Cross-dataset analysis: Projects where you want to combine different sources by indexing them to the same H3 cells, then joining or aggregating them by cell ID
Dashboards and monitoring: Workflows where you want to summarize data at different zoom levels. This provides a broader, big-picture view for the whole region versus a closer view for specific hotspots, so your summaries stay comparable as you change the map scale without changing your method each time
Compare Felt using AI