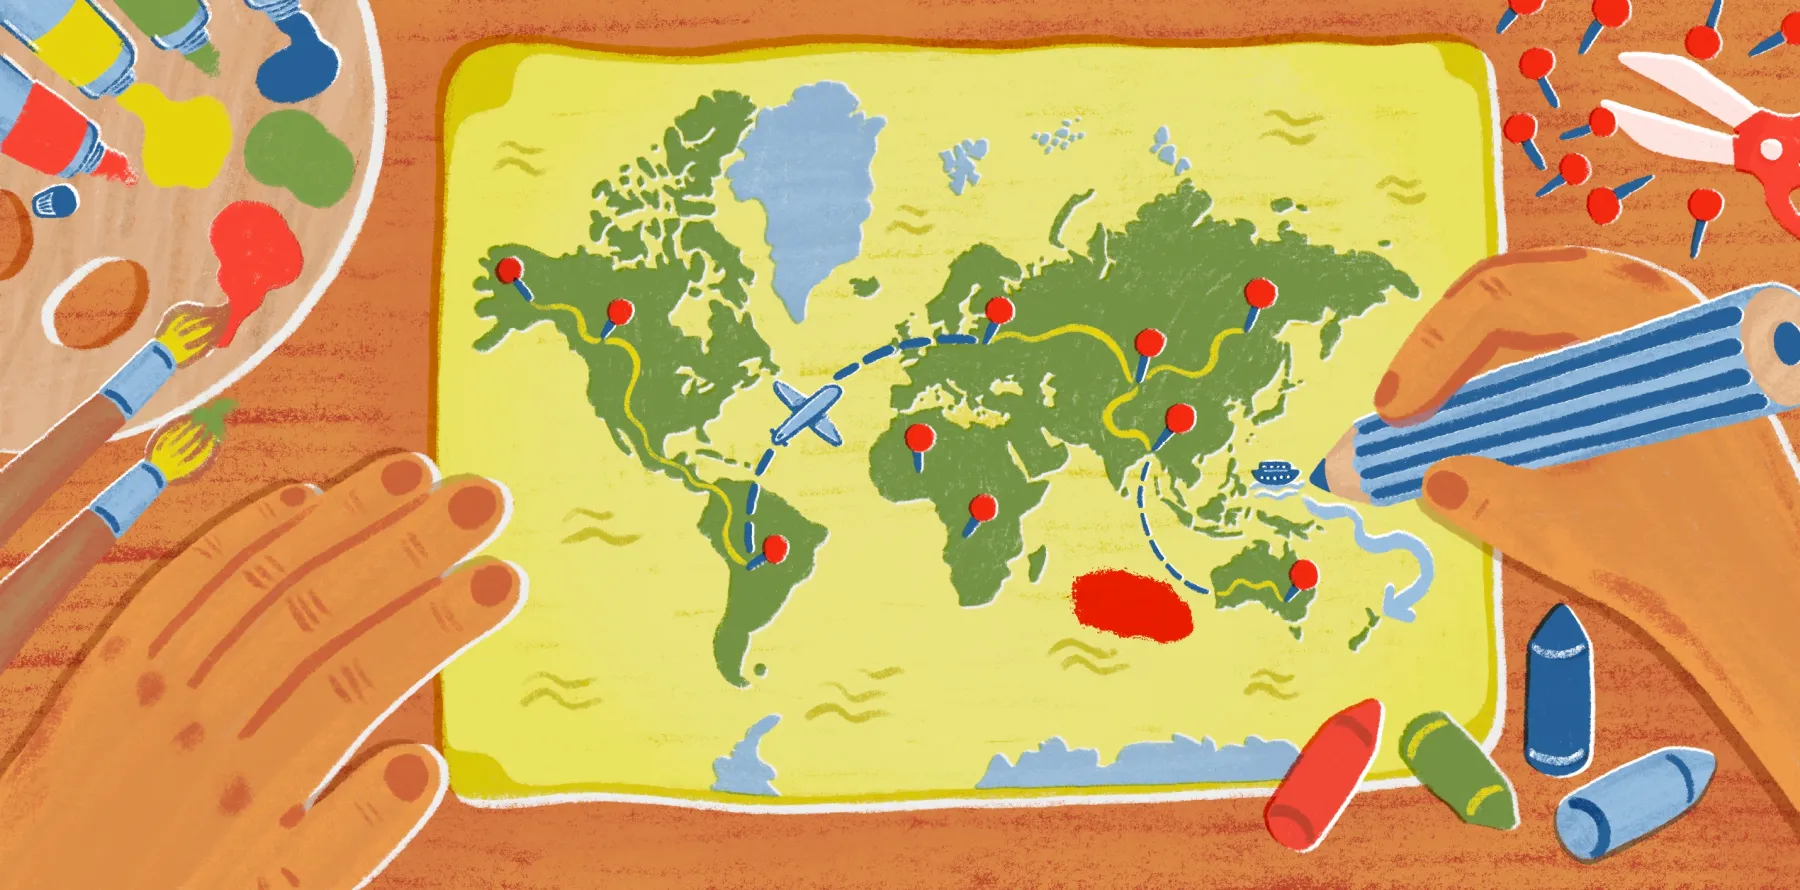
The importance of cartography in the real world: 9 examples
The importance of cartography is seen throughout history. Even the earliest civilizations relied on maps to guide travel, define territories, and manage their resources. Modern cartographers have refined map design, and today, we have digital tools to help represent increasingly complex datasets. The best maps don’t just show geography — they reveal patterns and relationships that help us understand the world.
Learn why cartography is essential and how it applies across industries and use cases.
What’s cartography? Meaning and benefits
Cartography is the science and technology of creating maps. This practice takes geographic data and turns it into compelling visuals that help us interpret location, distance, and spatial relationships.
Understanding cartography goes deeper than learning how to draw a map. In the modern day, professionals use advanced AI tools like geographic information systems (GIS) to analyze data and design detailed charts.
This discipline benefits millions of people daily. Here are a few ways cartography shows up in real life:
- Easier navigation: People rely on cartography to navigate land and sea, from using detailed topographic maps to opening a GPS.
- Clearer communication: Maps uncover hidden patterns and relationships in data, helping people understand and articulate complex, location-based information.
- Better planning: Governments, businesses, and researchers use cartography to analyze spatial data and guide decisions, improving resource management and project outcomes.
- Deeper knowledge: Cartographers use advanced map making techniques to help communities visualize geographic data and analyze human activity.
What’s a cartographer? Definition and key functions
A cartographer is a professional who creates maps and charts to visually represent geographic data. They combine technical skills, like data collection and analysis, with creative and problem-solving abilities to design engaging, interactive maps. While cartographers have broad expertise, their greatest strengths include GIS software proficiency, analytical thinking, and attention to detail.
Most cartographers perform similar functions. Here are their usual duties:
- Creating maps: Cartographers collect and analyze geographic data to produce different types of maps (such as topographic and hematic maps) that support navigation and research.
- Enhancing visualization: These professionals use modern mapping software to turn massive datasets into something tangible. This lets teams see historic changes and area conditions with bold colors and clear lines.
- Improving decision making: Cartographers provide critical insights for government and businesses. For instance, these professionals might uncover a hurricane zone before a real estate development project begins.
9 real-world examples of how people use cartography
Cartographers use geospatial maps to solve problems in many different industries, from improving crop conditions to managing utilities. Here are some practical examples of cartographic applications.
1. Geography
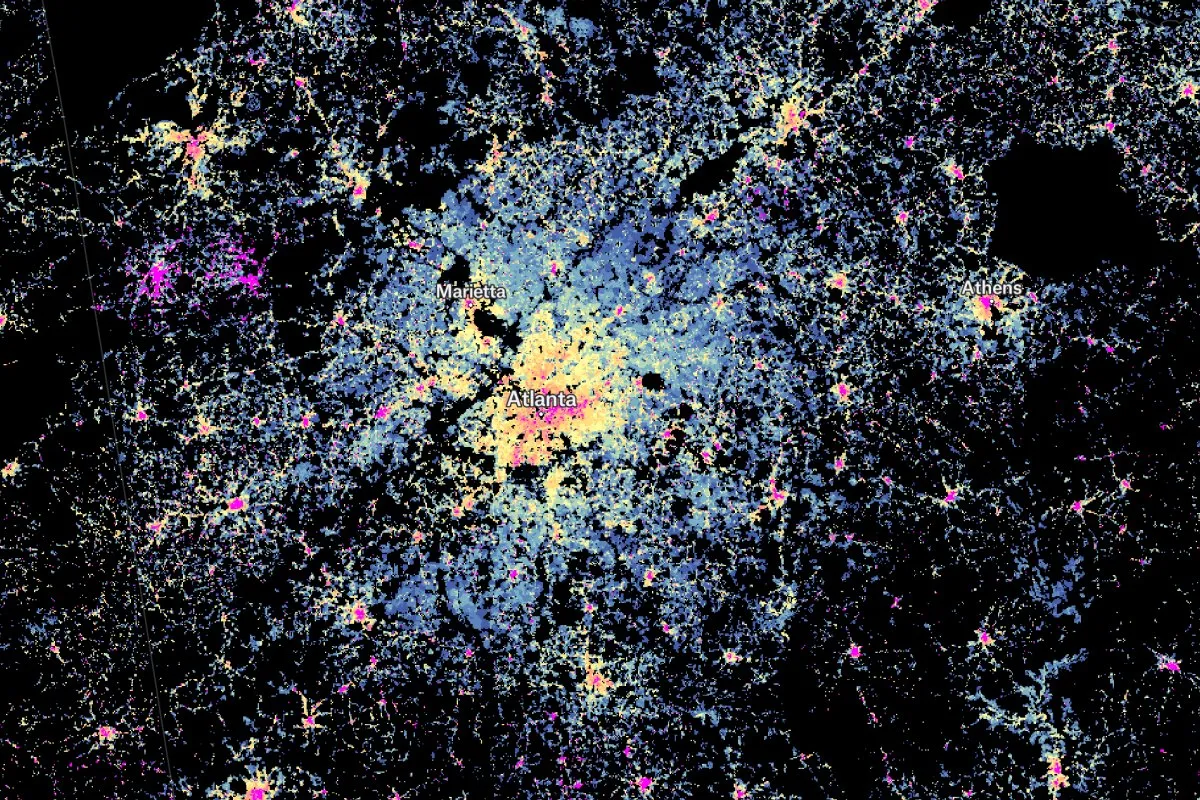
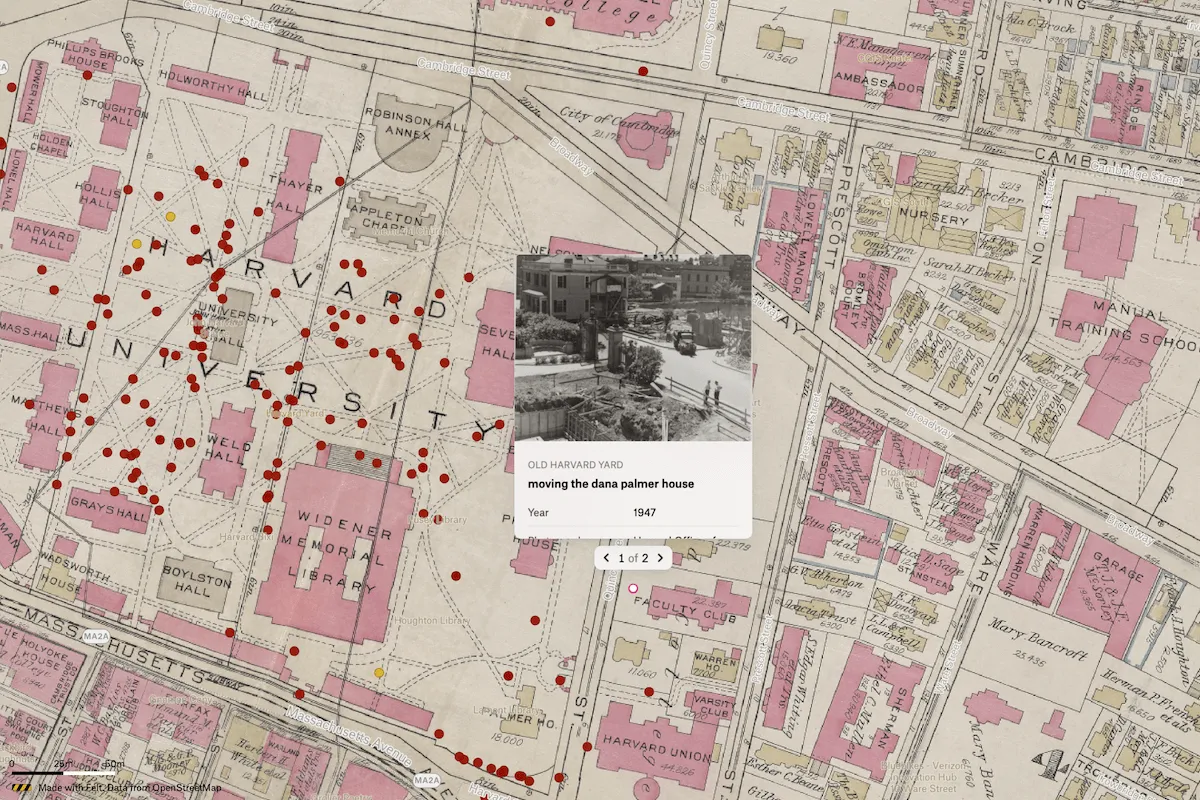
Geographers study maps to explore landforms, track population patterns, and observe environmental changes over time.
For example, topographic and thematic maps reveal how natural features relate to human settlement and land use. These insights guide analysis in industries like urban development and conservation.
2. Technology
Technology companies rely on cartography to power digital platforms, including location-based services and navigation apps. More specifically, these companies leverage GIS and satellite imagery to create interactive maps that update instantly and respond to user behavior. For instance, every time you check your maps app for traffic updates, that information is typically delivered via GIS.
Cartography’s influence expands beyond the basics. In emerging technologies like delivery drones and self-driving vehicles, modern mapping provides the guidance that helps them avoid obstacles and stay compliant.
3. Agriculture
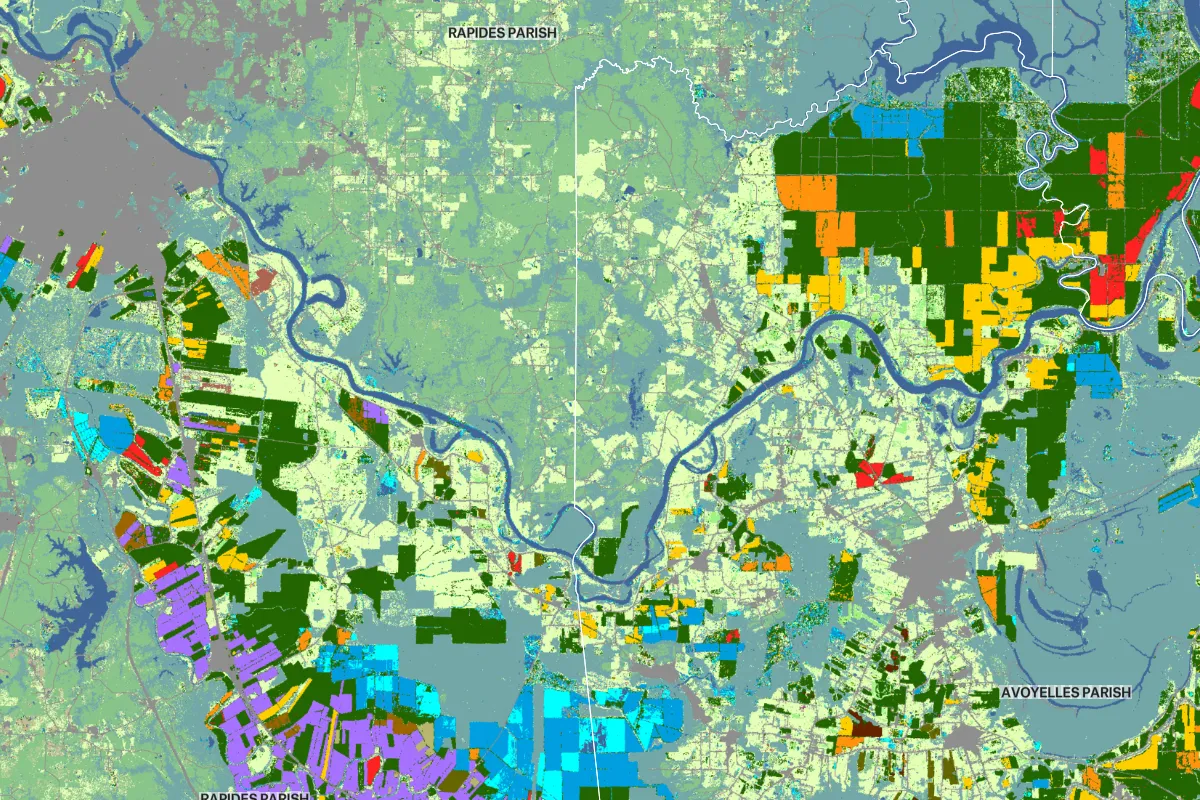
Modern cartography helps farmers make data-driven decisions about land and crops. Cartographers build maps from satellite imagery to highlight natural conditions, like soil quality and crop health. Farmers can then use these maps to plan irrigation and apply fertilizer more efficiently.
GIS mapping highlights variations within fields that aren’t visible on the ground, like subtle elevation changes and nutrient deficiencies. With this information and oversight, farmers can better manage their resources and improve overall yield.
4. Business
Businesses understand their customers’ needs and preferences with cartography, meaning they use maps to inform projects and produce better outcomes. They study everything from demographics to buying habits and apply these insights to make targeted decisions. This might include choosing new store locations or optimizing delivery routes.
Interactive maps are far more helpful than basic spreadsheets, displaying multiple layers of information and their relationships at a glance. They’re comprehensive and accessible, allowing businesses to quickly share the results with stakeholders.
5. Education
Teachers use maps to explain geography, history, and global events in a more engaging way than traditional lectures and textbooks. This allows students to visualize complex ideas and develop spatial awareness. For example, an urban studies curriculum may require students to explore a local map and track community health over a given period.
6. Governments
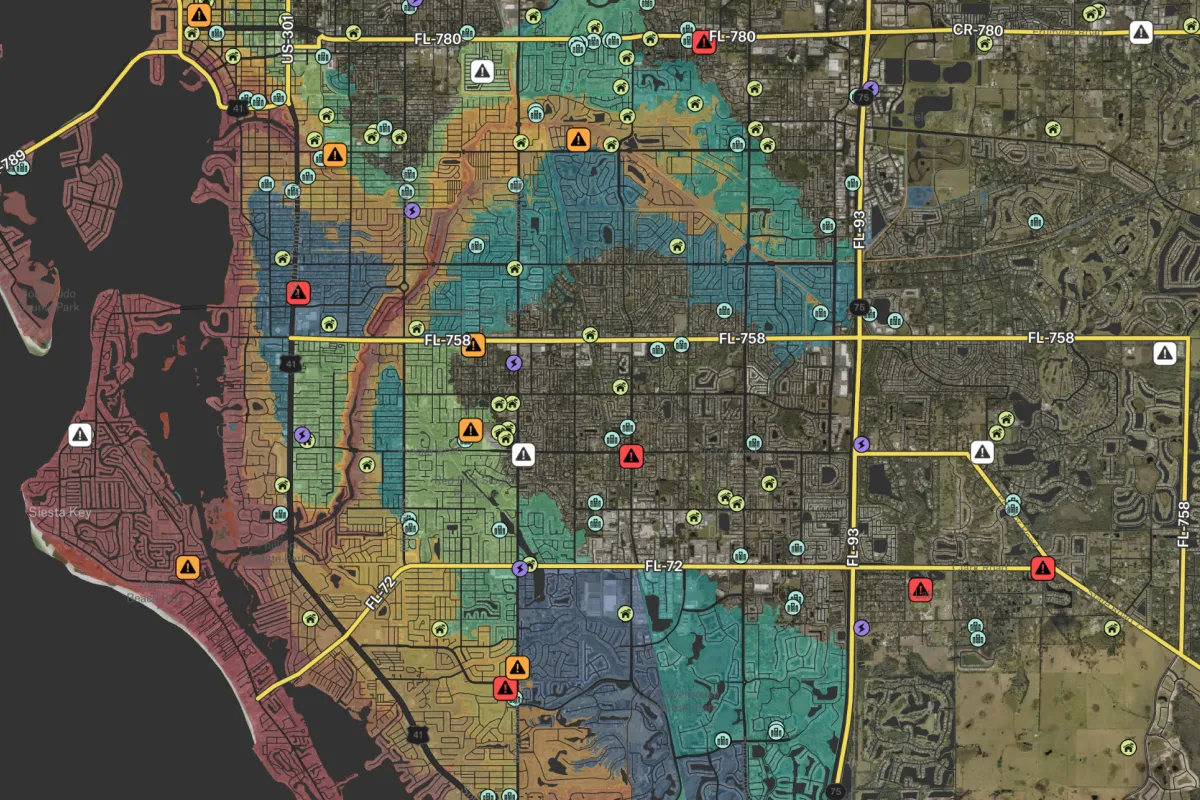
City administration teams use maps to plan growth and manage infrastructure. Urban planners, for example, use GIS to analyze zoning and monitor population growth.
Maps also let governments pinpoint high-risk areas like flood-prone neighborhoods and regions susceptible to wildfires. This information helps cities coordinate emergency response efforts and make sure critical services reach communities in need.
7. Utilities
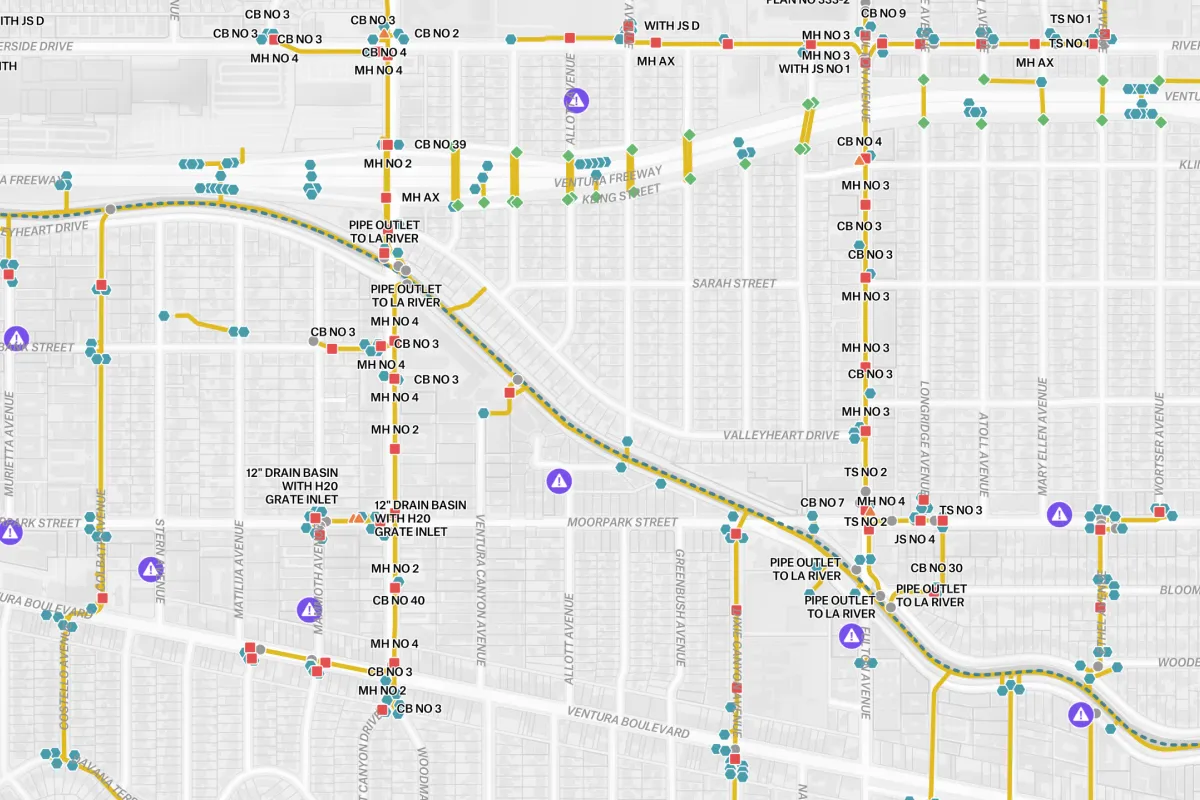
Utility companies use cartography for many applications, including managing water systems, electrical grids, and gas pipelines. Real-time information translates to greater efficiency and enhanced public safety for every service area.
Teams often reference detailed service and maintenance maps, letting them respond to outages faster and cut down on service disruptions. Using GIS, utility companies can even track environmental impacts and usage patterns to assess and mitigate risks.
8. Telecom
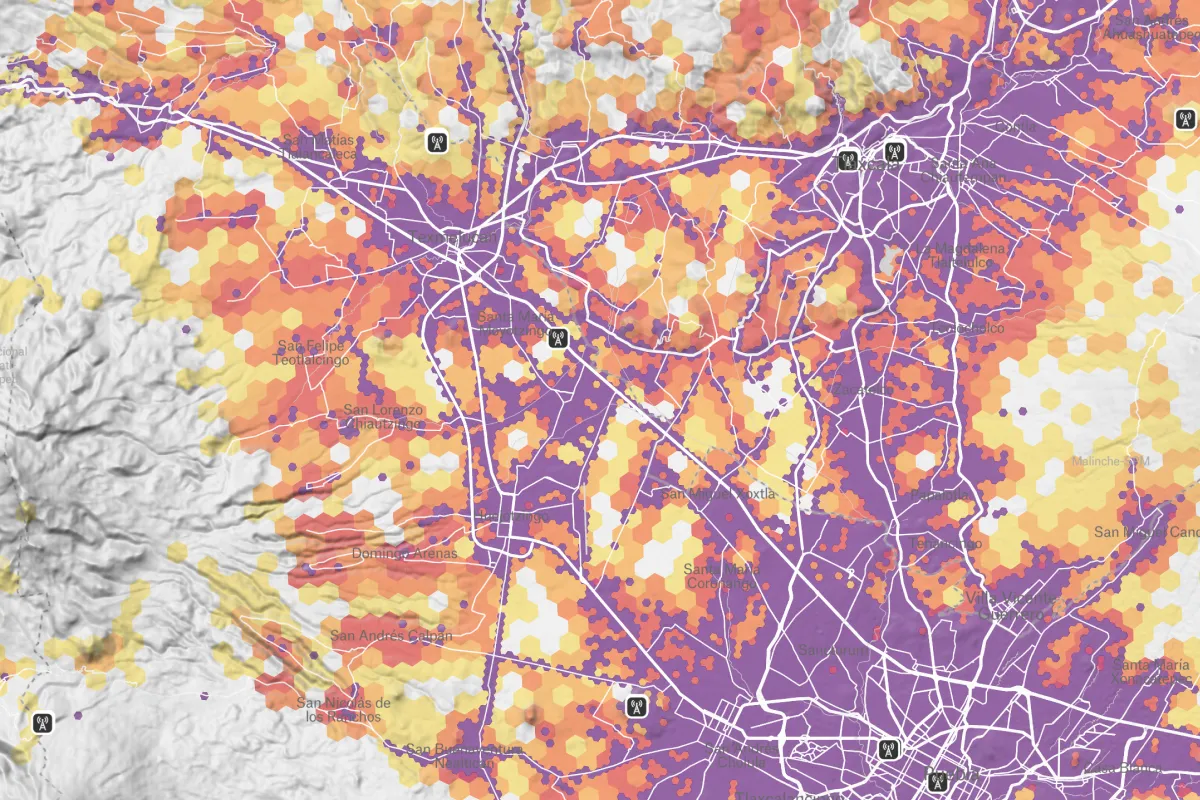
Many telecom providers use maps on terrain, population density, and signal strength to design new networks and maintain existing ones. GIS and spatial analysis also reveal gaps in coverage. This helps providers upgrade their service and find the best locations for network expansion.
9. Transportation
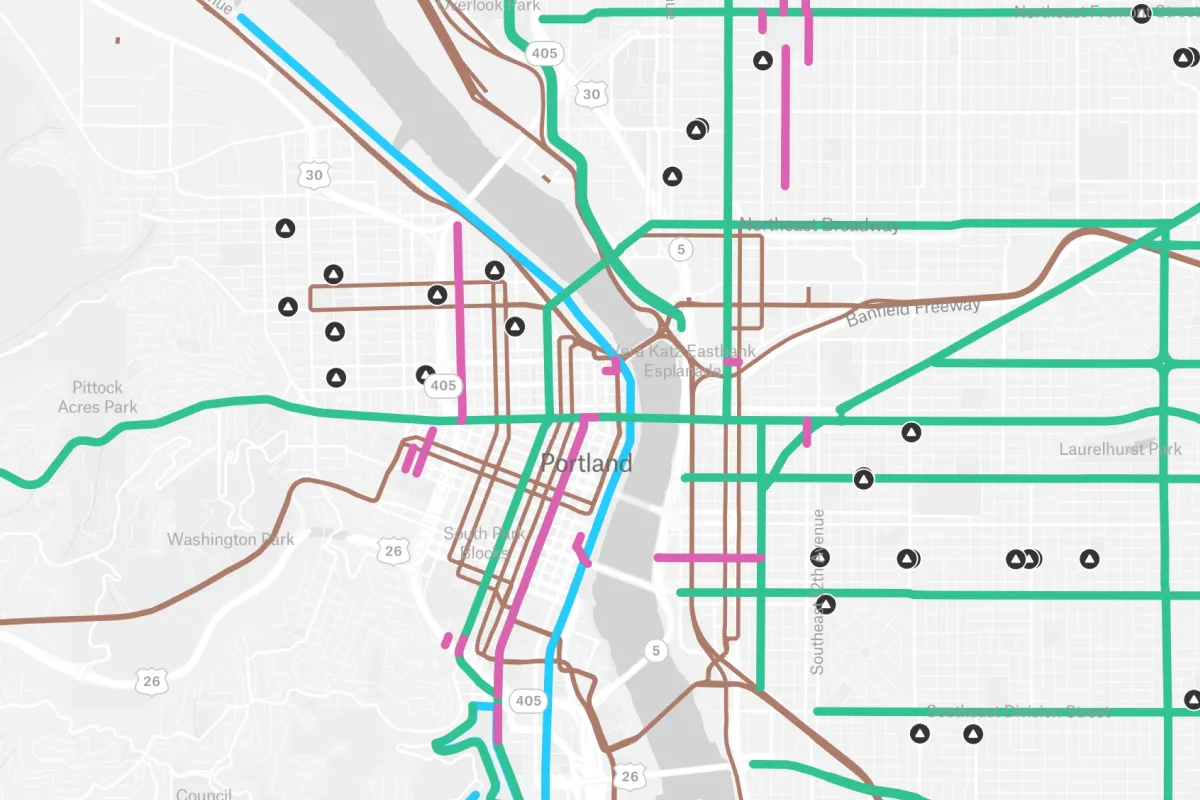
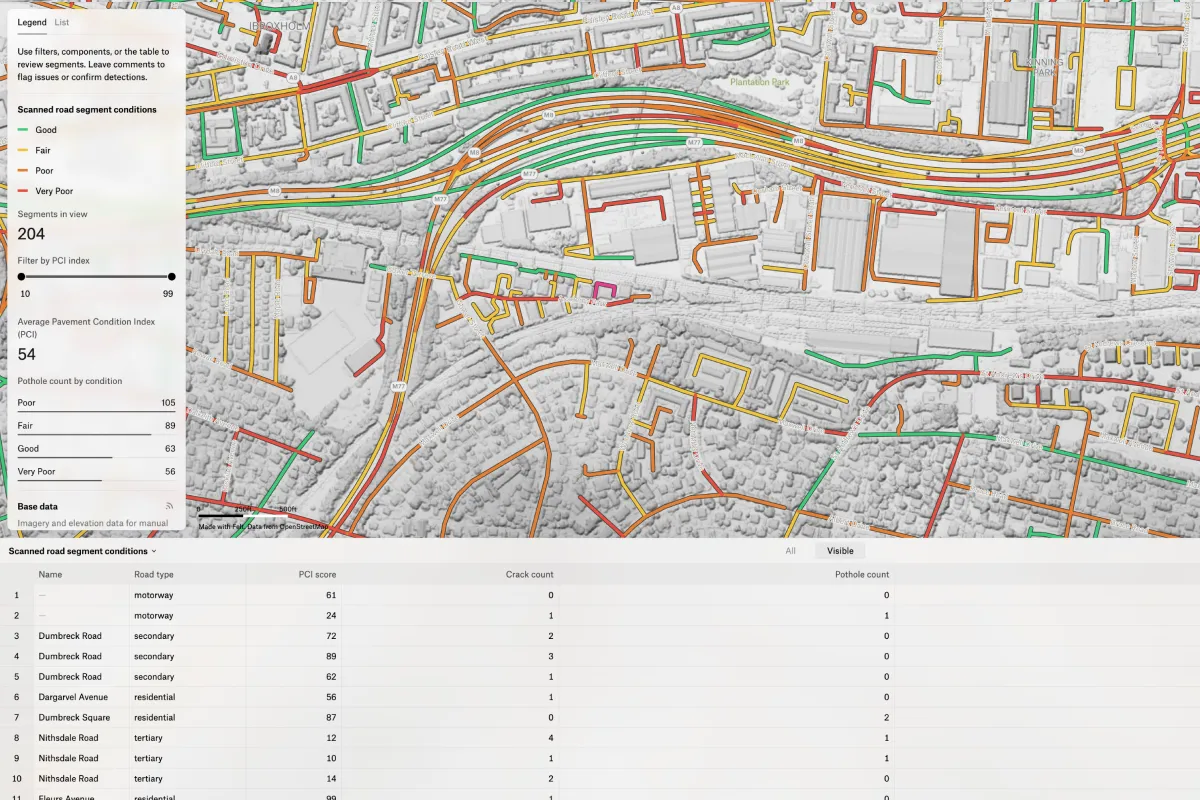
Transportation agencies plan routes and improve mobility using a variety of cartographic methods. Analyzing maps on road networks and traffic patterns helps these agencies reduce road congestion, boost safety, and design efficient transport systems.
Logistics companies also use cartography to optimize delivery routes and supply chains. For example, UPS uses advanced mapping to plan shipping routes that lower fuel consumption and operational costs.
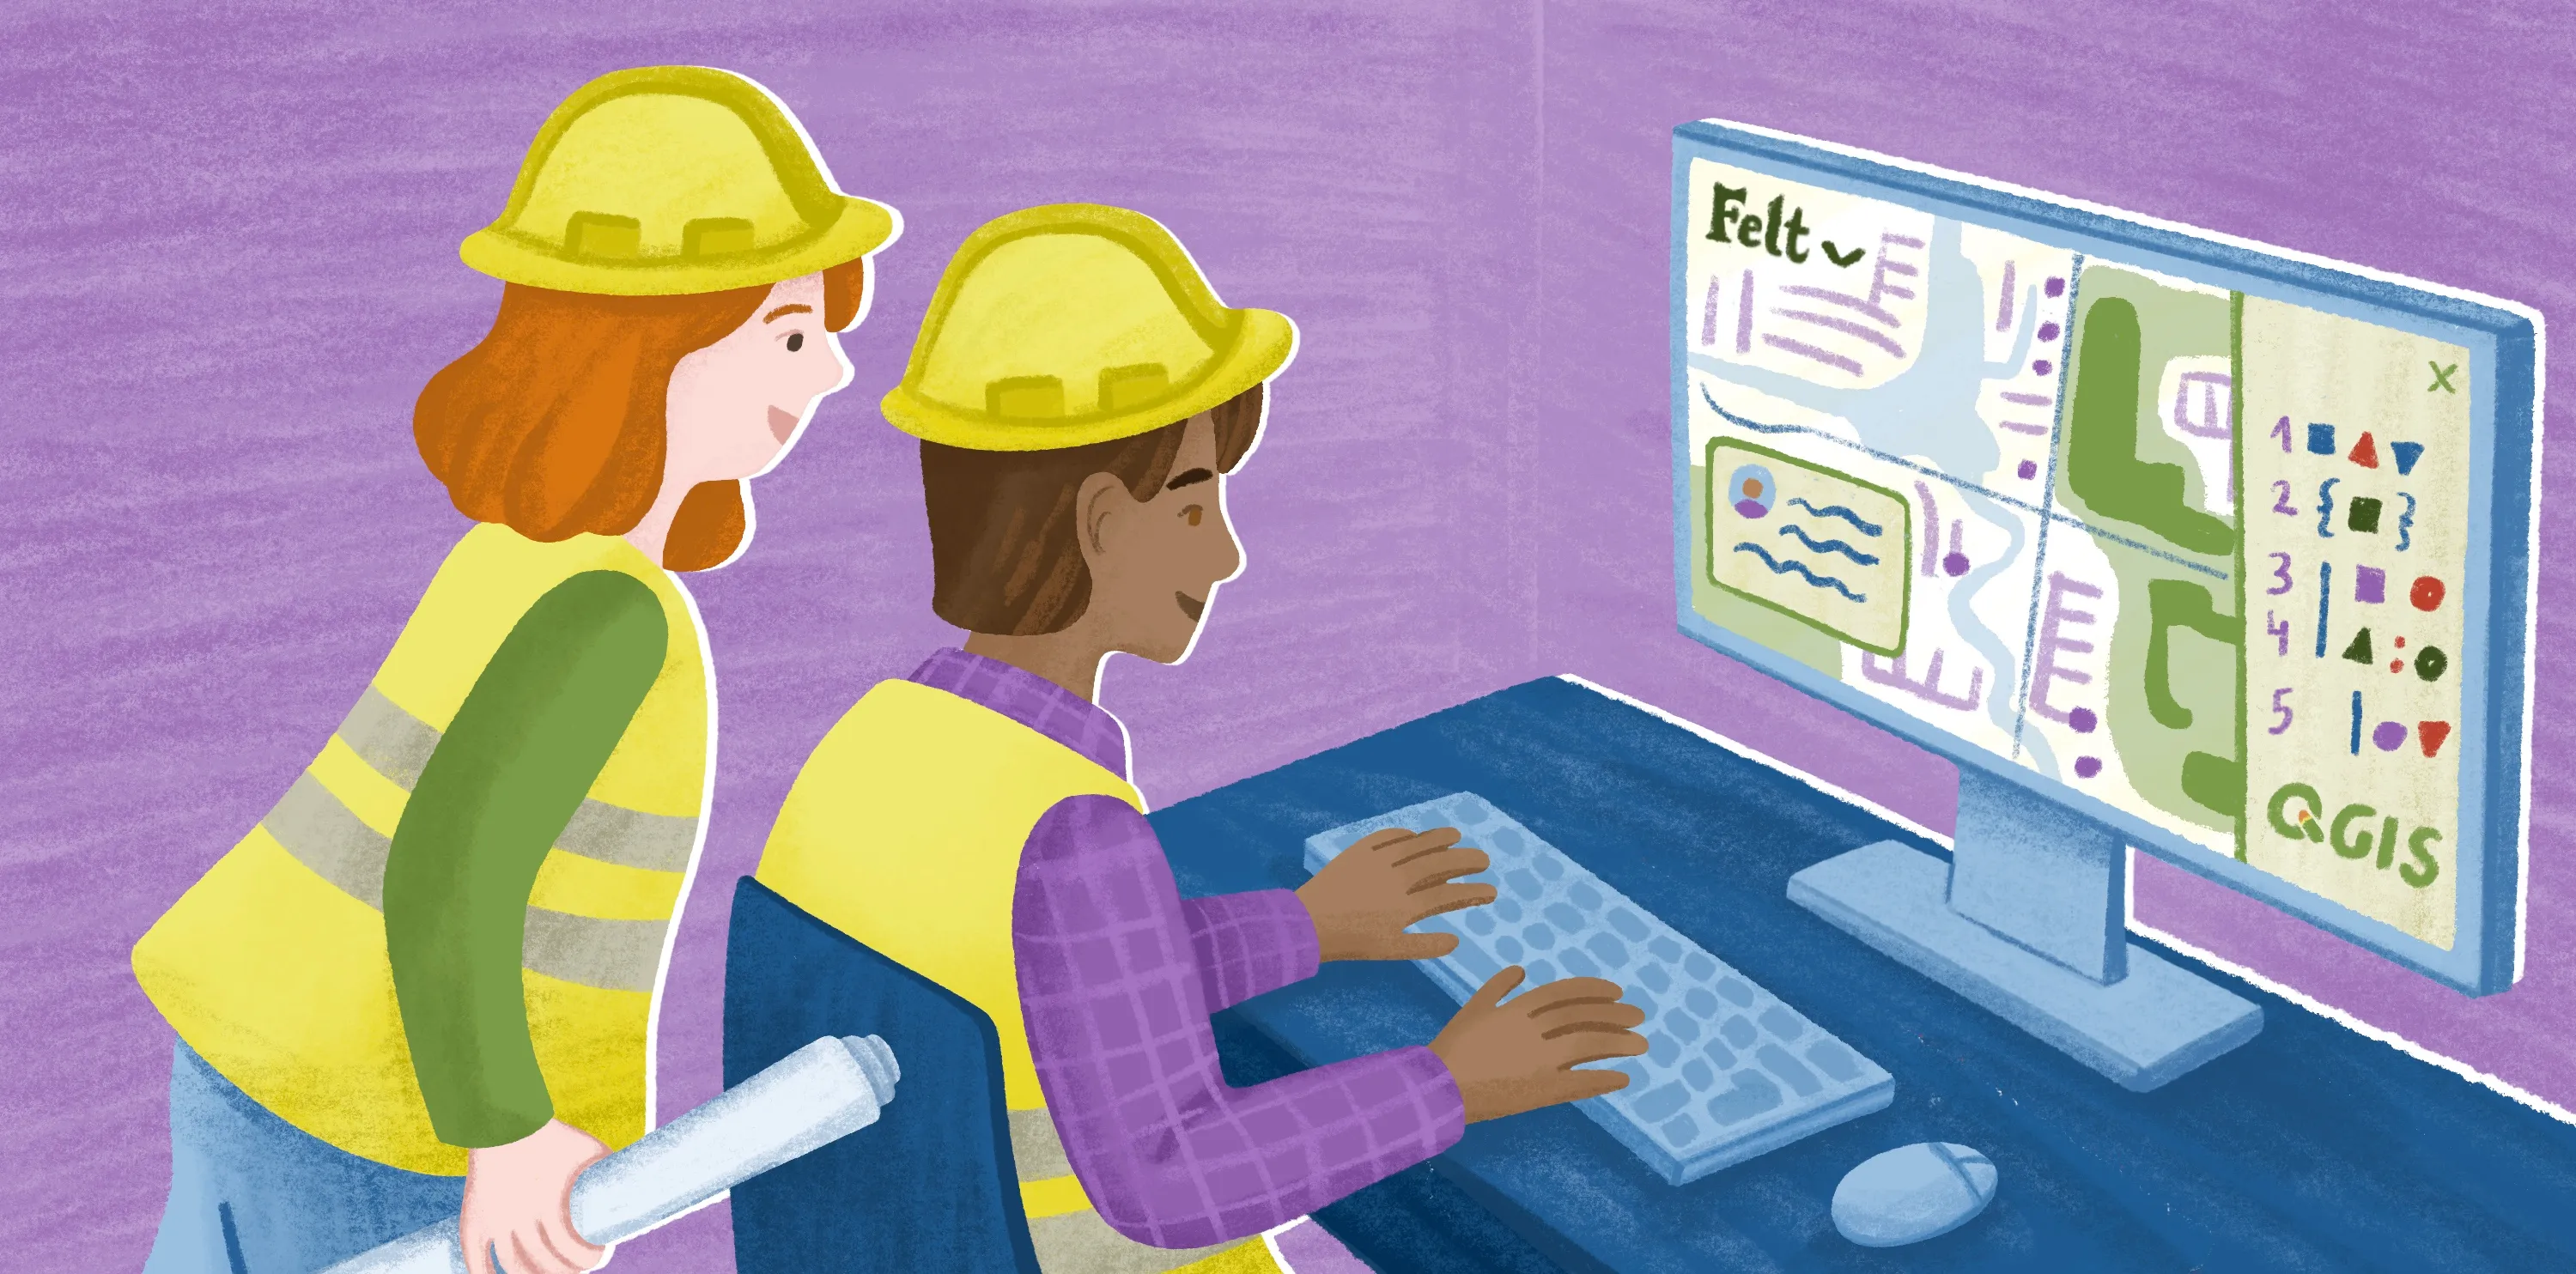
Discover the future of mapping with Felt
Cartography continues to shape our understanding of the world and help many industries plan, study, and solve problems. These applications need advanced tools, so modern map makers rely on GIS software like Felt to make spatial data more accessible.
Felt lets you compare data and discover impactful real-world patterns effortlessly. Upload any file type, from CSV to GeoJSON, and design a striking, intuitive map with a few clicks. Study massive datasets, reveal actionable insights, and share the results via a simple link.
Explore Felt to transform geographic data into collaborative maps that bring your projects to life.
FAQ
Why is cartography still important in modern data visualization?
Cartography turns complex spatial data into clear visual representations. This allows for deep analysis beyond simple documents and spreadsheets. Modern maps help businesses and governments understand the real world and make informed decisions, from choosing construction sites to mitigating forest fires.
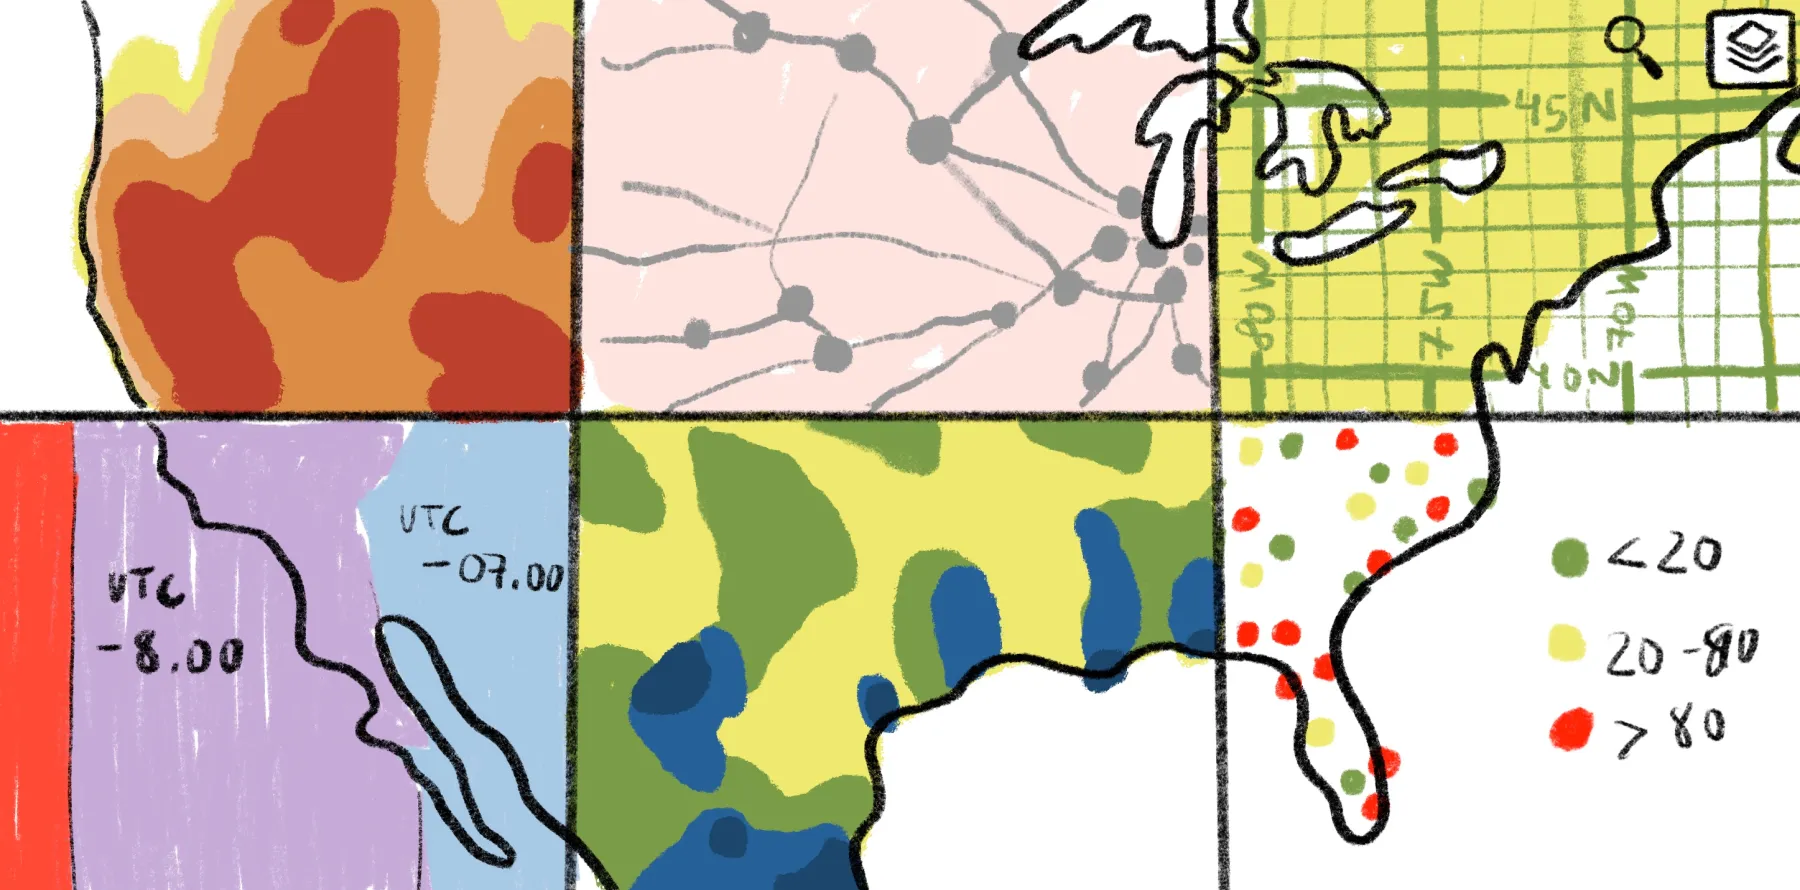
What are the different types of maps?
There are many different types of maps, and they all serve a specific purpose. Some, like physical and topographic maps, give a general picture of places and landscapes. Others focus on a single theme — such as population or climate — and are used by many different teams for unique applications.
Compare Felt using AI


.jpg)
.jpg)