Land use mapping: How land is mapped and analyzed
It’s easy to look at a map and just see lines and symbols. Land use mapping changes that by revealing how people shape the land. It shows us where to build, which areas to preserve, and how different activities interact across the terrain. With the help of land mapping, planners and community leaders can make decisions that balance growth with local needs.
This guide breaks down what land use mapping is and how it works, plus the tools you need to do it well. By the end, you’ll understand the basics of land mapping and how it applies to real-world decision-making.
What is land use mapping?
Land use mapping identifies how people use the land around them. It takes a specific geographic location and visualizes human activity in that area. This includes:
- Residential zones
- Agricultural fields
- Industrial sites
- Recreational developments
It’s easy to confuse land use with land cover. Land cover mapping looks at what’s physically present on the surface — like vegetation or water. Land use mapping reveals how people interact with and manage that space. For instance, a grassy field (cover) could be a park, pasture, or community garden (use).
Because the two are closely linked, they’re often analyzed together in land use land cover (LULC) mapping. Studying both datasets gives you a more detailed view of a place.
Precise land use maps are the starting point for bigger decisions, from environmental assessments to planning large-scale infrastructure like highways and water management systems.
Land use mapping applications
Mapping land provides insight into land use patterns as well as guidance for future projects. Here are common land use mapping examples in different industries.
Urban planning and zoning
City planners and local governments use land maps to see how neighborhoods, commercial areas, and public spaces fit together. These insights are often visualized with choropleth maps, which use color to show differences across geographic areas. With this information, urban planners can design more livable and balanced communities that avoid overcrowding.
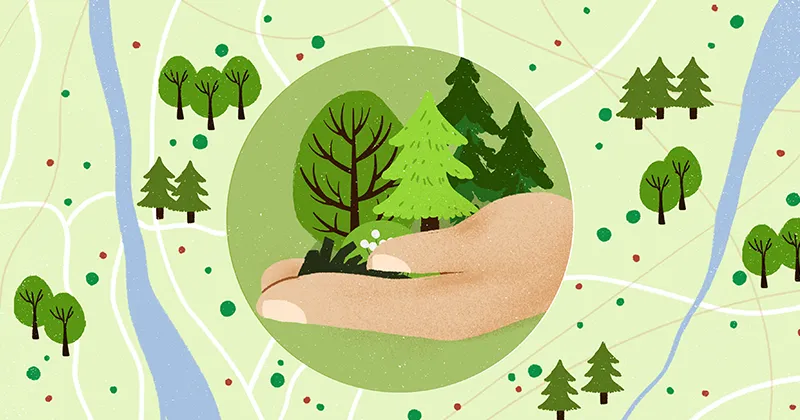
Environmental monitoring and conservation
Thanks to land use mapping, conservationists and ecologists can track changes in forests and wetlands and assess rates of deforestation and reforestation. This data also helps teams spot areas at risk of urban expansion and manage natural resources more effectively.
Agriculture and land management
Land use mapping is invaluable for planning crops and monitoring soil and water resources. It helps farmers and land managers understand vegetation health and seasonal changes. These insights support sustainable agriculture and reduce risks tied to drought or erosion.
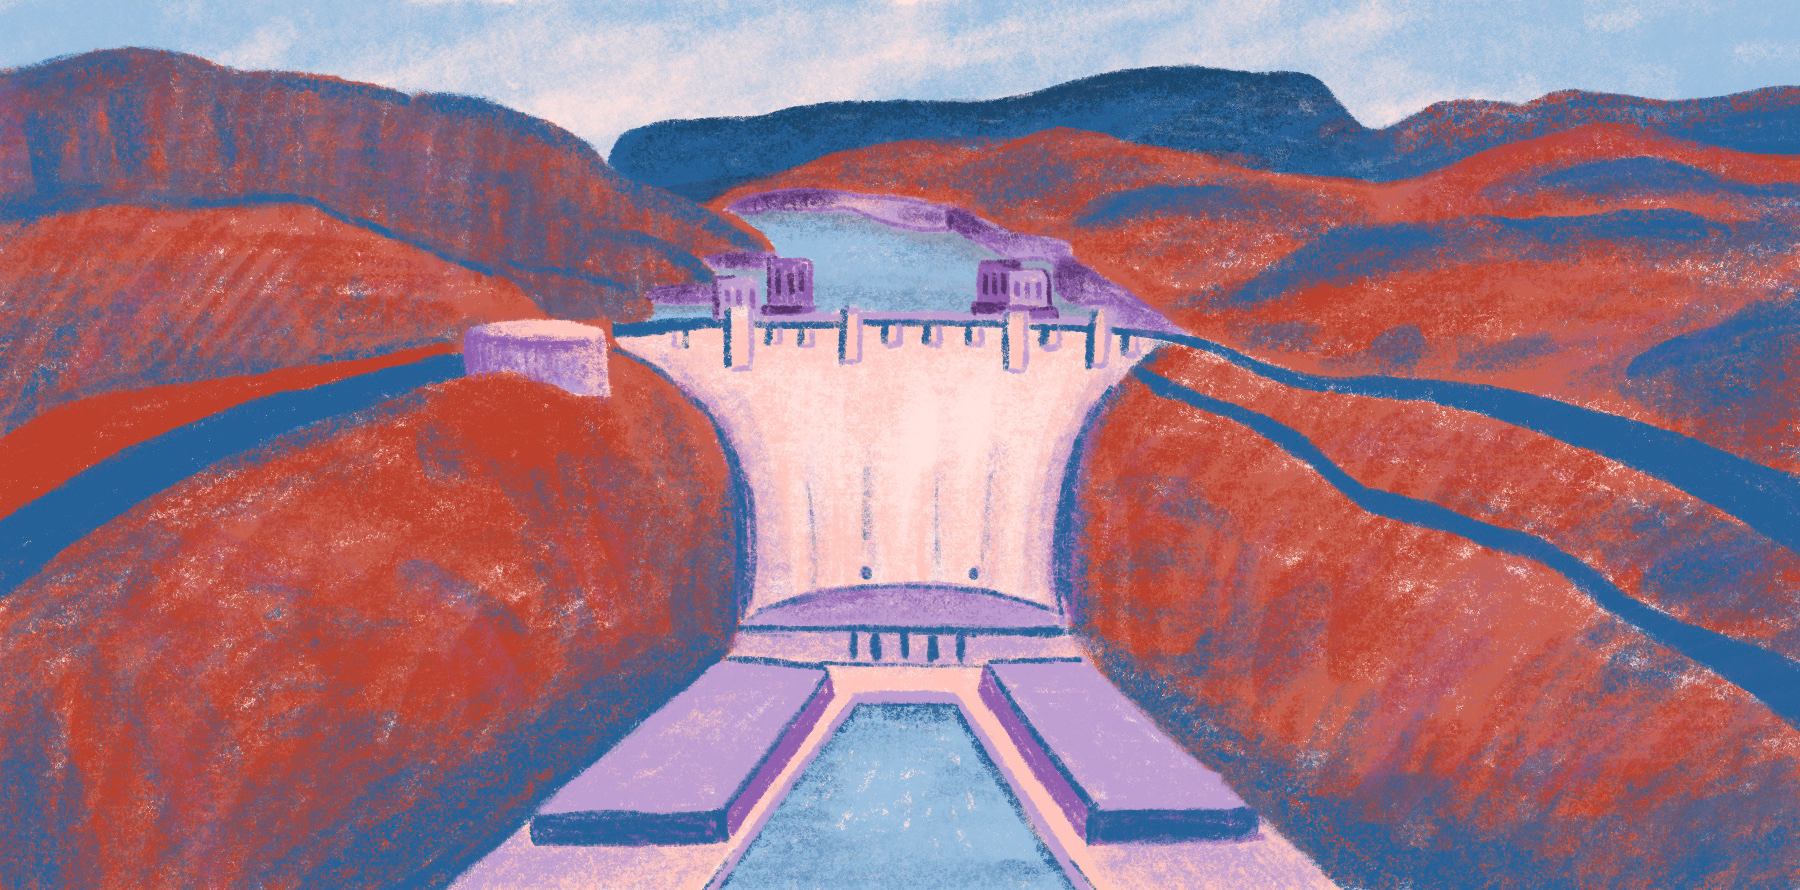
Stormwater and hydrological planning
Municipal engineers turn to land use mapping when they need to understand how water moves across the landscape. These maps show the location of roads and waterways, which help teams design efficient stormwater systems and prevent flooding.
Infrastructure and land development
Developers study land maps when planning where to build roads, utilities, and commercial spaces. Mapping current land use ensures development projects align with community needs and limit environmental impact.
Although the mapping process stays the same, the data sources and land use categories can vary. That flexibility makes land mapping a powerful tool for countless applications.
Common data sources for land use mapping
Maps are only as good as the data behind them. That’s why so many teams combine multiple data sources to get a complete picture of the landscape:
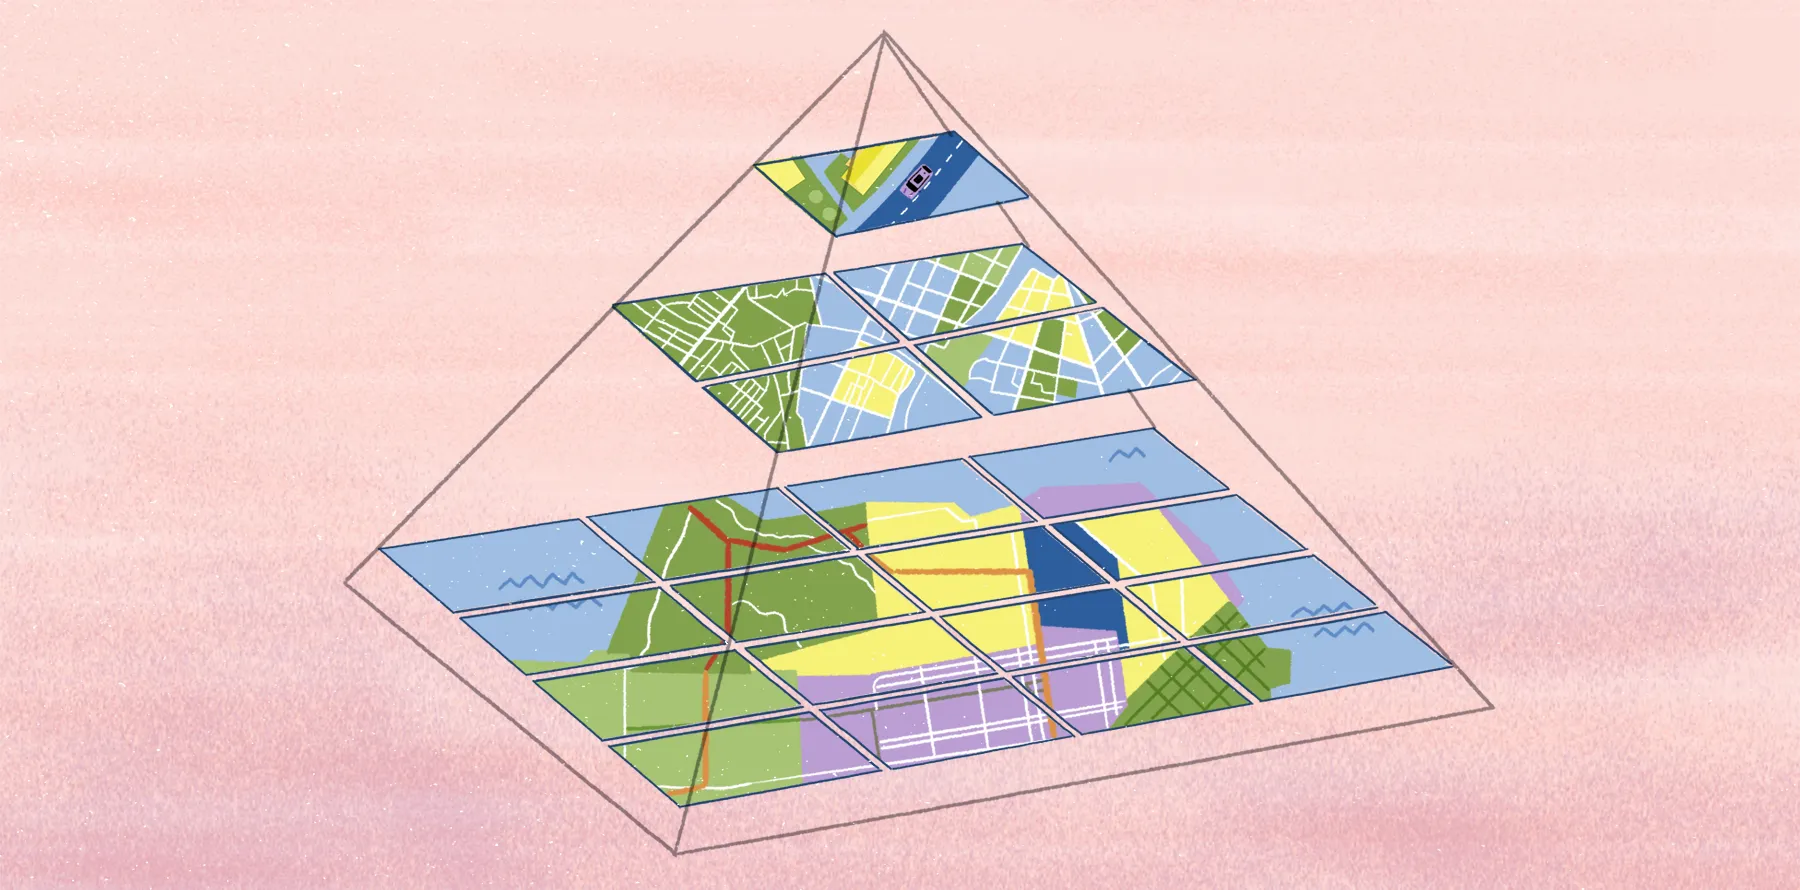
- Satellite imagery: Provides wide-area coverage with frequent updates, relying on sources like Landsat and Sentinel. These images help monitor changes over time, whether that’s large-scale land patterns or environmental shifts.
- Aerial photography: Captures high-resolution overhead images that reveal fine details satellite images might miss. This is useful for mapping urban areas, small agricultural plots, or natural features with complex terrain.
- LiDAR and radar-based remote sensing: Measures elevation and surface features, adding a 3D perspective to flat maps. LiDAR detects features like tree canopies and terrain slopes while radar can see through clouds and vegetation.
- Open geospatial databases: Offer public data on roads, parcels, and administrative boundaries. This information integrates with existing infrastructure and planning tools to give context about the land and improve mapping and analysis.
- Field-collected data: Comes from on-the-ground surveys. It helps validate remote sensing data and record local details like land conditions or human activity.
- Cloud database connections: Link directly to live datasets stored in platforms like BigQuery, Snowflake, and Postgres. This lets maps pull updated parcel records or stream real-time crop sensor data without manual uploads.
Choosing the right data sources comes down to the size of your project and how frequently you need updates. Felt has native support for raster imagery, so you can load Landsat or Sentinel files directly in the browser — or stream cloud-optimized rasters without extra software. You can also add vector layers, like parcels or land use, that update in real time for the whole team.
Pulling from multiple data sources gives you a clearer and more reliable picture than relying on a single dataset.
Land use mapping in GIS
GIS takes raw spatial data and transforms it into searchable land use maps. It does this through a three-step process that guides users from initial data collection to validated, actionable insights:
- Collecting spatial data: Teams gather geospatial data from aerial photos, field observations, and similar sources. By integrating these layers into a GIS workspace, they gain a holistic view of the land that supports strategic decision-making.
- Classifying land use: Data is categorized into land use types, and GIS tools highlight patterns that influence planning and conservation efforts. For example, classifying land use can help conservationists make decisions on habitat restoration.
- Validating and updating data: Teams check maps against real-world conditions through ground surveys or other validation methods like on-site measurements and GPS tracking. Regular updates ensure the data reflects new developments, environmental changes, and shifts in land management practices.
These steps turn spatial data into organized land use information that teams can analyze and apply to planning and policy decisions.
How teams create land use maps with Felt
The real hurdle in land use mapping isn’t just organizing data, but getting those insights into the right hands. Felt helps teams bridge that gap, letting you build, analyze, and update maps directly in a shared browser. It’s the easiest way to layer real-time data and create interactive maps anyone on your team can explore. Everything stays in one collaborative workspace, so everyone works from the same up-to-date map.
A great example comes from the city of Baltimore, which used Felt to engage the public on a new land proposal as part of its Comprehensive Plan update.
Residents, city officials, and other stakeholders provided feedback directly on the Felt map, all without exporting or emailing massive files. This enabled everyone to see proposed changes and contribute insights to land use decisions. The result? A more transparent process where outcomes aligned with community input.
Try it for yourself. Start a free 7-day trial of Felt and build your first land use map in minutes.
FAQ
Can land use maps show changes over time?
Land use maps show changes over time by comparing maps from different dates or using satellite imagery to track urban growth, deforestation, and new agricultural development. This helps planners and conservationists make decisions based on real trends rather than assumptions.
What’s the difference between a land use map and a zoning map?
A land use map tells you how land is used, whether that’s for residential neighborhoods or industrial facilities. A zoning map shows how land is legally allowed to be used according to city and regional regulations. Land use depicts reality on the ground while zoning reflects rules that guide future development.
How detailed can land use maps be?
Land use maps can be highly detailed, down to individual parcels and fields. The level of detail depends on the scale of the project, the resolution of imagery, and the frequency of data updates.
Compare Felt using AI


.jpg)
.jpg)