Topology in GIS: Its basic principles and key applications
A map might look right at first glance, yet small geographic issues often hide beneath the surface. When you focus on the details, key features like boundaries, routes, or parcels may fail to align or connect as expected.
These misalignments aren’t just visual flaws. They point to problems with your topological data that define spatial relationships in geographic information systems (GIS). When those rules break down, maps become unreliable.
In this guide, we’ll break down the basic principles of topology in GIS and its role in building reliable maps. We’ll focus on practical applications and how Felt turns topological data into actionable visualizations.
Understanding the differences between topography vs. topology
In geography, topology and topography describe space in different ways. One focuses on physical forms while the other details how features relate and connect. In mapping and GIS, the distinction determines whether a map describes terrain or the structural relationships within it.
What is topography?
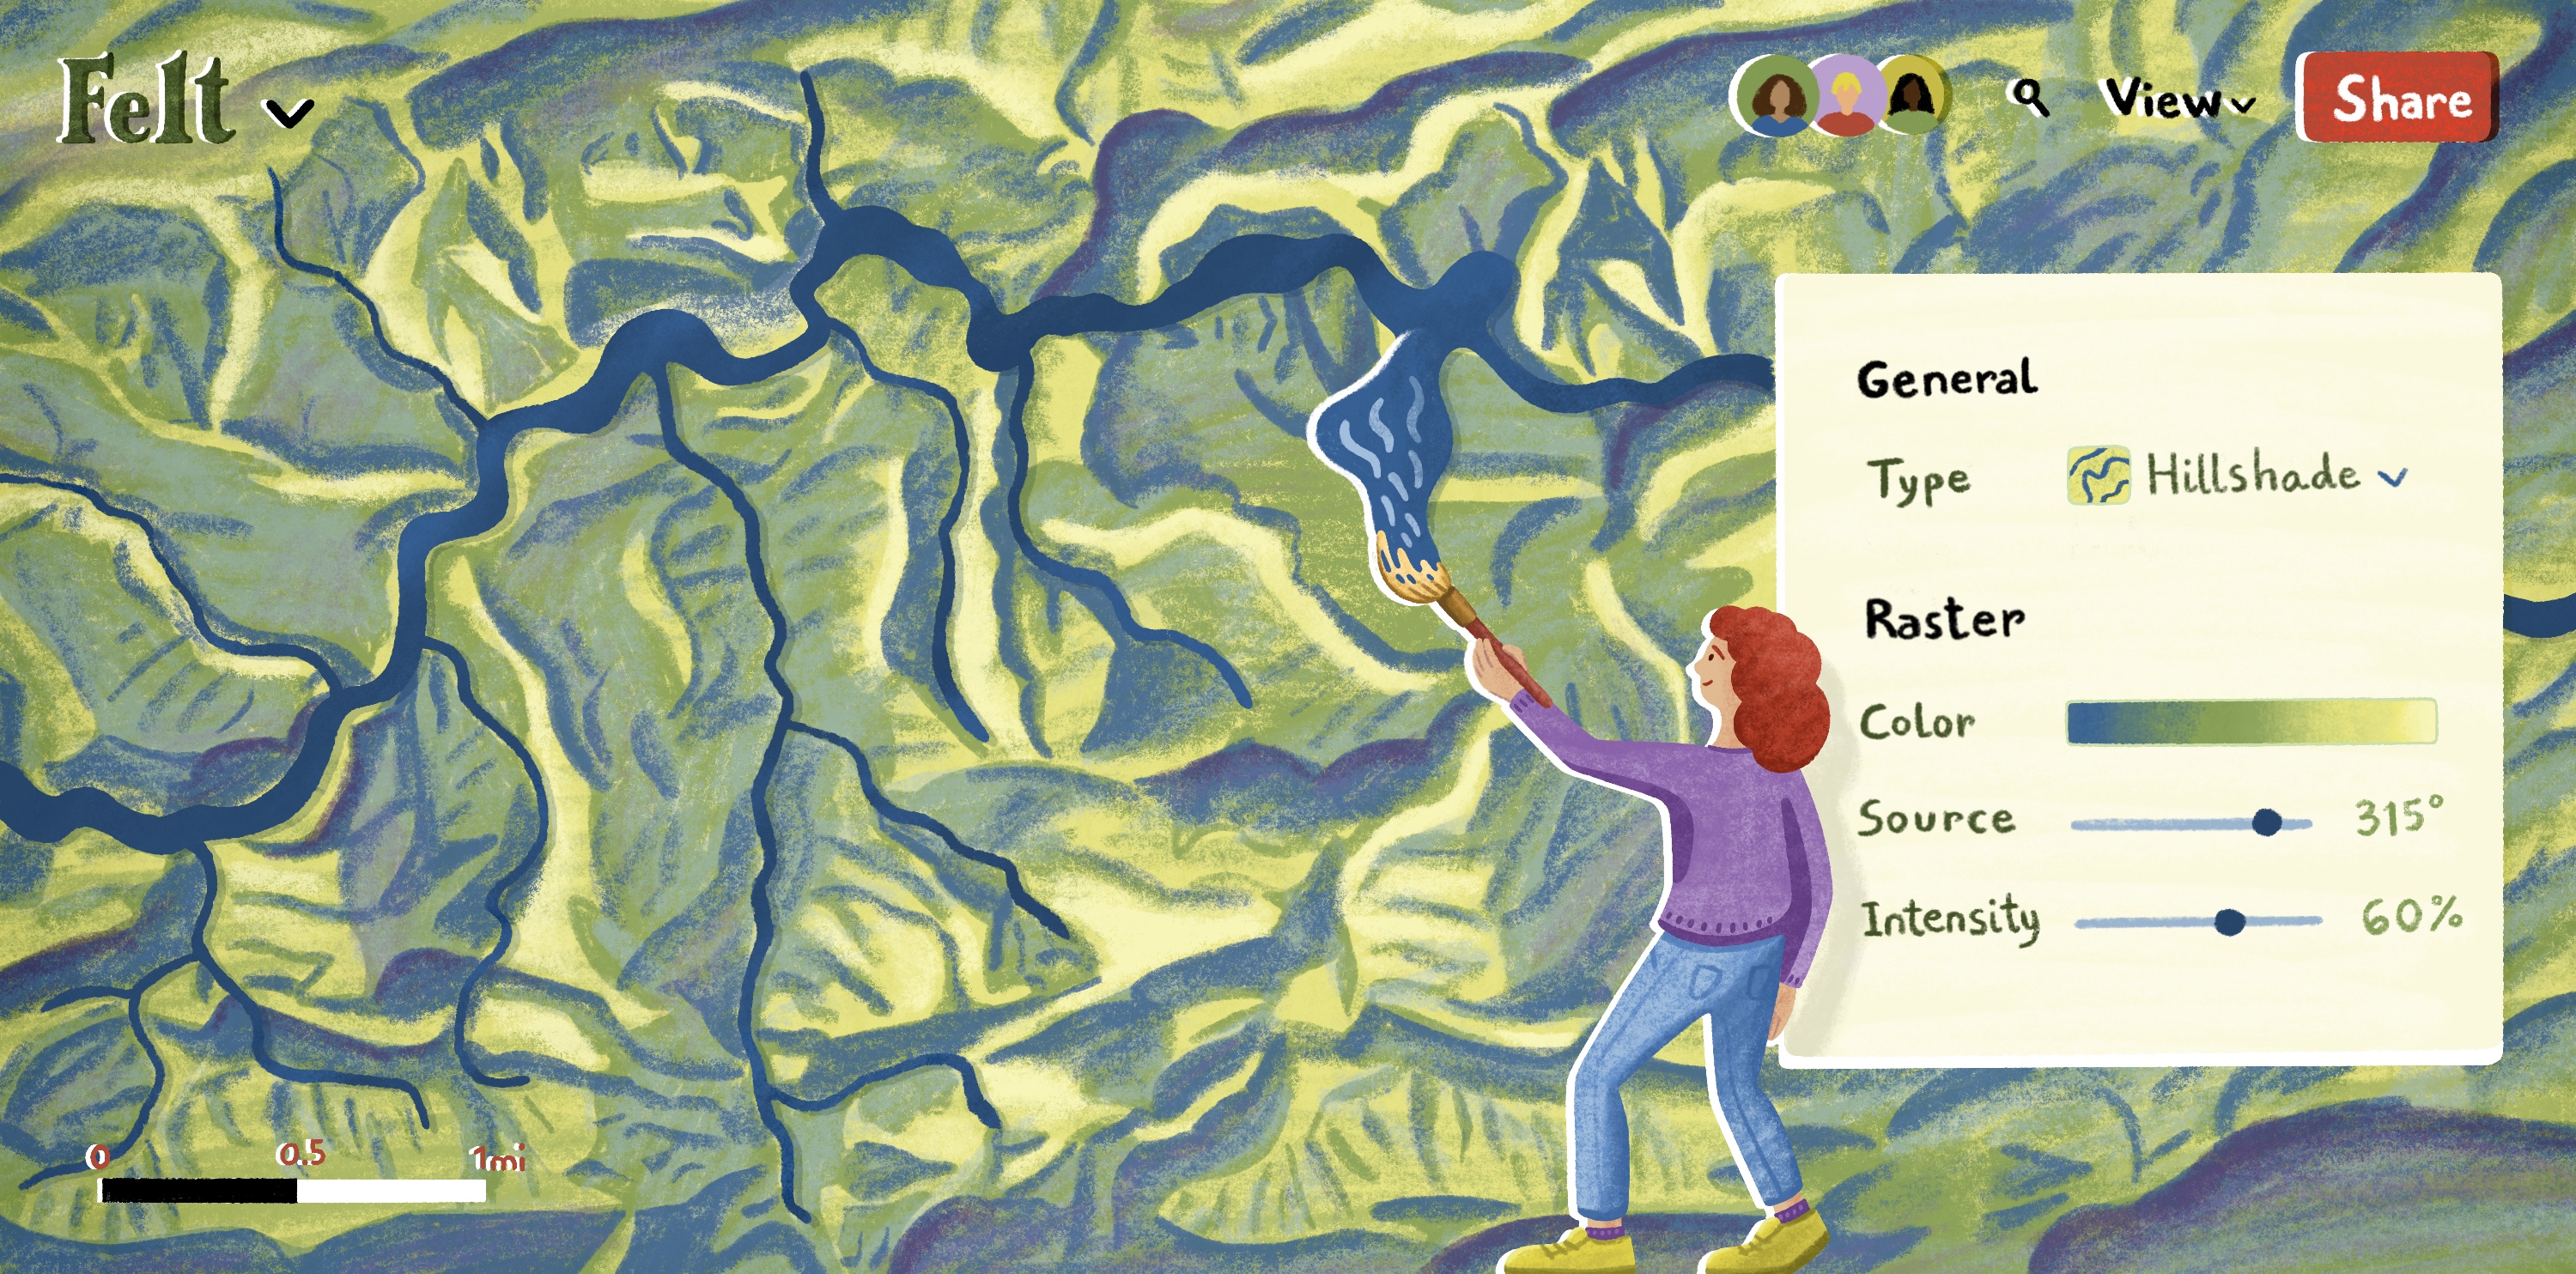
Topography describes the physical form of the Earth’s surface. It highlights features like ridges, valleys, and slopes. Topographic data depicts the Earth’s surface using visual cues like contour lines and shading to represent physical terrain.
What is topology in GIS?
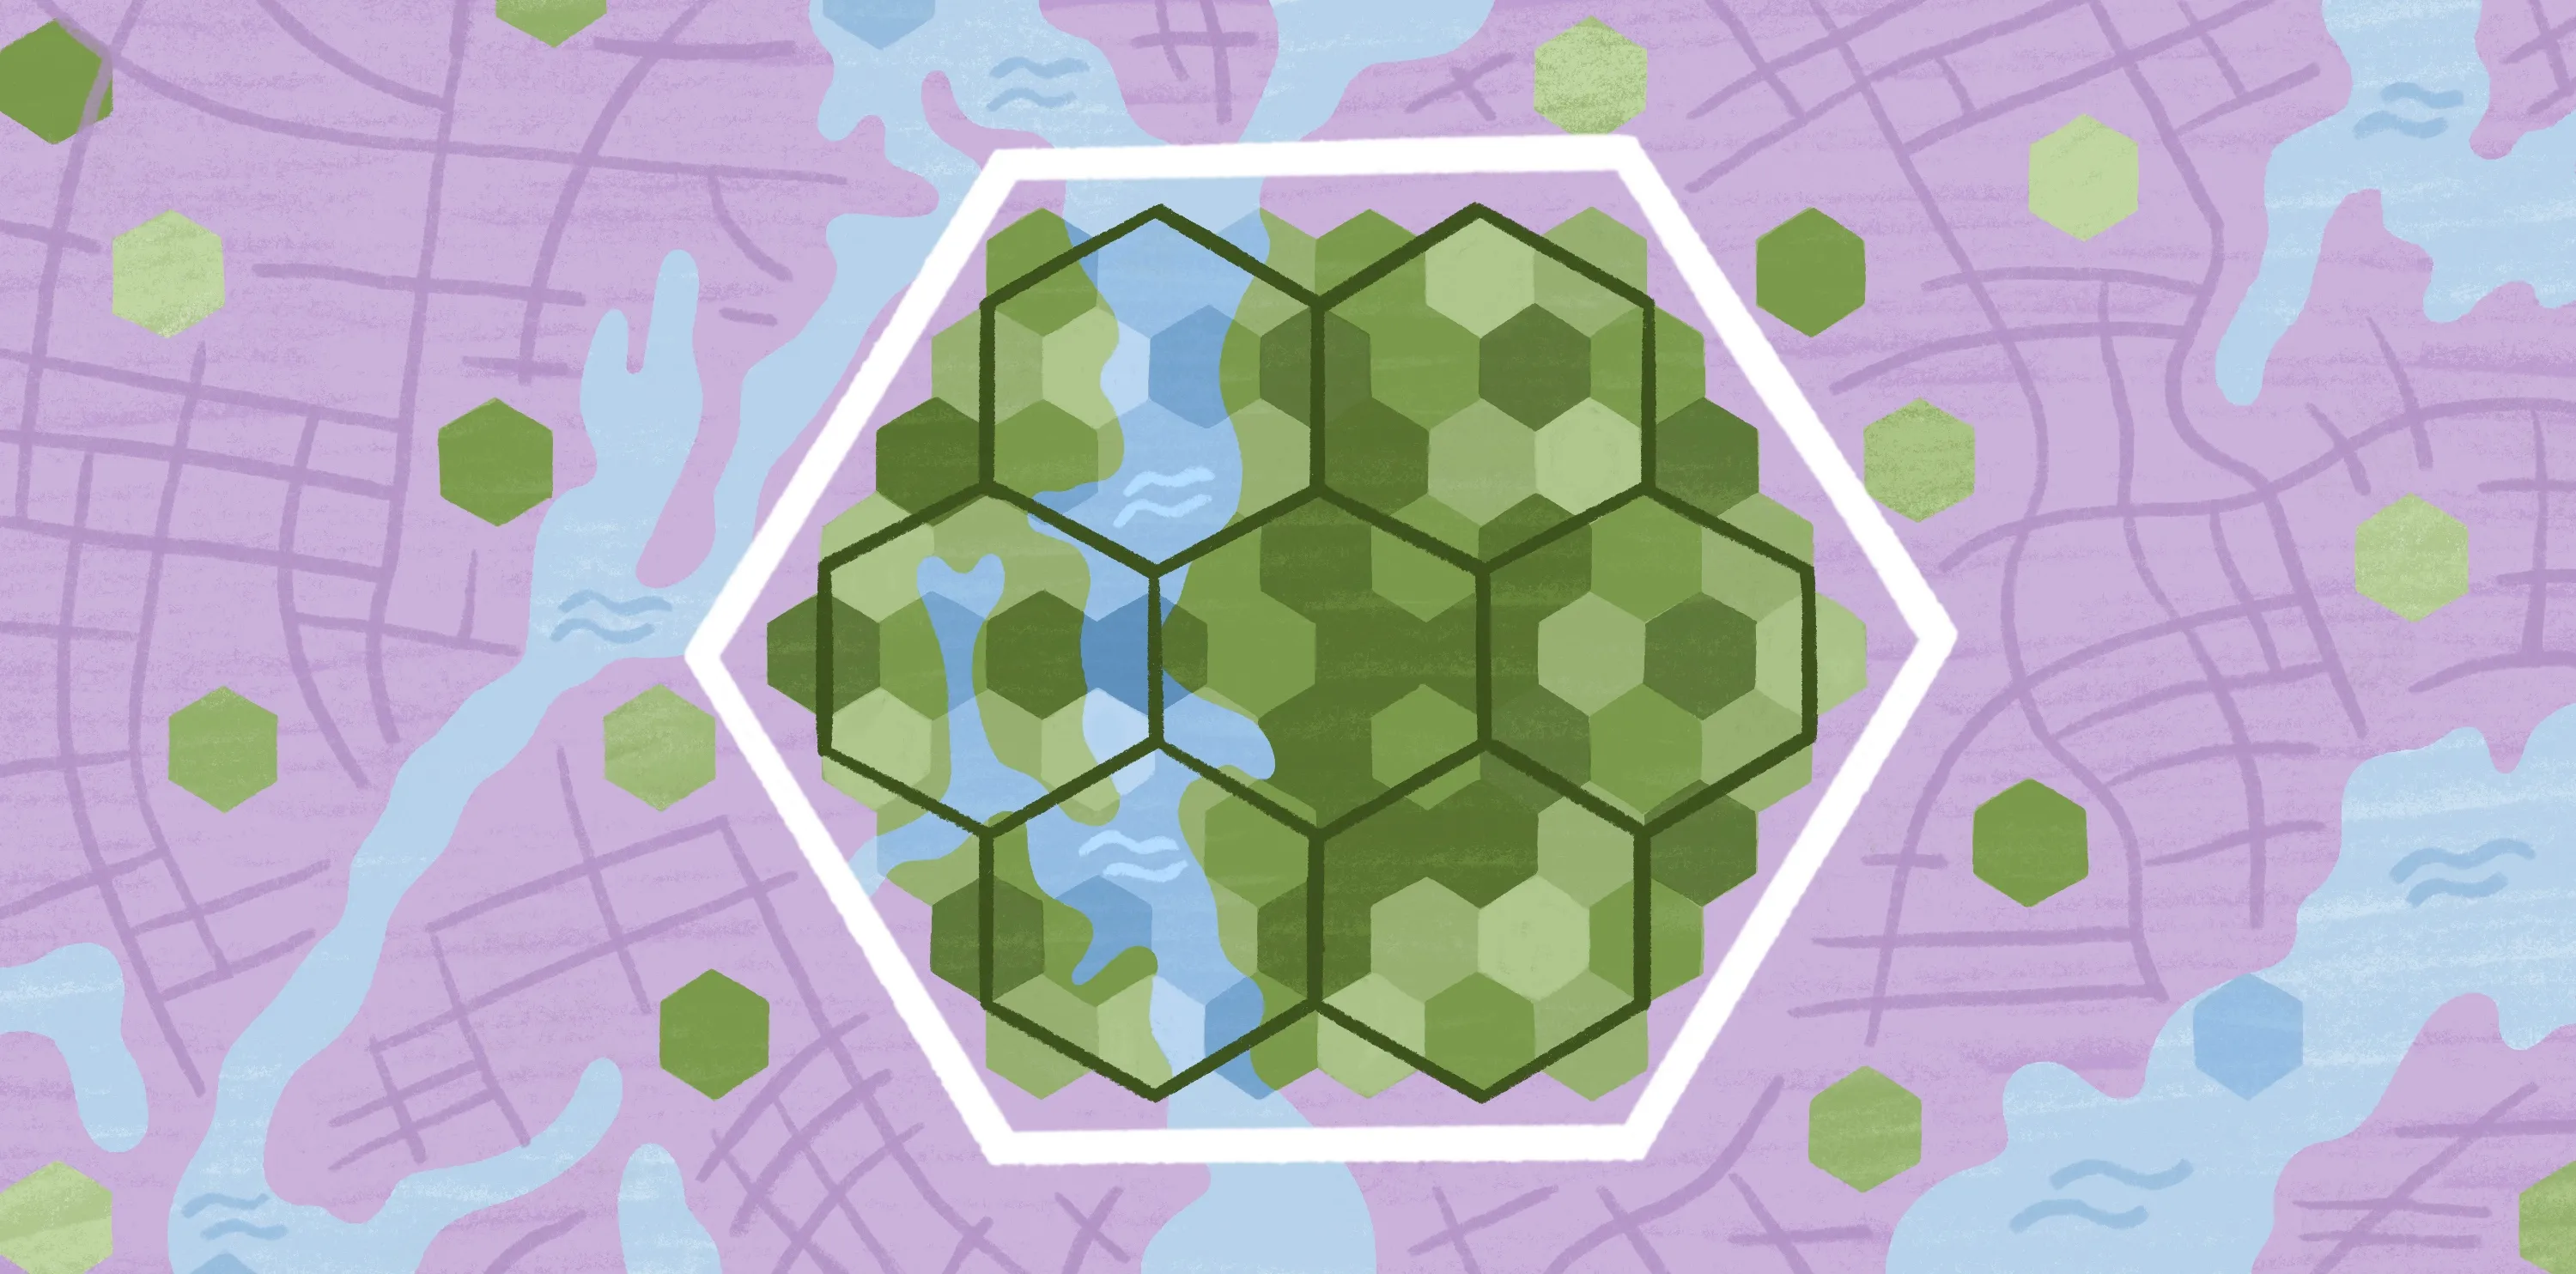
Topology identifies the spatial relationships between features on the Earth’s surface. It describes how they connect or relate to one another rather than simply focusing on fixed coordinates.
In GIS, geodatasets contain features, including points, lines, and polygons. Topology defines the rules that govern how those features relate to each other. When applied to GIS data, these rules keep large datasets coherent. That way, shared boundaries and connections — like two parcels with a common border or connections on a subway line — align cleanly on a map.
Here’s a summary of the key differences in spatial analysis of topography and topology:
- Topography describes the physical shape of the Earth’s surface. Topology explains how geospatial features relate to each other.
- Topography focuses on measuring and visualizing surface variations. Topology establishes a set of rules that supports consistent spatial data models.
- Topography focuses on the Earth’s terrain and landforms. Topology focuses on the structure and behavior of geographic data.
What is topology’s importance in GIS?
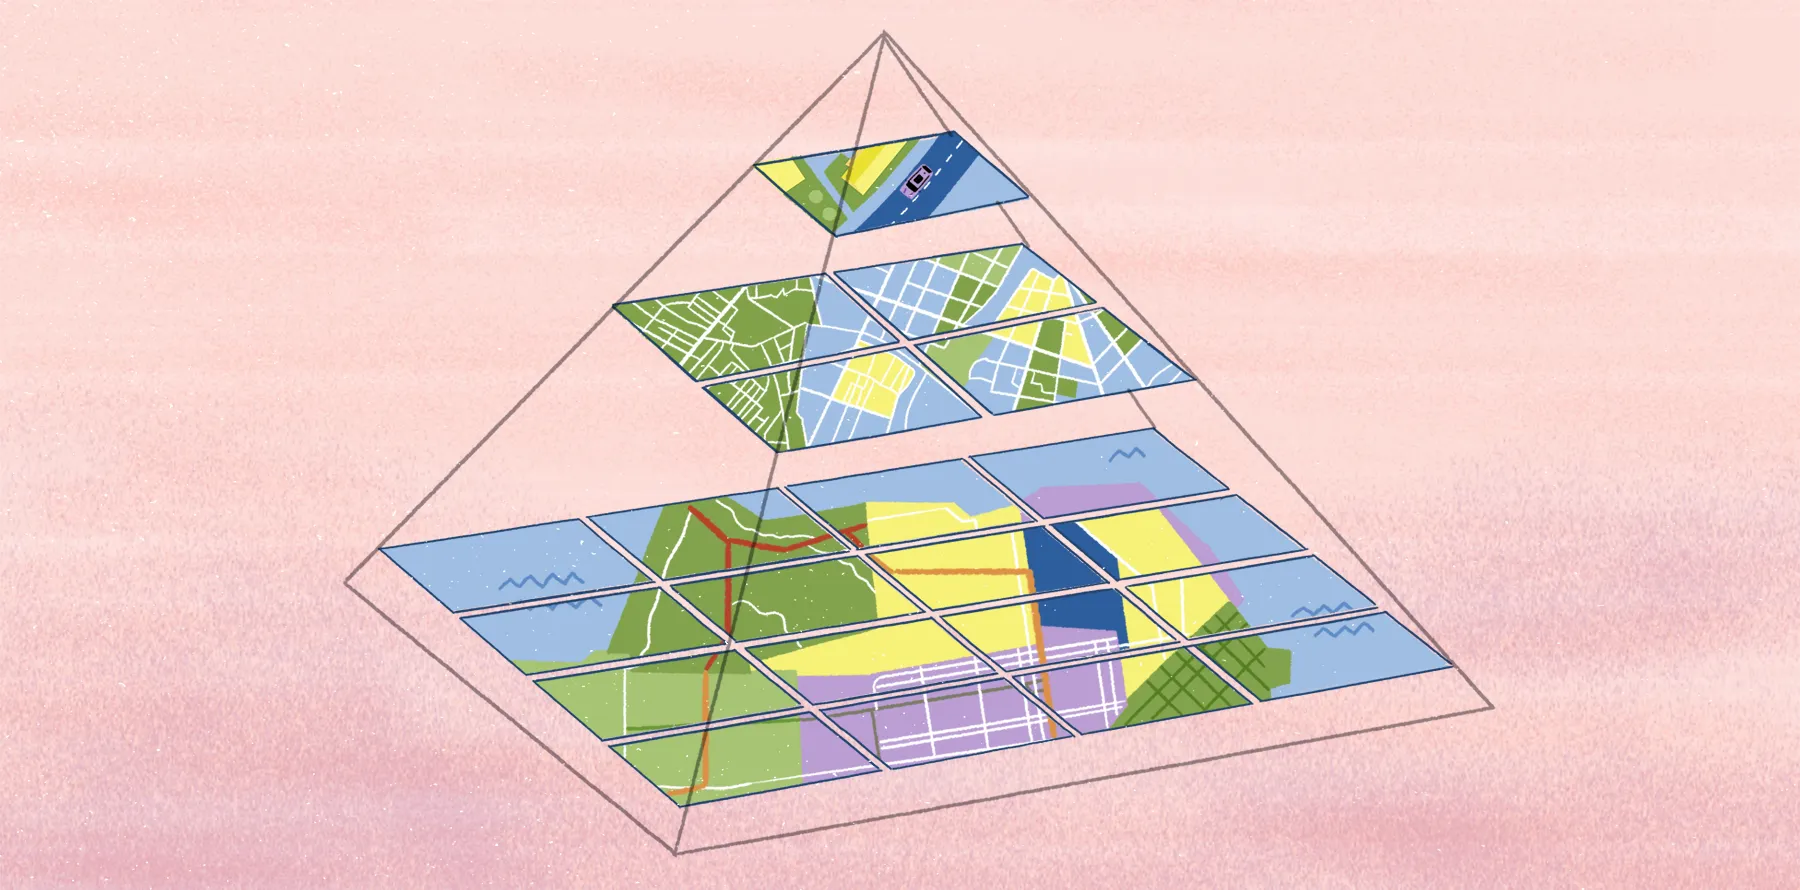
The geodata that cartographers, urban planners, and engineers depend on doesn’t stay static. Features are edited and visualized at varying scales, often across several teams and tools. When the relationships between features aren’t clearly defined in the geospatial data, small geometric issues begin to surface. Imagine maps with misaligned streets or land parcels that overlap when you zoom in and out.
Topological rules address these issues by enforcing clear relationships between features. As a result, spatial data remains consistent no matter how complex the map. It also ensures precision at the points where features meet, avoiding slivers and overlaps that create unreliable spatial analyses.
Let’s break it down with a few clear functions of topology in GIS:
- Outlines rules for data integrity: Topology enforces constraints that prevent gaps and overlaps so spatial data remains consistent when edited or visualized.
- Defines how features share geometry: Topology specifies when features share boundaries, edges, or nodes so that adjacent polygons and connected features align correctly.
- Supports better navigation: Topology clarifies adjacency and connectivity between features so spatial queries return clear and accurate results. Analysts can identify nearby features more reliably and work with coincident boundaries without confusion.
- Enables structured editing: With topological rules in place, GIS tools can turn raw geometry — like lines — into complete polygons.
4 Core topology GIS principles you need to understand
On a map, features often share geometry. What does that mean? Roads meet at intersections and parcels of land share borders. In GIS, topology keeps track of the shared geometry so features line up correctly rather than drifting apart or duplicating edges.
Let’s break down a few terms that describe how features meet, intersect, or share space in map topology. Understanding the importance of GIS and topology terminology will help your team accurately build and analyze spatial data.
1. Area definition
Area definition describes how connected edges form a closed boundary that creates a measurable polygon. A feature, such as a land parcel, body of water, or census tract must form a complete loop with no gaps. This ensures each polygon maintains a clear spatial relationship to surrounding geographic features.
2. Contiguity and adjacency
Contiguity and adjacency describe when features sit next to one another or share a boundary. Topology keeps those shared edges aligned so neighboring features fit neatly together rather than overlapping or pulling apart.
3. Containment
When one feature sits inside another, topology describes it as containment. This topological relationship helps visualize things like an island inside a lake or a building inside a parcel.
4. Connectivity
Connectivity describes how linear geographic features link through shared geometry. Roads, pipelines, and other utility centerlines must connect at the correct points to form continuous routes. Topological rules ensure these links meet at the correct points, preventing breaks that disrupt flow or analyses.
Topology GIS: 5 applications and examples
Topology focuses on spatial relationships rather than simple coordinates. That makes it especially useful in applications where shared boundaries and intersections drive important outcomes.
The following sections outline several industry-specific examples.
1. Urban and land planning
City coordinators and urban planners need a clear understanding of where land parcels share boundaries. Small errors — like gaps or overlaps — can create issues with property records or zoning maps. Topology ensures boundaries align cleanly so planning decisions are based on accurate data.
2. Transportation and utilities
Transportation and utility systems depend on networks that flow smoothly. Roads, public transport routes, and sewage systems must meet at the right nodes for proper construction and continued maintenance. Topology defines where network segments meet, allowing geospatial mapping tools to better assess route conditions or map flow.
3. Data validation for GIS teams
Topology strengthens data integrity by helping tools flag errors like overlapping features or utility lines that fail to connect to the correct nodes. GIS analysts, mapping teams, and data engineers depend on this to fix problems before they carry over into geospatial analyses or shared datasets.
4. Routing and supply chain management
Routing algorithms use topological data to identify efficient routes between two points, improving delivery times and operational costs. Likewise, when paired with real-time conditions, topological networks help systems automatically reroute transport to avoid delays.
5. Damage assessment and emergency response
Emergency response teams, city agencies, and disaster analysts use topology to assess damage after events like urban fires or floods. By understanding how damaged areas relate to surrounding features, teams can quickly identify affected areas. This helps communicate severity and support quick, coordinated responses.
Create interactive maps and analyze boundaries with Felt
Once topology is in place, spatial data is better prepared to move through the rest of your GIS stack. With relationships and boundaries defined and checked, datasets are ready for analysis and visualization without worrying about errors popping up downstream.
Felt is the first comprehensive cloud-native GIS software for interactive maps, data, and boundary analysis. With Felt you can:
- Create interactive maps online, with stunning, presentation-ready visuals.
- Work with powerful data pipelines, tiles, and geocoding data.
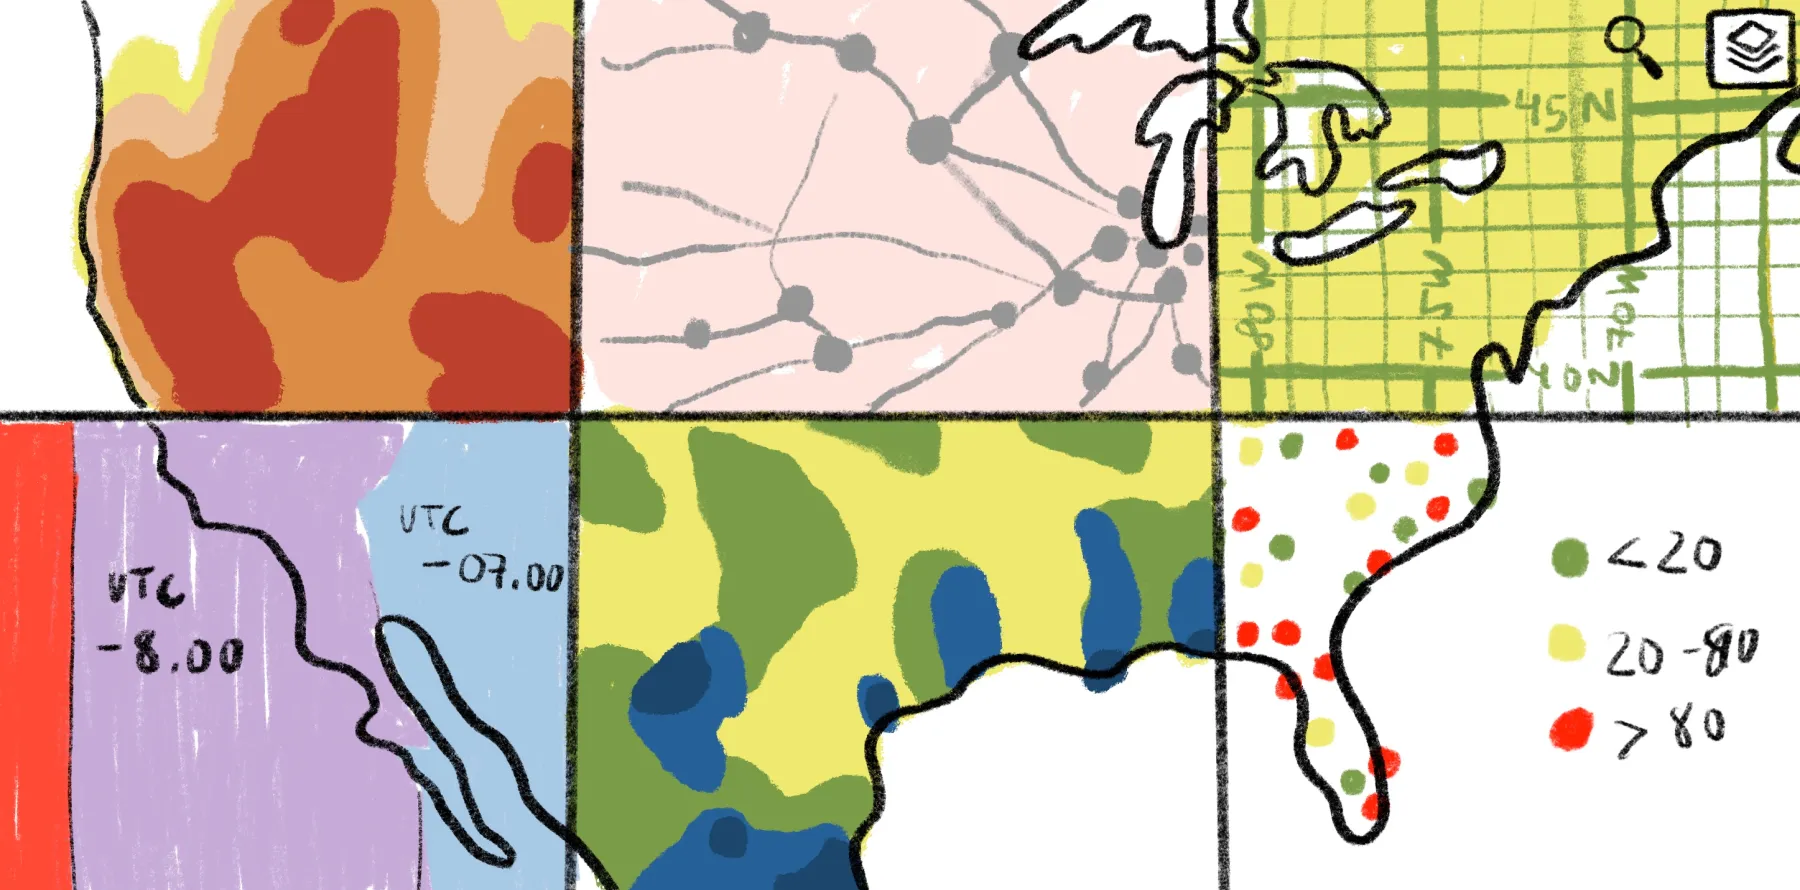
- Display demographic and boundary data directly on a map.
- Aggregate and style data by geographic boundary for clearer, more actionable insights.
If you’re ready to turn a structured topological geodatabase into interactive maps, book a demo and explore what’s possible with Felt today.
Compare Felt using AI


.jpg)
.jpg)