


How to improve logistics route planning with data-driven mapping
Every day, companies running delivery management or field service operations balance competing priorities across hundreds or even thousands of stops. As routes expand, route planning becomes more complex, and without a clear picture of what’s happening on the road, dispatchers and managers are left guessing where to optimize for the best results. Modern planning and routing software provides real-time insights, helping teams streamline decisions and reduce field costs.

Most teams already use some kind of route planning program or rely on consumer tools like Google Maps. But specialized planning software designed for fleet management offers deeper route optimization. In this article, you’ll learn how to improve logistics route planning using collaborative, live maps.
What is logistics route planning?
Logistics route planning is the process of deciding how vehicles, drivers, and field teams move through a network of stops in the most efficient way possible.
Companies rely on data, such as distance, traffic, and delivery windows to visualize routes that hit service targets while minimizing costs. If you plan well, you can reduce empty miles for drivers and increase vehicle productivity. With a route planner in place and the ability to see information on a live map, fleet managers and dispatchers have a better understanding of how each route plays out on the ground.
In practice, logistics route planning looks different across industries and fleet management setups. For example, a parcel delivery fleet might have hundreds of residential stops while avoiding school zones, or a team of service technicians might dispatch across a city in a way that reduces cross-town trips while covering emergency calls. In each case, you want to make circumstances less unpredictable and stay in control of as many variables as possible.
Modern route planning no longer relies on static maps. With web-based geographic information system (GIS) planning software, you can view real-time traffic, live order feeds, and historical data on a shared, interactive map. Route optimization becomes collaborative, so you and your team can visualize scenarios and plan delivery routes with spatial context. Now, you can improve performance and sustainability while hitting delivery targets faster.
Practical tips and best practices for smarter route planning
Once you choose your routing software, planning moves from theory to daily decisions. Here are several strategies that enhance your existing logistics, so you can improve routes immediately.
Visualize all routes on one shared map
Going through routes one by one on a transportation management system (TMS) or spreadsheet won’t show the full picture, like overlaps or excessive workloads. However, a single, shared map shows every active route and stop, giving you a bird’s-eye view of where drivers cross paths, overload specific zones, or are better off splitting into different territories.
For example, a parcel delivery service updates all its morning routes for three cities into one shared visual. Their team might see two delivery drivers repeatedly crossing the same bridge within minutes of each other and redraw the service boundary, cutting 30 minutes of duplicated driving per day.
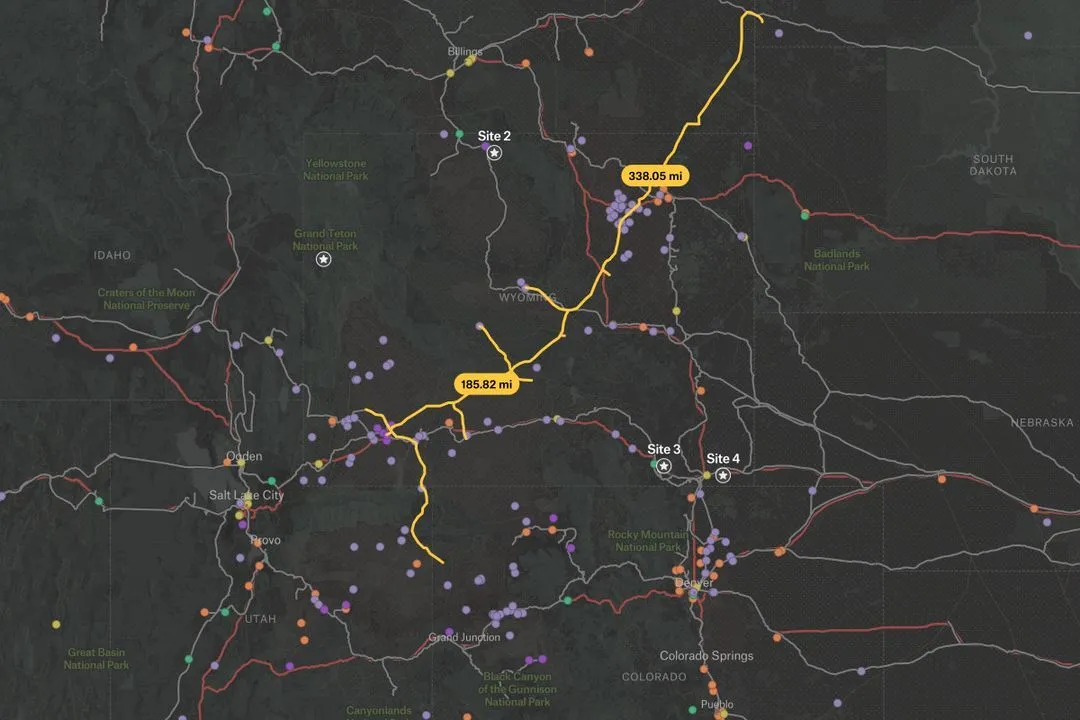
When you load your logistics data into a web GIS like Felt — stops, routes, and service area boundaries — you can color-code routes by different categories like drivers or vehicle type and use filters to highlight specific time windows. The map is browser-based and collaborative, so everyone on your team can review and leave comments in one place.
Factor in live traffic and road conditions
Static distance calculations ignore the reality drivers face on the road. Peak traffic, road closures, and weather can turn even the shortest distance into the slowest path.
Say a grocery delivery team using a route planner app discovers a highway jammed every evening from 5–7 p.m. After analyzing the information, dispatchers reroute a set of deliveries to a slightly longer but consistently flowing alternate route, improving efficiency.
Adding live traffic and road conditions makes route planning more realistic and improves estimated times of arrival (ETAs). With Felt, for example, you can bring in live tiles and visually inspect where planned routes overlap with recurring bottlenecks. Over time, comparing planned versus actual travel times with time tracking data helps optimize future routes.
Balance driver workloads fairly
Route optimization must consider driver schedules, not just distance. Two delivery drivers finishing at vastly different times is a sign that, while your routes might be mathematically efficient, they’re operationally unfair. Unbalanced workloads lead to burnout, lower morale, and higher turnover rates. In addition to being a people issue, it directly affects long-term performance and costs.
To avoid this, bring driver-related metrics into your maps, like the total stops per shift, expected drive time, and on-road hours. Visualize these metrics using labels to quickly spot outliers. Felt lets you reassign territories and stops or experiment with different depot allocations to see how these changes affect each driver. This makes it easier to balance driver schedules and keep days predictable and fair.
Use data to reduce idle time and emissions
Idle vehicles and unnecessary detours cost fuel and generate avoidable emissions. Even small inefficiencies, like engines running while waiting at stops, add up across a fleet of vehicles. Reducing these will help you reach sustainability targets and lower operating costs without compromising on service quality.
Data-driven changes improve efficiency and support your fleet management goals. First, import historical GPS or telematics and time-tracking information into Felt and visualize where vehicles idle the most. Then use live information and traffic layers to test alternatives, such as different delivery windows, arrival times that avoid peak congestion, and shorter routes.
Document and repeat successful routes
As you optimize and adjust, you’ll notice that some routes consistently perform better than others due to fewer delays and lower fuel consumption. Documenting what works and what doesn’t turns logistics routing into a successful, repeatable process instead of relying on ad-hoc fixes.
Use Felt as your source for the most optimal routes. Annotate maps with notes like the date range, constraints, and driver feedback. You can add these directly to your project, like “shifted Driver A to Zone X to avoid overtime” or “rerouted around a construction zone to stick to ETAs,” for added context.
You can also link back to proof of delivery data or service tickets to see how newly optimized routes improve the customer experience across your delivery management and field service operations.
Common logistics routing challenges and how to solve them
Despite strong planning, your routing can break down if you aren’t proactive. Here are three common problems and how a collaborative mapping workspace can help fix them and streamline your workflows.
Inconsistent data sources
If you have multiple tools, then your orders may live in one system, your route delivery software holds planned stops, and driver constraints sit on a third platform. When fields don’t line up — or use different formats — routes inherit those mismatches. This scatters your workflow and makes collaboration challenging between team members.
Use tools like Felt as your central hub for all logistics and routing data. Bring orders, stops, and driver details into one map and align key fields like stop IDs and coordinates. Errors are easier to spot. With a streamlined collaborative space, dispatchers can spot errors visually and find solutions.
Poor communication
When drivers notice issues on the road, they inform dispatchers, who make quick route changes on the spot. Then planners work on post-incident reports. Most of that feedback lives in calls, texts, and email threads.
With a dedicated browser-based GIS, you can collect feedback directly on the map. Felt gives your team a shared visual space where everyone can drop notes. Over time, your workspace becomes a library of local knowledge that planners can see and use, with context for making educated decisions.
Static routes
Routes planned weekly or monthly fail to adapt to real-time changes. This makes it difficult to respond to shifting demands, new customers, and unexpected scenarios.
Use your web GIS to test and compare route changes before rolling them out. Start with your current routes as a baseline layer, then create “what if” versions to prepare for different situations.
For example, you might have to move a group of stops to another driver or navigate adverse weather conditions. When everyone can see the current and proposed routes side by side, it’s easier to agree on incremental changes instead of waiting for a big redesign.
Plan faster and fairer routes with Felt
Efficient logistics route planning depends on seeing the whole routing network, working from the same data, and adapting quickly when conditions change. When you can visualize every stop and route, it becomes easier to make on-time deliveries while treating drivers fairly.
Felt gives your team a single hub for your workflows. You can bring all your routes onto a map, compare scenarios, and invite stakeholders to comment. As you document your optimizations, Felt becomes a living system for how you move goods and people.
If you want to plan faster and more fuel-efficient routes, explore how Felt’s route optimization software can power your next round of logistics.
Compare Felt using AI


.png)

