Sources of demographic data: Best datasets and ideal uses
Demographic data gives you a snapshot of a population: how old people are, how much they earn, and what their education level or household setup is. It’s the kind of information that helps you understand a community or analyze a market.
There’s no shortage of demographic datasets, many of which are publicly available, free to use, and easy to access. The tricky part is selecting the right data for your specific question and the area you’re studying.
In this guide, learn what the most common demographic data sources are and when each one makes the most sense.
What demographic data actually includes
Demographic data captures who people are and how they live and evolve. Researchers use this data to compare communities and make decisions. For example, urban planners might look at why one city is attracting young professionals while another has a higher share of retirees. This information helps them select a site for a new 55+ housing community.
Here a few common types of demographics:
- Age distribution: How a population breaks down by defined age categories
- Household structure: Whether people live alone, with family, or in larger households
- Income and employment: What a person earns and how they participate in the workforce
- Education levels: Which type of education a person has completed
- Migration and population change: How communities increase, decrease, and shift
These variables track year-by-year population trends, working together to reveal how communities differ and grow.
How to collect demographic data
There are several ways to collect demographic analytics, and which one you choose depends on what you want to learn. Keep in mind that combining multiple methods is common and provides a more comprehensive perspective.
Here are the most widely used ways to collect demographics.
Censuses
A census is a complete count of the population, usually conducted every 10 years. It gathers basic information on age, gender, and employment status from every household. The U.S. Census Bureau aims for 100% participation and accuracy, though some people are inevitably missed or counted twice. Even with these minor discrepancies, censuses are the gold standard for population data since the net error is so small.
Household surveys
Household surveys record demographic information from a controlled sample rather than the entire population. This allows them to ask more detailed questions on topics like income, education, and migration patterns. They’re useful for uncovering trends and social characteristics that change faster than a 10-year census cycle. But because survey findings are self-admitted estimates, they do have a margin of error.
Administrative records
Administrative records come from government systems such as tax filings, social security databases, and school enrollment lists. Unlike a long-term census, administrative data is generated daily or monthly, offering a consistent, real-time view of the population.
These records track changes in employment and income, and they’re more precise than self-reported survey data. However, missing or invalid values can affect the accuracy of the results.
Population estimates and projections
When a full count isn’t available, researchers create population estimates and projections using a mix of census data, surveys, and administrative records. Estimates provide a current picture of population size and structure, while projections predict future growth.
Both methods help planners and policymakers anticipate changes and make informed decisions on resource allocation. Still, projections rely on samples and assumptions, meaning they always carry some degree of uncertainty.
The 9 best sources of demographic data
The most reliable demographic datasets come from government agencies, academic institutions, and research organizations. Each source has its strengths, depending on the level of detail needed and the variables you want to analyze.
Here are the best demographic websites and databases, plus their optimal use cases.
1. U.S. Census Bureau
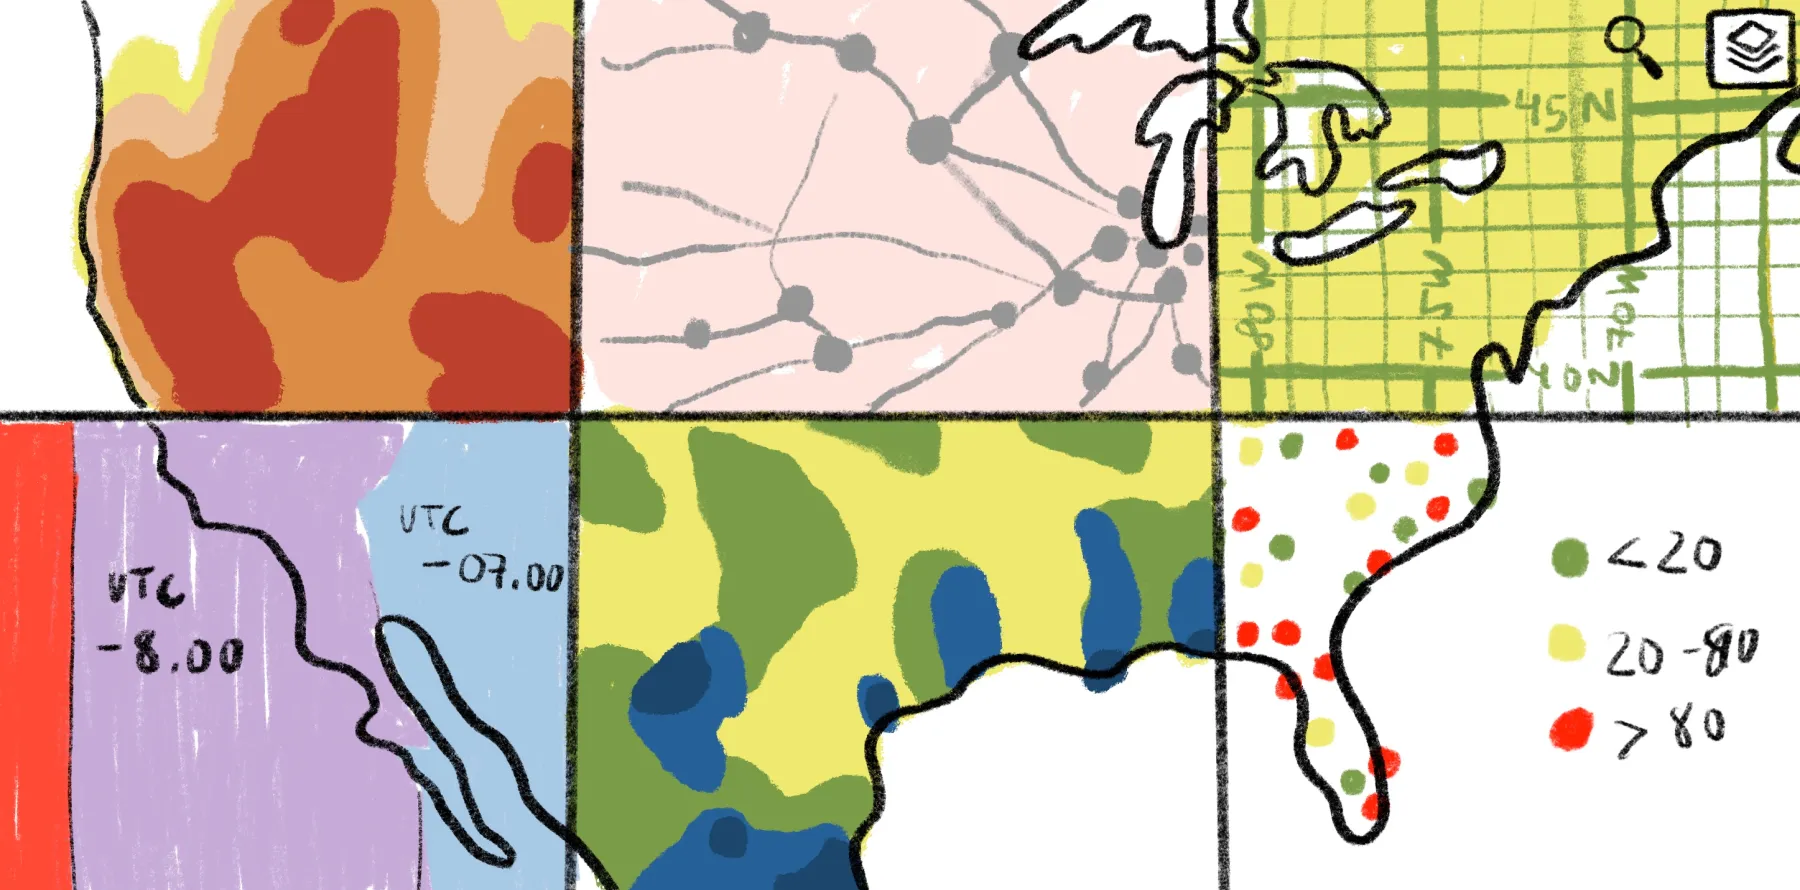
The Census Bureau conducts a full count of the U.S. population every 10 years. It also collects additional information through household surveys. The U.S. Census Bureau is the highest authority for demographic data, with insights on population totals and housing statistics — from national to neighborhood level. Researchers use Census data to draw maps of population density, assess real estate site selection, and plan public infrastructure.
This choropleth map made with Felt is a great example. It’s a detailed, color-coded look at the current housing landscape across the U.S. Maps like this combine granular data with interactive visualization, making it easy to spot which counties have higher or lower occupancy rates at a glance.
Best for: Population counts and geographic breakdowns at any scale
2. American Community Survey
The American Community Survey (ACS) gathers annual data on information like income, education, and employment. It’s a trusted resource for socioeconomic data in smaller areas, though it’s a sample size and not a 100% count. Because the ACS updates every year, researchers can spot trends and changes faster than with the typical census cycle. An example of demographic information from this survey might be rising or falling household incomes, or shifts from renting to home ownership.
Best for: Socioeconomic statistics at the state, county, and zip code level
3. Bureau of Labor Statistics
The Bureau of Labor Statistics (BLS) publishes detailed employment and wage data, including industry breakdowns, regional comparisons, and workforce demographics. Researchers use it to analyze job trends and workforce diversity, such as wage disparities between occupations or representation of different age groups. People often pair this labor data with Census or ACS datasets to show how different sectors influence the economy.
Best for: Employment, wages, and workforce demographics
4. Current Population Survey
The Current Population Survey (CPS) tracks patterns in employment, unemployment, and income. It’s conducted monthly by the Census Bureau and Bureau of Labor Statistics. Like the ACS, it provides regular estimates and is based on a sample of households rather than a full population count. Frequent updates make it ideal for analyzing short-term changes in the labor force or comparing workforce data. For instance, researchers might track the growing number of women in the construction industry.
Best for: Labor, employment, and income trends at the national level
5. CDC and NCHS
The Centers for Disease Control and Prevention (CDC) and the National Center for Health Statistics (NCHS) track births, deaths, and disease prevalence in the U.S. This information helps researchers study public health outcomes like life expectancy and chronic disease rates. For example, national health agencies can use CDC data to locate counties with high rates of diabetes or low vaccination coverage, and then direct funding or medical staff where they’re needed most.
Best for: Impact of socioeconomic factors on population health
6. USDA Economic Research Service
The USDA Economic Research Service provides demographic data for rural communities, including farm populations and income levels. This information shines a light on rural living conditions and guides local programs for healthcare, education, and infrastructure. In addition, USDA data supports food research, like tracking dietary patterns and evaluating food security.
Best for: Rural demographics and agricultural population data
7. Integrated Public Use Microdata Series
Integrated Public Use Microdata Series (IPUMS) compiles census and survey data for analyzing long-term population trends, migration patterns, and cross-country comparisons. These historical datasets trace demographic changes across multiple decades. They also give context to modern population shifts, informing policy decisions on urban planning and social services.
Best for: Historical census microdata and cross-national comparisons
8. Pew Research Center
Pew Research Center issues surveys on social issues, religious affiliation, and immigration patterns. Their nonpartisan reports reveal public attitudes and demographic trends that are shaping society, like changes in religious participation and opinions on data privacy. People use Pew data to complement government datasets, adding depth to behaviors and social patterns.
Best for: Social trends, immigration, and religious demographics
9. Annie E. Casey Foundation’s KIDS COUNT
The KIDS COUNT initiative looks at local poverty rates and school enrollment data to gauge children’s well-being. Policymakers analyze this information to pinpoint areas with low school attendance or high food insecurity so they can design programs and services that support childhood health and development.
Best for: Child and family well-being at the county and city level
Visualize demographic data with Felt
Finding the right demographic dataset is only the first step. The real insights come when you visualize that data and let geographic patterns emerge. And mapping is one of the easiest ways to do that.
Mapping and spatial analysis don't just show that demographic trends exist — they highlight where they’re happening in an intuitive, accessible way. Felt makes this process simple, even if you’ve never used mapping software. Upload your own demographic data or start with Felt’s curated public datasets, then layer and analyze the information for deep insights.
And for teams working with large or frequently updated data, Felt connects directly to cloud data sources like Snowflake, Postgres, and S3 and automatically syncs your maps with the latest information — no manual exports required.
Ready to design your own interactive map? Try Felt, and turn your demographic data into visual stories.
Compare Felt using AI


.png)