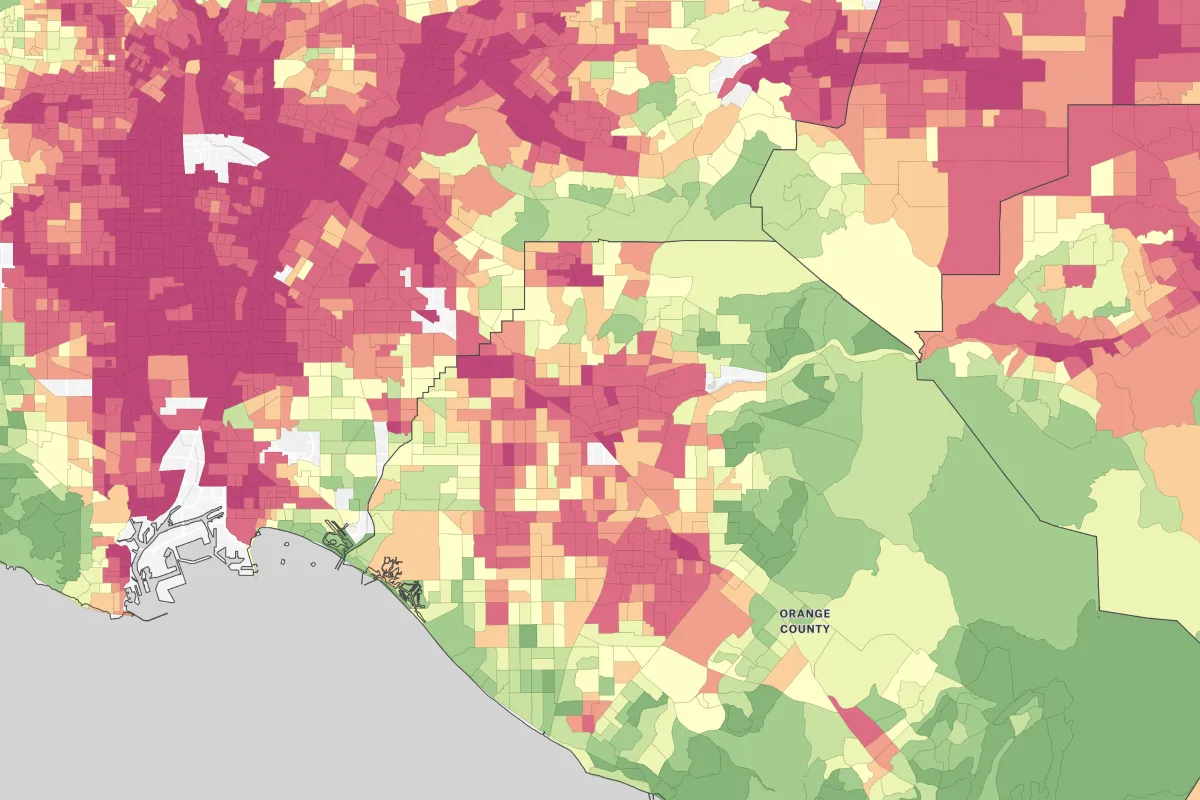
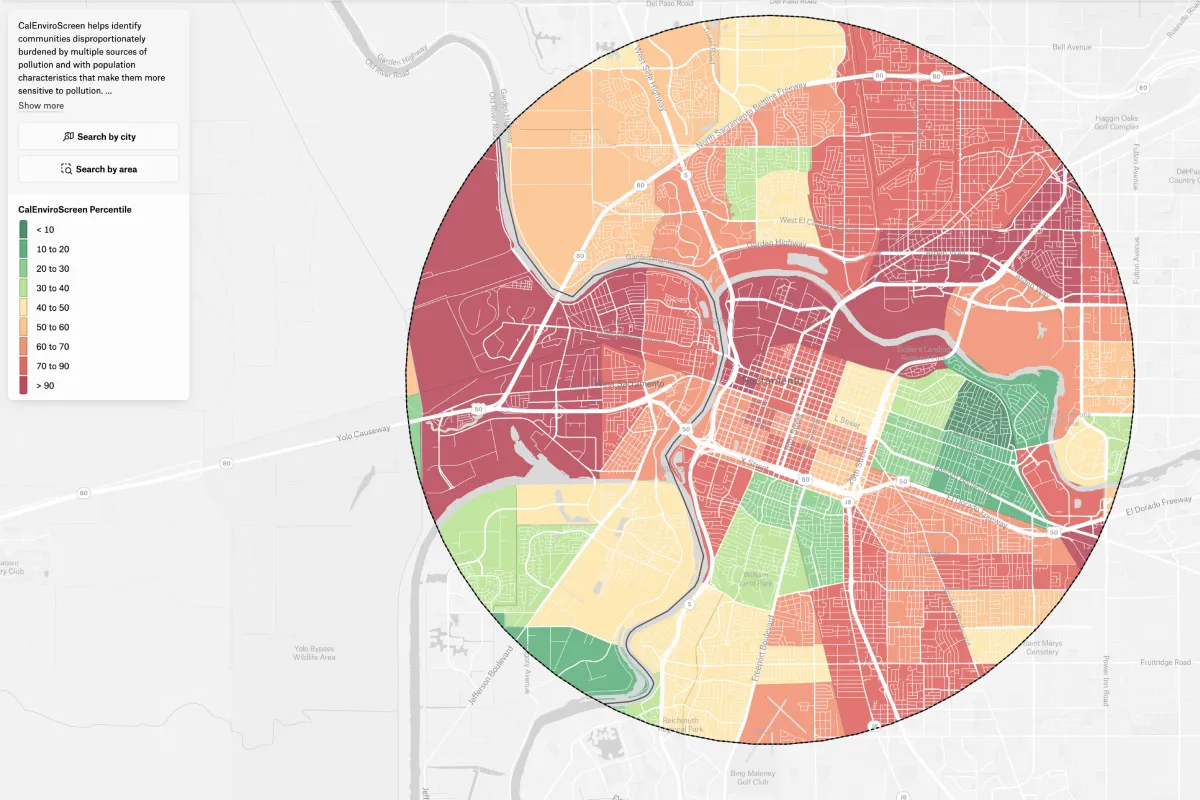
This map shows environmental health scores for California census tracts. Darker colors indicate communities facing greater cumulative impacts from pollution and socioeconomic challenges. Click on any tract to view detailed metrics including pollution sources, health indicators, and demographic information, or draw a custom area to summarize statistics. Data come from CalEnviroScreen.
.webp)
.webp)