.jpg)
Vegetation indices: A guide to types and real-world uses
When monitoring vegetation across large landscapes, changes rarely occur all at once. A single field or forest can shift from healthy to stressed in subtle ways that are difficult to spot at ground level, especially across different seasons, conditions, and land use.
Farmers, environmental analysts, and land managers use satellite and multispectral imagery to track these gradual changes and identify patterns. Vegetation indices turn those patterns into mappable signals, letting businesses measure environmental health at scale.
In this guide, you’ll learn what vegetation indices are, which types are best for unique applications, and how to use them in geospatial workflows.
What are vegetation indices?
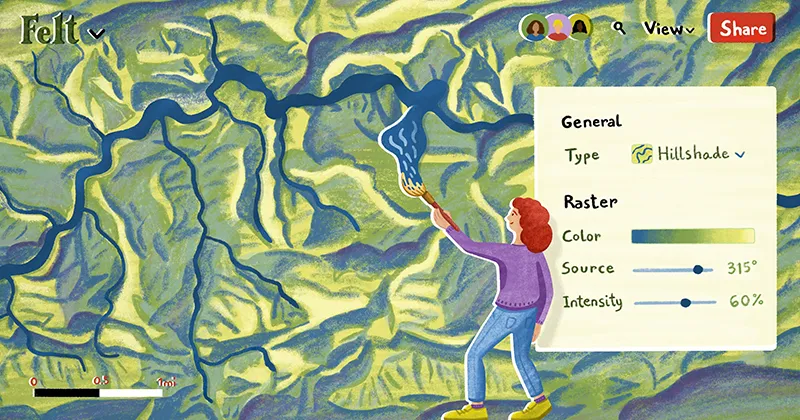
Vegetation indices are measurements derived from remote-sensing technology, like satellite and drone imagery. It helps analysts understand vegetation health, coverage, and drought stress.
Most vegetation indices formulas compare reflectance values from different bands. The NDVI formula is a common example, letting analysts understand plant health quickly and reliably using red and near-infrared light.
In simple terms, vegetation indices make use of how plants absorb and reflect different wavelengths to turn raw imagery into signals. For example, you can spot:
- Vegetation health and biomass: When vegetation is greener and denser, canopies absorb more red light and reflect more near-infrared light, so indices can help estimate overall plant vigor and relative biomass.
- Crop stress and nutrient deficiencies: Vegetation indices in agriculture can flag zones where crops are under pressure. Stress changes plant reflectance, often through reduced leaf chlorophyll content and weaker canopy development. Teams use these indices to identify areas that might need field examination or follow-up sampling.
- Water stress and drought impact: Some indices highlight vegetation moisture conditions or abnormal declines in growth due to limited water.
- Land cover change and ecosystem monitoring: Vegetation index maps track seasonal changes and long-term shifts in vegetation conditions across ecosystems.
6 types of vegetation indices explained
In remote sensing, vegetation indices reveal unique conditions. Here are the main ways to group indices based on use and context.
1. Normalized Difference Vegetation Index
Normalized difference vegetation index (NDVI) is the most common starting point for vegetation analysis. It compares red and near-infrared reflectance. Because healthy vegetation tends to absorb red light while reflecting near-infrared light, NDVI gives a quick read on overall greenness, vegetation density, and broad plant condition across large areas. In some workflows, you can compare it with enhanced vegetation index (EVI) to get a more comprehensive picture of dense canopy vegetation.
2. Green NDVI
Green NDVI (GNDVI) is similar to NDVI but uses green and near-infrared bands. Green light penetrates more deeply into leaves, going past surface level and getting a more accurate reading on thicker canopies. It’s also more sensitive to chlorophyll variations, which is helpful for spotting early stress or nutrient-related changes before they’re obvious to the naked eye.
3. Normalized Difference Red Edge
Normalized Difference Red Edge (NDRE) uses the red-edge portion of the spectrum rather than the standard red band. It helps analyze mature plants, as it stays sensitive and highly accurate during later growth stages when vegetation becomes denser. Researchers use it to detect biomass, nitrogen levels, and disease.
4. SAVI and MSAVI
These indices are for areas where exposed soil can distort the vegetation signal. Soil-adjusted vegetation index (SAVI) reduces soil brightness, and modified soil-adjusted vegetation index (MSAVI) maximizes the range of the signal and corrects further interference. These methods are ideal in landscapes where bare ground is more visible, like sparse and early-growth-stage fields.
5. Normalized Difference Water Index
Normalized Difference Water Index (NDWI) uses green and near-infrared bands to highlight surface water. It lets researchers define specific water features and map their presence and size. For instance, agricultural experts might use it to identify ponds and determine total planting space.
6. Normalized Difference Moisture Index
Normalized Difference Moisture Index (NDMI) focuses on moisture in vegetation. It uses near-infrared and shortwave infrared information to estimate vegetation water content, which helps track canopy moisture, drought stress, and drying patterns over time.
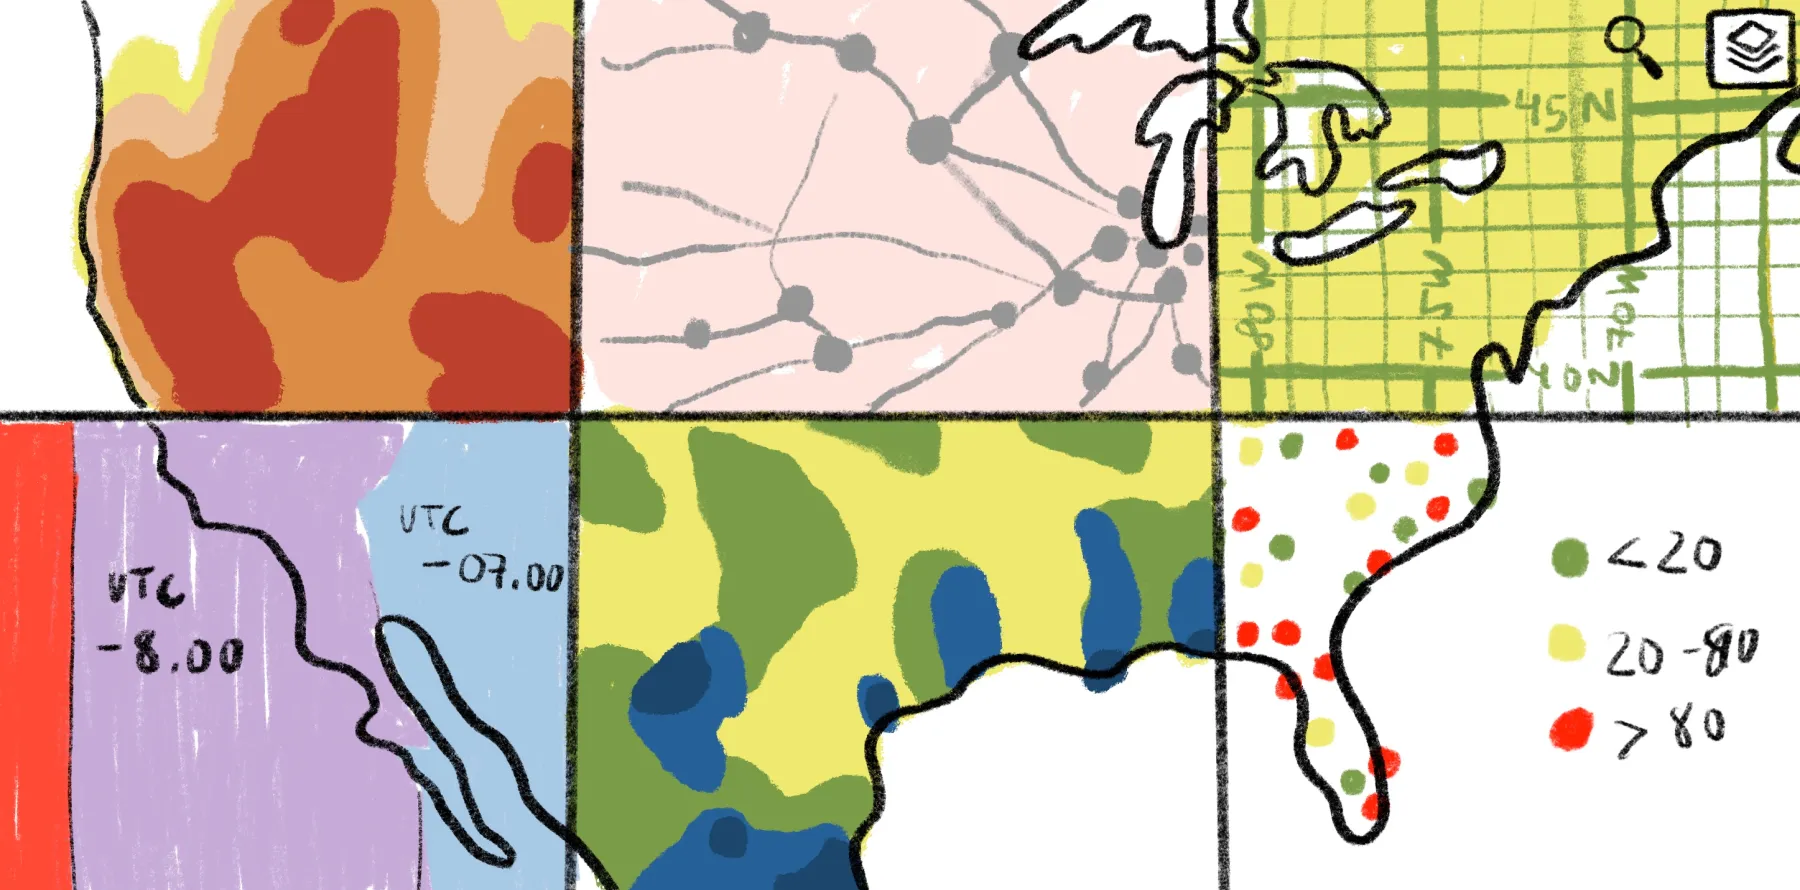
Here’s an example of indices in an interactive Felt map:
This map uses indices to show vegetation health and moisture levels across southern California. Users can swap between NDVI, NDWI, and NDMI to quickly compare data at a glance. Check out this video to see how this map was built.
Felt supports NDMI, NDVI, and NDWI, so you can track vegetation, water, and moisture conditions in the same browser-based workflow. You can also compare outputs with standard RGB imagery and other raster layers to pair index-based interpretation with a more familiar view of the landscape.
What are the challenges and limitations of vegetation indices?
Vegetation indices’ reliability depends on conditions and source imagery. Before interpreting results, here are several challenges to understand the best fit.
NDVI can saturate in dense vegetation
NDVI becomes less sensitive as vegetation gets denser. In high-biomass canopies, its value begins to level off, making it harder to separate differences in vegetation conditions. That means two dense, healthy areas can end up looking more similar than they really are. In such scenarios, switching to NDRE will give you more sensitivity in mature vegetation.
Soil brightness may affect some indices
Factors like bright or exposed soil can influence some indices, especially NDVI. Soil background contributes to the reflectance signal, and results could show soil data and distort the value coming from vegetation. This is a common issue in early growth stages, dry regions, and patchy fields, where bare ground can make vegetation appear stronger or weaker than it really is. Teams need a defined approach of where and when to use MSAVI and SAVI indices to combat this.
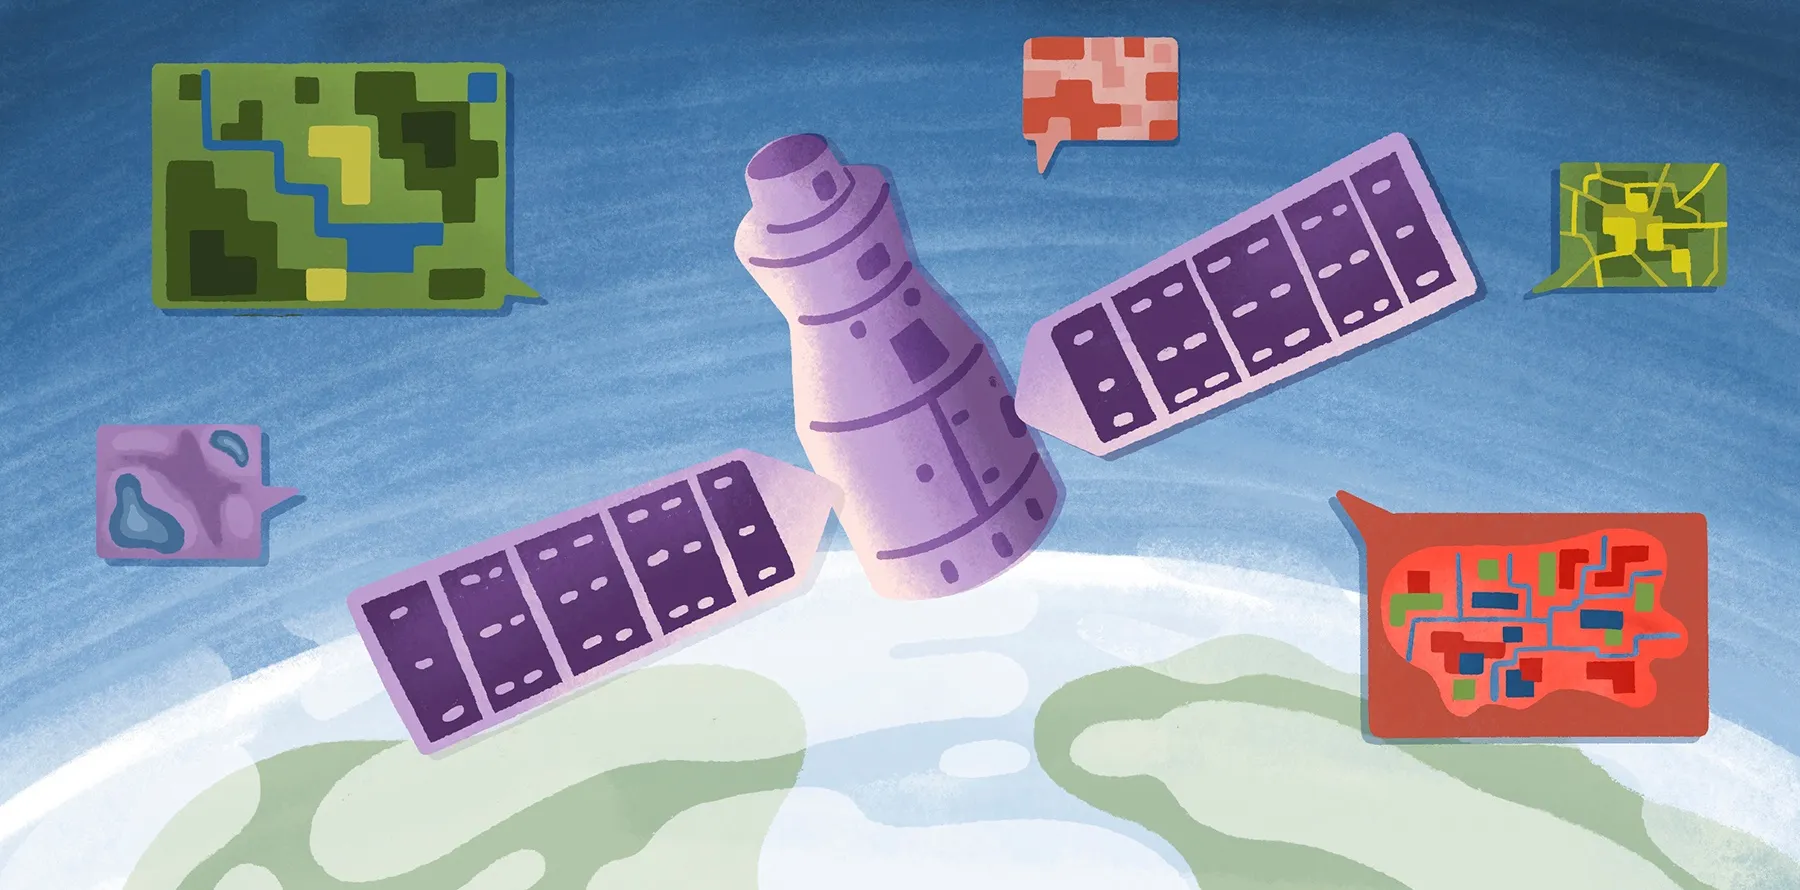
Different sensors require different spectral bands
Vegetation indices aren’t automatically interchangeable across sensors. Different satellites measure unique wavelengths, resolutions, and atmospherically-corrected bandwidths.
That means an index calculated from one sensor isn’t directly comparable to the same index from another — unless the differences are standardized. Mixing values from different sensors without accounting for those differences can create false trends or misleading comparisons.
In some workflows, you can combine imagery with other remote sensing information. For instance, you might use LiDAR data to understand vegetation from a 3D perspective, including height and canopy structures.
Atmospheric interference
Atmospheric effects can alter the red and near-infrared reflectance that many vegetation indices depend on. Conditions like clouds, haze, and aerosols can distort the signal before it reaches the sensor. They can affect NDVI and lead to inaccurate surface readings, which means a drop in an index won’t always reflect actual vegetation stress. Some teams correct results with EVI, using blue band light to normalize reflectance.
How vegetation indices are used in GIS workflows
Most businesses don’t use vegetation indices alone. Professional teams combine satellite and drone imagery inside geographic information systems (GIS), layer them with data, and create interactive maps. Here are a few examples:
- Monitoring crop health in agriculture: There are many applications of vegetation indices in agriculture. Teams often use NDVI, GNDVI, or NDRE to spot uneven growth and focus scouting where it’s needed. For example, a farmer might map crop health across a field and identify weaker zones that need closer inspection.
- Detecting drought stress or irrigation problems: Moisture-related indices show where vegetation is drying out or where irrigation is underperforming. A land owner, for example, can compare moisture patterns across several days to find an area that’s drying faster than the rest of the field.
- Tracking vegetation change over time: Repeated index mapping makes it easier to separate short-term blips from long-term variations. Government organizations can compare seasonal vegetation over years to measure land degradation or track restoration progress for urban planning.
- Mapping forest health or ecosystem conditions: Climate and natural resources companies use vegetation indices to check canopy conditions and broader ecosystem trends, including threats that might disturb growth. For example, they might use index maps to identify areas with lower greenness or moisture.
- Managing vegetation around utility corridors: Energy and utility teams compare vegetation indices relative to transmission lines and pipeline routes. This lets them see where canopies become denser and ill-suited to field operations.
Comprehensive systems support the entire process, from field to office. Felt’s Field App lets teams capture mobile field data — like crop stress and environmental changes — wherever they are. This information instantly syncs to geospatial workflows, so businesses have real-time access to precise observations and surveys.
Combine field data and vegetation analysis with Felt
Vegetation indices are most powerful when they're part of a complete workflow, not isolated outputs sitting in a desktop application. Felt's cloud-native GIS platform lets you bring index layers, field observations, and other spatial data together in one place. You can then style and compare them instantly, and share results with anyone who needs them.
Felt supports NDVI, NDWI, and NDMI natively, so you can render and style raster index layers alongside RGB imagery, vector data, and cloud-connected sources in the same browser-based environment. Stream data directly from S3, Azure, or Google Cloud, or connect to databases like Snowflake, BigQuery, or Postgres to pull in the underlying data your indices are built from.
Felt AI lets you query that data in natural language, so you can surface patterns and answer questions without writing a single line of code.
Go beyond the office: Felt's Field App lets you capture ground-truth observations like crop stress flags, canopy notes, and site conditions directly into your map while connected, so field data and remote sensing analysis stay in sync.
Explore our climate and natural resources gallery and agricultural map collection to see unique ways you can map environmental data with Felt.
Compare Felt using AI