Retail location analytics: A guide to smarter site decisions
Retailers manage a large volume of location-based data, from customer movement and local demand to competitor presence. Collecting data is easy with automated tools, but the real value comes from using that intelligence to decide where to open, close, or expand. In retail, those choices directly impact long-term performance.
Geographic information systems (GIS) help teams interpret spatial layers and compare markets. This makes it easier to visualize how different factors influence store performance and site potential.
In this guide, you’ll learn how to use retail location analytics to optimize store networks and make more informed decisions with your data.
What are retail location analytics?
Retail location analytics is the process of using location-based information to support retail decisions. It combines geographic, demographic, and foot traffic data with internal performance metrics to help you understand market potential and store behavior.
While a basic map shows where stores are, location analytics add context to explain why certain sites are likely to succeed or struggle. Retail location analytics include the following main components:
- Data sources: Inputs that describe markets, including store locations, trade areas, and customer demographics
- Location engine: The GIS or spatial layer that measures store access, proximity, and market opportunity
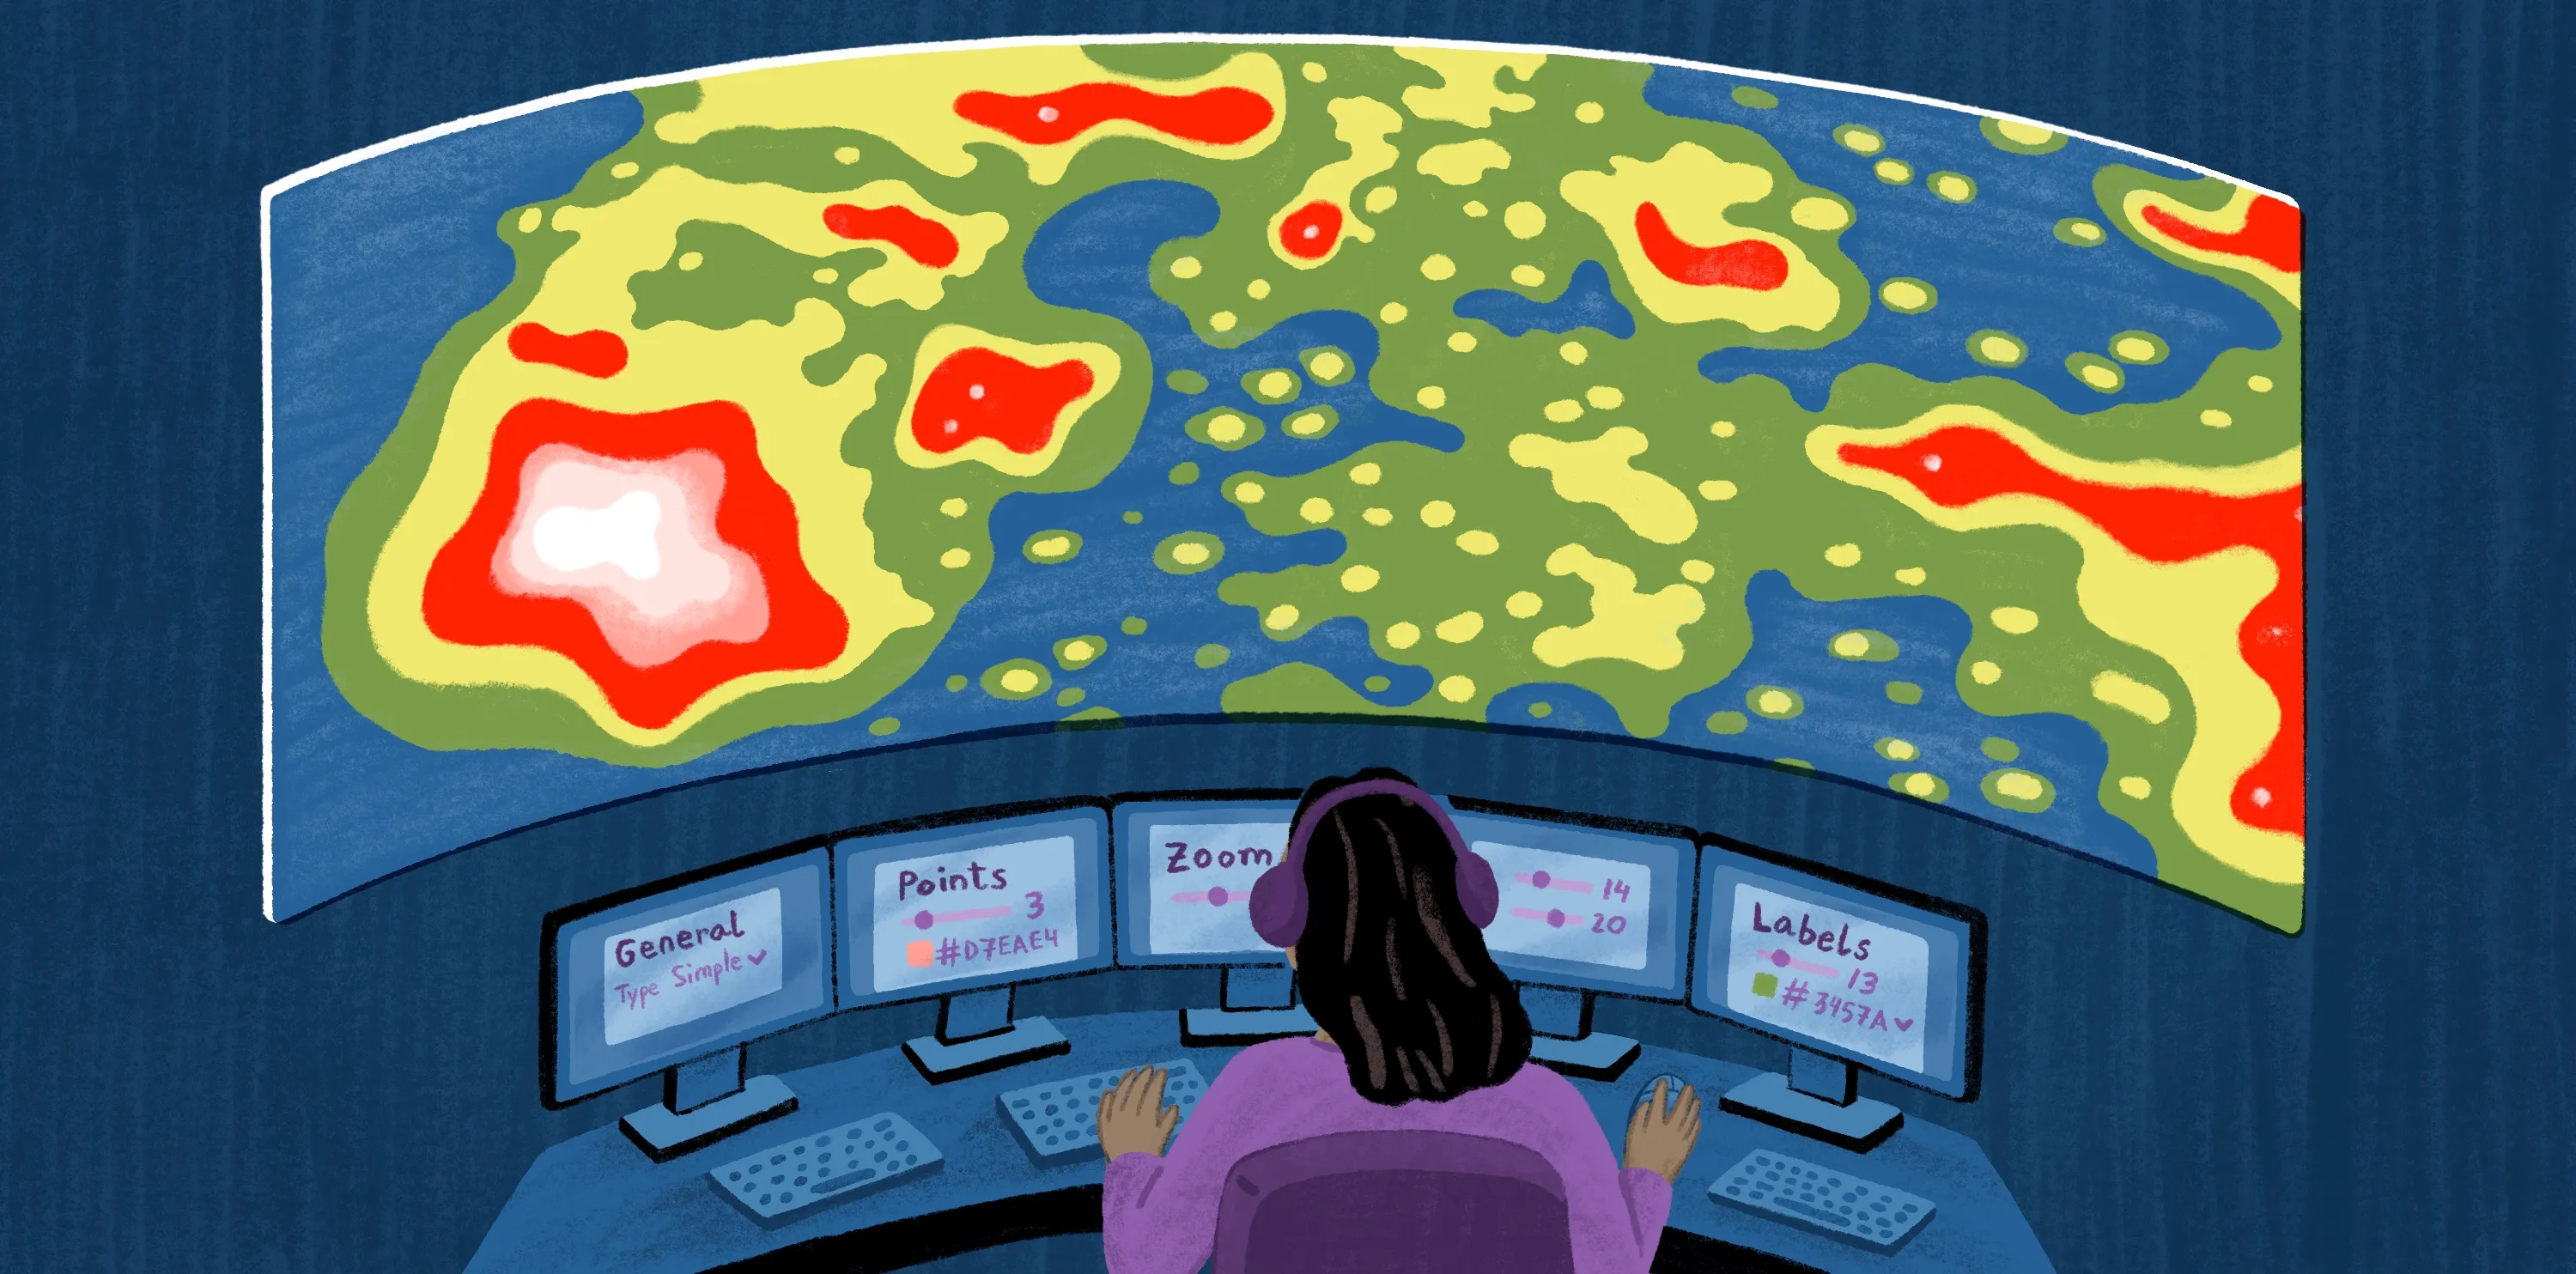
- Dashboards and visualizations: A shared interface to help analysts and decision makers monitor store performance and compare locations using heat maps to spot high-activity zones or weak coverage areas
- Business logic and alerts: Thresholds and scoring systems that flag risk, opportunities, and changes
- Integration with store systems: The links to sales, inventory, and operations platforms to reduce multitool workflows
The benefits of retail location analytics
Retail location decisions are high stakes because they’re costly to reverse. They influence revenue potential, operating costs, and long-term network performance. That’s why location analytics create value beyond typical reports. The main benefits include:
- Improved decision-making: Better visibility into spatial, customer, and market data makes it easier to compare locations and make decisions based on evidence rather than assumptions.
- More efficient planning: When location data connects to existing tools and workflows, you can share insights through maps or dashboards and spend more time on deeper competitive analysis.
- Reduced expansion risk: Data-driven decisions reduce uncertainty by showing whether a market has the right conditions before opening a store.
- Faster response to market change: Location analytics and GIS platforms can receive store-related updates in real time, allowing you to spot opportunities and adjust strategies as conditions change.
What retail location data do retailers use for analysis?
Retail analysis works best when you combine datasets that describe the market from different angles. Each source adds a different layer of intelligence that helps explain factors like demand, movement, and site access. The following core data types give retailers a clearer view of demand and the surrounding competitive landscape:
- Demographics: Population density, income, age, and household characteristics will help estimate demand in an area and judge whether that market matches the customer profile you want to reach.
- Foot traffic and mobility data: Movement patterns, common routes, and peak activity show how people use an area over time. They add a behavioral layer beyond static demographic profiles.
- Competitor data: Store locations, density, and proximity show market saturation and whether a potential site fills a gap or enters a crowded area.
- Geographic context: Roads, travel times, and surrounding land use determine whether a site is realistically reachable and practical for potential customers and operations.
Core location analysis methods retailers use
Here are a few ways retailers use location analysis methods to solve different store-related problems.
Trade area analysis
Trade area analysis defines the geographic area where a store is most likely to attract most of its customers. In GIS workflows, you can model an area in different ways, including:
- Fixed-distance rings
- Drive-time polygons
- Walk-time areas
- Customer-derived trade areas
Trade area analysis helps you understand a store within its market rather than as a single map point. After designing a trade area, you can analyze population levels, spending patterns, and competitor presence within that boundary.
Site selection analysis
Site selection is the process of evaluating and ranking potential sites. That means filtering, scoring, and comparing sites based on multiple business and spatial criteria, such as traffic counts and access routes. This helps you identify which sites best match your retail location strategy and find ones that align most closely with your business model and surrounding market conditions.
Cannibalization analysis
Cannibalization analysis measures how much two or more stores compete for the same customers. In spatial terms, it looks at where trade areas overlap and how a proposed site might shift demand away from existing locations in the same area or network.
For example, a new store can increase convenience and coverage, but it might also redistribute sales instead of creating incremental growth within markets you already serve. Cannibalization analysis shows you the trade-offs before you make decisions, making your expansion more productive long-term.
Market gap analysis
Market gap analysis identifies where demand outpaces current retail supply. Depending on the workflow, that can mean comparing local spending potential to existing sales or pinpointing places where stores aren’t capturing expected customers.
Instead of starting with a site, teams first look at unmet opportunities and evaluate whether that area lacks adequate coverage or whether competition leaves room for growth. That makes it useful for expansion planning, territory prioritization, and understanding where your brand might be underrepresented relative to local demand.
How retailers apply location analytics in practice
Retail location analytics become more valuable if you connect them to repeatable business decisions. Some happen occasionally, like entering a new market, while others are ongoing, like optimizing for local demand. Here’s what it looks like in practice:
- Choosing new locations: Teams compare candidate sites against relevant factors like nearby demand, accessibility, and competitors. For example, a grocery chain can narrow 20 sites to five locations by comparing nearby household income and drive times.
- Expanding into new markets: Retailers study which cities, districts, or trade areas show the strongest growth potential. Think of a clothing brand targeting a secondary city where its target customer base is growing and supply is limited.
- Optimizing existing store networks: Analysts assess whether the current footprint still matches demand and whether some stores overlap too heavily while other areas are underserved. For instance, you can relocate one of two overlapping stores to another area with weaker coverage.
- Localizing marketing campaigns: Retailers use location data to personalize messaging and promotions to the customer profile and patterns around each store. For example, a sporting goods store promotes different product lines based on local interests and demographics.
- Sales forecasting demand by location: Teams compare store performance against local market context to forecast sales across locations. A coffee chain can adjust stock levels and staffing by store based on differences in weekend and commuter traffic.
Common challenges in retail location analytics
Here are a few common obstacles retailers face when using location analytics:
- Data fragmentation: Information spread across tools slows analysis and weakens competition analysis.
- Outdated or static datasets: Location decisions lose value when the underlying data no longer reflects current market conditions. Outdated demographic files or old spatial layers can mislead you into evaluating a market that’s already changed.
- Complex tools requiring GIS expertise: Many spatial workflows depend on specialized tools or technical knowledge, which limits who can work with spatial intelligence and share results.
- Communication gaps: Even with technical expertise, hard-to-read outputs make it difficult to align team members on store locations and strategy.
Make smarter spatial decisions for your store with Felt
Modern retail decisions depend on whether you can turn data into decisions quickly enough to keep up with the market. Retailers need tools that connect spatial layers, business metrics, and mobility signals in one place.
Felt connects directly to your data source such as Snowflake, BigQuery, or Postgres, so retail teams run trade area analysis and site scoring against live customer and demographic data. Felt gives you all that in a browser-based environment where teams can see it all in a single dashboard.
For enterprise retailers and larger teams, you have API and SQL query capabilities for custom workflows and analysis at scale. Plus, our Field App lets you collect on-site observations and sync them back to the same shared retail data maps in real time. This ensures field context isn’t trapped in separate photos or follow-up emails.
Better retail decisions come from efficient data workflows, and Felt turns location intelligence into a practical operating edge for your business.
Compare Felt using AI