37° 48' 15.7068'' N, 122° 16' 15.9996'' W
cloud-native gis has arrived
37° 48' 15.7068'' N, 122° 16' 15.9996'' W
cloud-native gis has arrived
37° 48' 15.7068'' N, 122° 16' 15.9996'' W
cloud-native gis has arrived
37° 48' 15.7068'' N, 122° 16' 15.9996'' W
cloud-native gis has arrived
37° 48' 15.7068'' N, 122° 16' 15.9996'' W
cloud-native gis has arrived
37° 48' 15.7068'' N, 122° 16' 15.9996'' W
cloud-native gis has arrived
37° 48' 15.7068'' N, 122° 16' 15.9996'' W
cloud-native gis has arrived
37° 48' 15.7068'' N, 122° 16' 15.9996'' W
cloud-native gis has arrived
37° 48' 15.7068'' N, 122° 16' 15.9996'' W
cloud-native gis has arrived
37° 48' 15.7068'' N, 122° 16' 15.9996'' W
cloud-native gis has arrived
Ask a question. Get a map. The new era of GIS, powered by Felt AI.
Learn more
PLATFORM
Web GIS
Dashboards
Cloud Sources
App Development
Raster
Felt AI
Field App
Industries
agriculture
Cities and Government
CLIMATE and NATURAL RESOURCES
Education
Energy and Utilities
Engineering and Infrastructure
Insurance
Real Estate
Retail
Spatial Intelligence
Telecom
Transportation
Resources
Customers
Webinars
Help Center
Developer Docs
map Gallery
Blog
QGIS Plugin
PRICING
BOOK A
DEMO
Log in
Sign Up
Log in
SIGN UP
Book Demo
Pricing
Product
WEB GIS
Dashboards
Cloud Sources
App Development
Raster
Felt AI
Field App
Industries
agriculture
Cities and Government
CLIMATE AND NATURAL RESOURCES
Education
Energy and Utilities
engineering and infrastructure
Insurance
Real Estate
Retail
Telecom
Transportation
Spatial Intelligence
Resources
Webinars
Help Center
Dev Docs
Map gallery
Customers
BLOG
QGIS Plugin
Map Gallery
Emergency response
Felt Picks
Our selects for maps that we love, whether they’re useful, interesting, beautiful, or just unique.
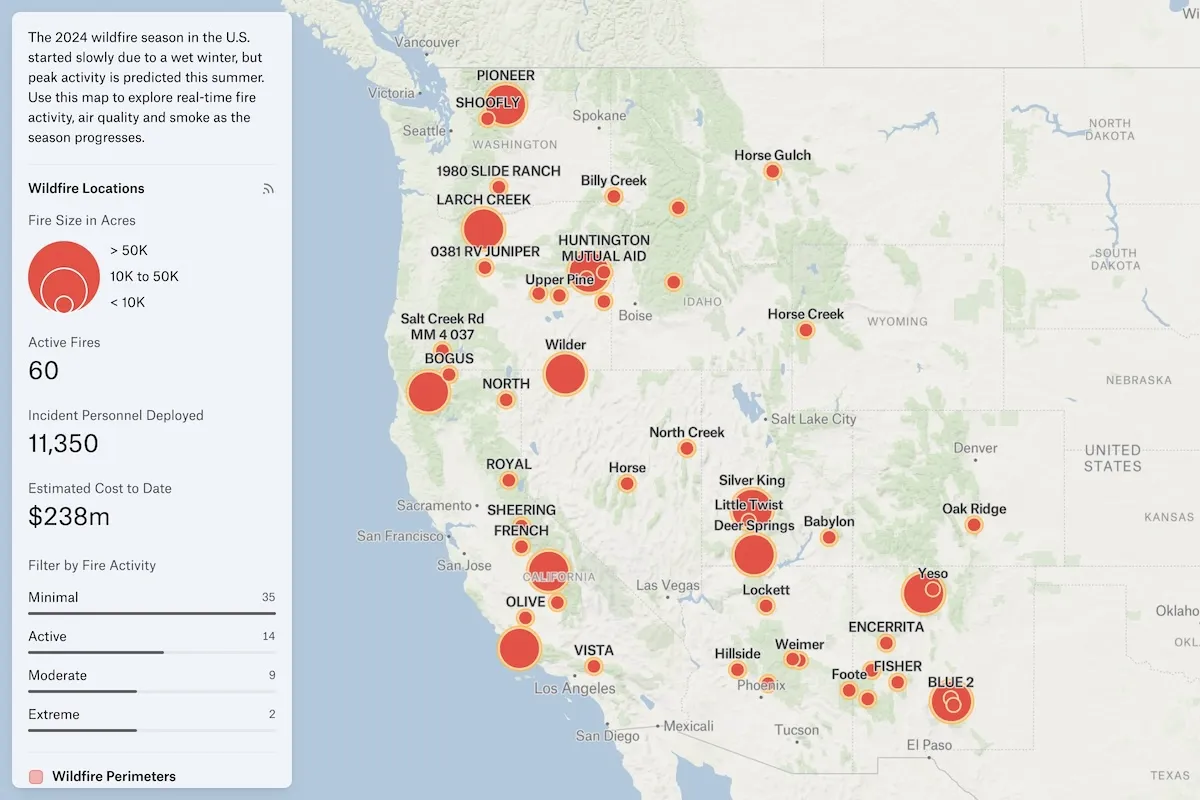
Active Wildfires in the U.S.
A dashboard that monitors current U.S. wildfires, smoke activity and air quality using live sources from the National Interagency Fire Center and the National Oceanic and Atmospheric Administration.
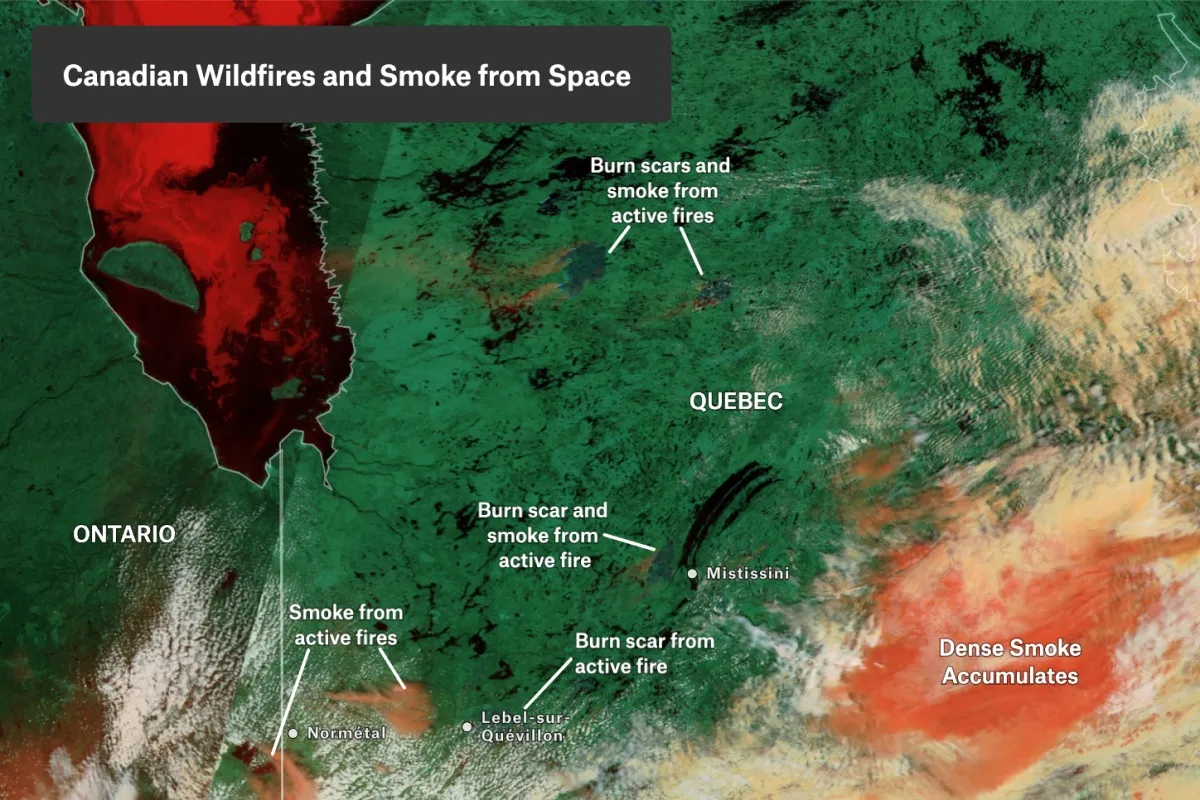
Canadian Wildfires and Smoke from Space
The Terra MODIS 3-6-7 Color Reflection composite from NASA aids in detecting active fires and assessing the extent of smoke plumes. Using Felt annotations, these areas can be highlighted on the image contributing valuable insight into Canada's worst wildfire season and its impact on air quality.
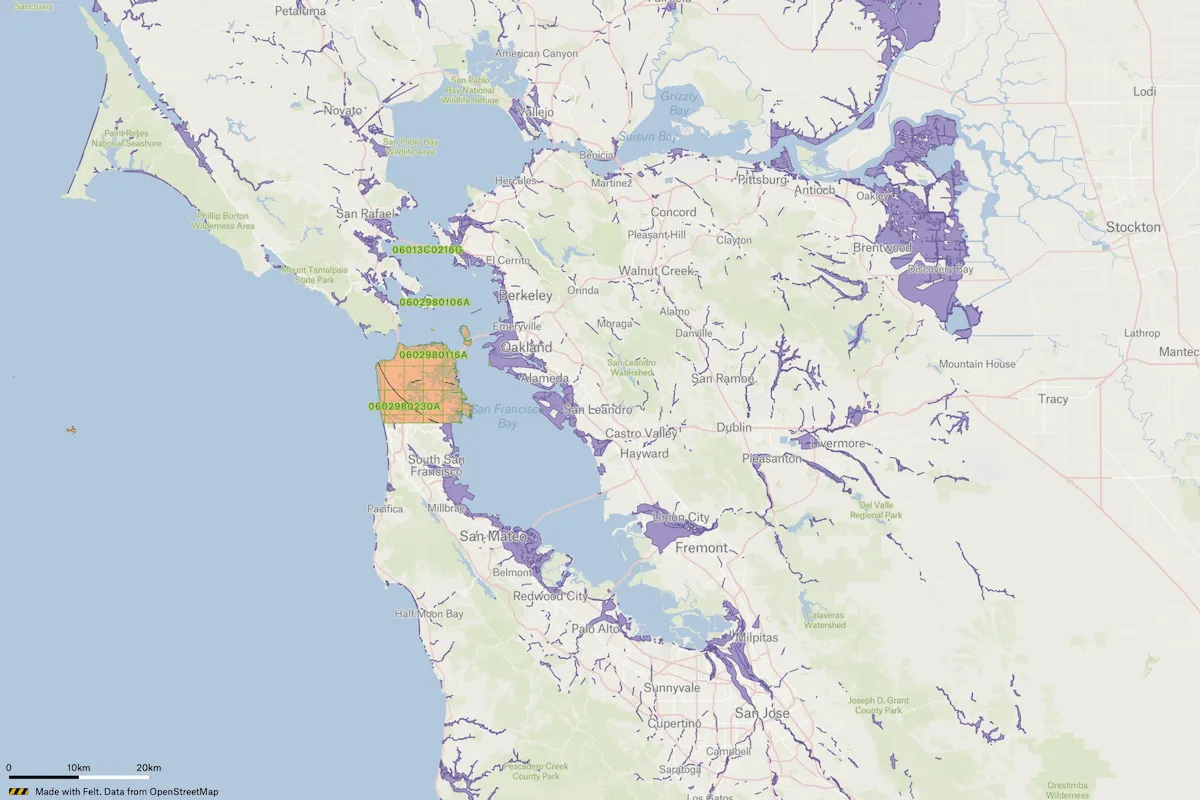
San Francisco FEMA Hazard Map
A detailed view of San Francisco's hazard zones with data provided by FEMA, including: Flood Hazard Areas, Seismic Hazard Zones, Tsunami Inundation Hazard Zones, and Soil Liquefaction Hazard Zones.
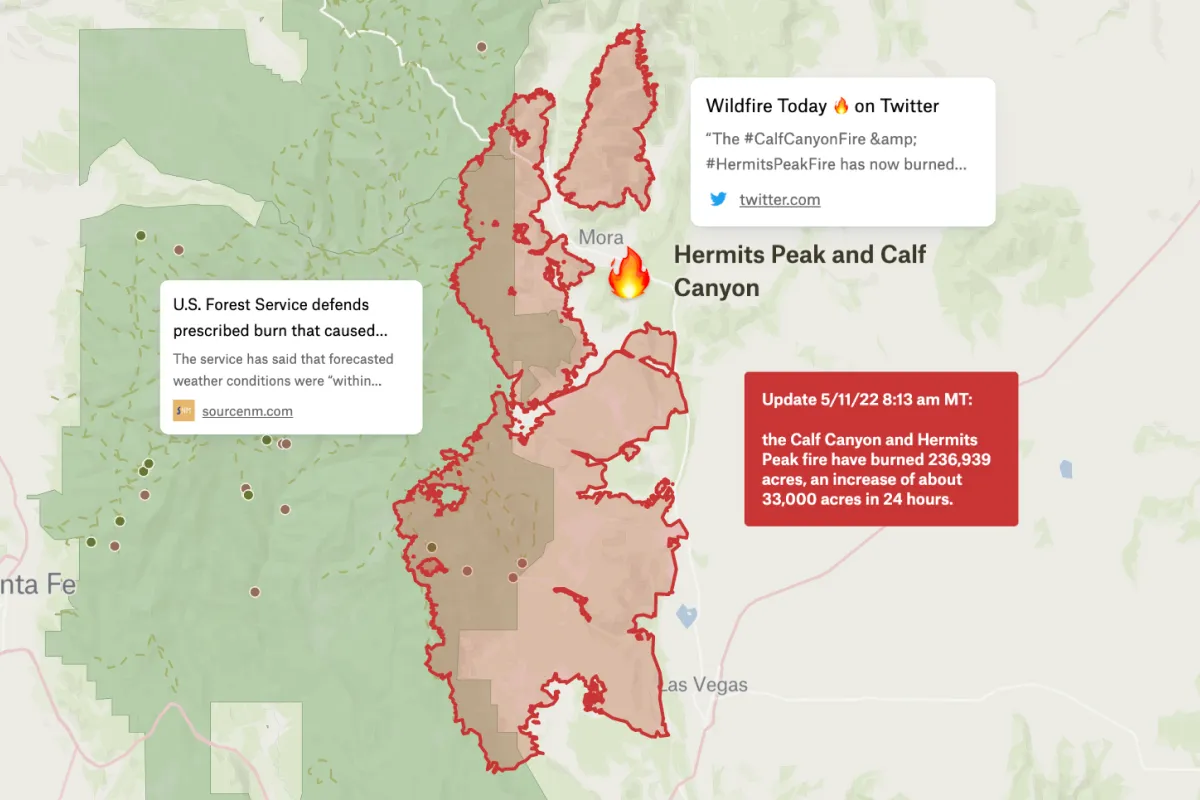
Hermits Peak & Calf Canyon Fires
Calf Canyon and Hermit's Peak fire perimeter data from May 11, 2023.
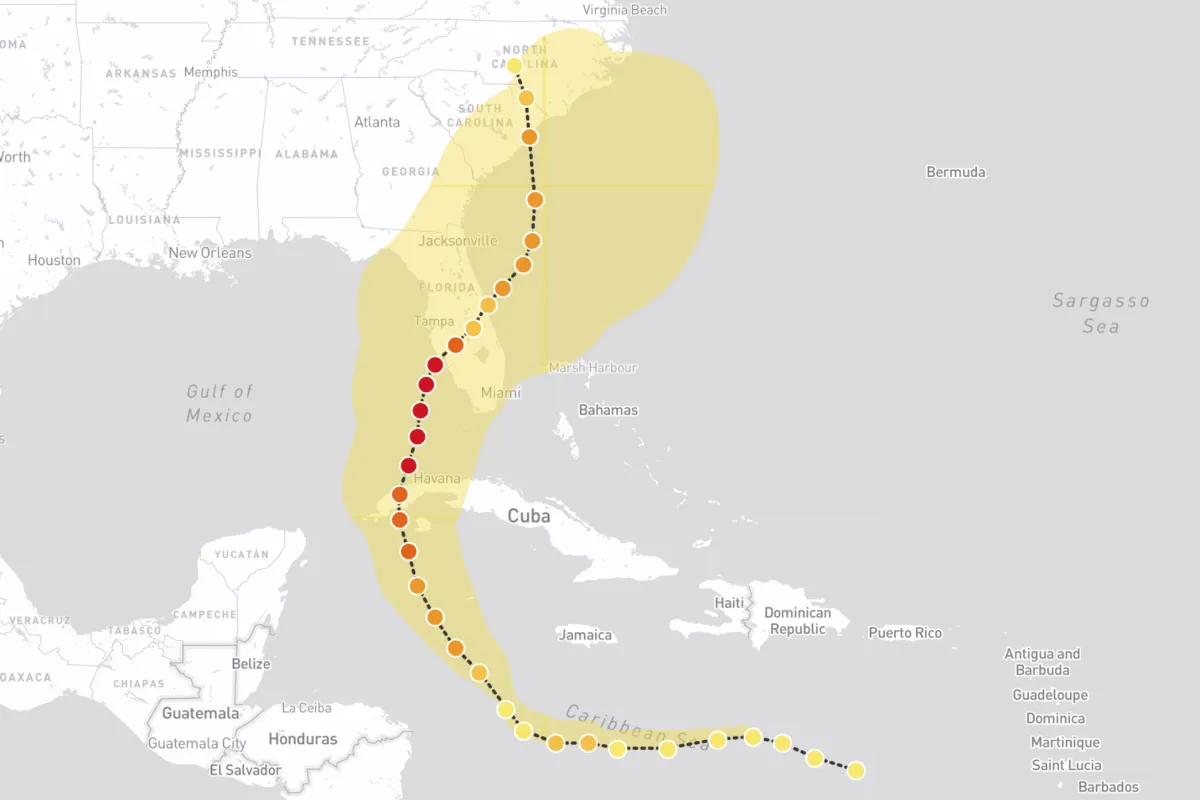
Hurricane Ian
Hurricane Ian's path, intensity and far-reaching wind-speeds.
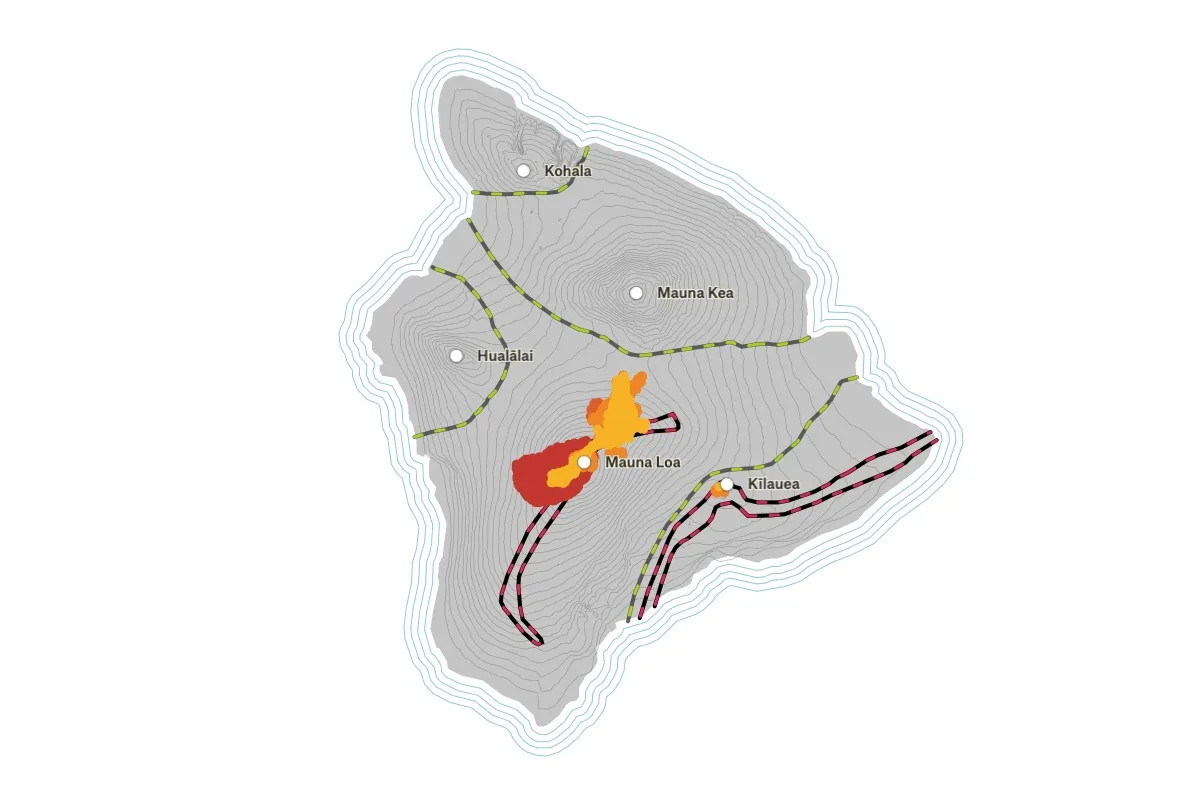
Mauna Loa Hazard Zones
Lava flow hot spots from the 2022 eruption of Mauna Loa on the island of Hawai'i.
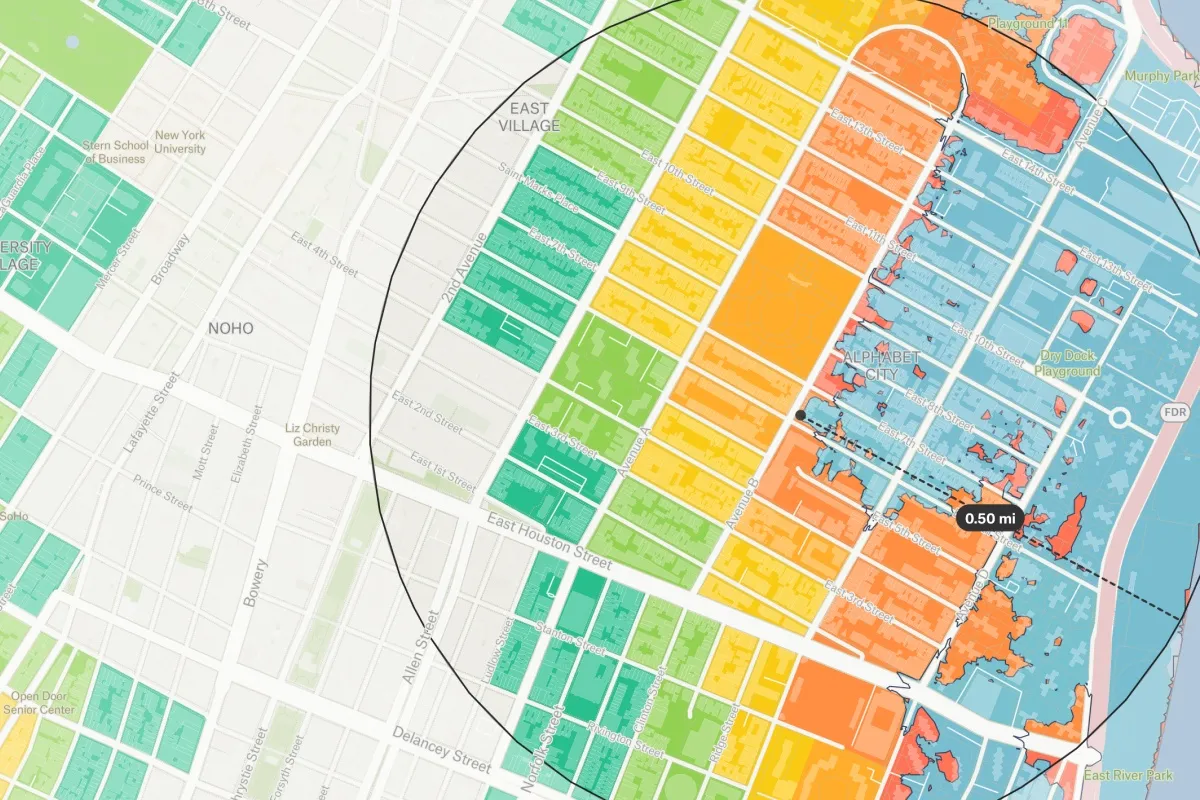
Hurricane Sandy Impact Analysis
An exploration of Hurricane Sandy's impacts on New York City's infrastructure.
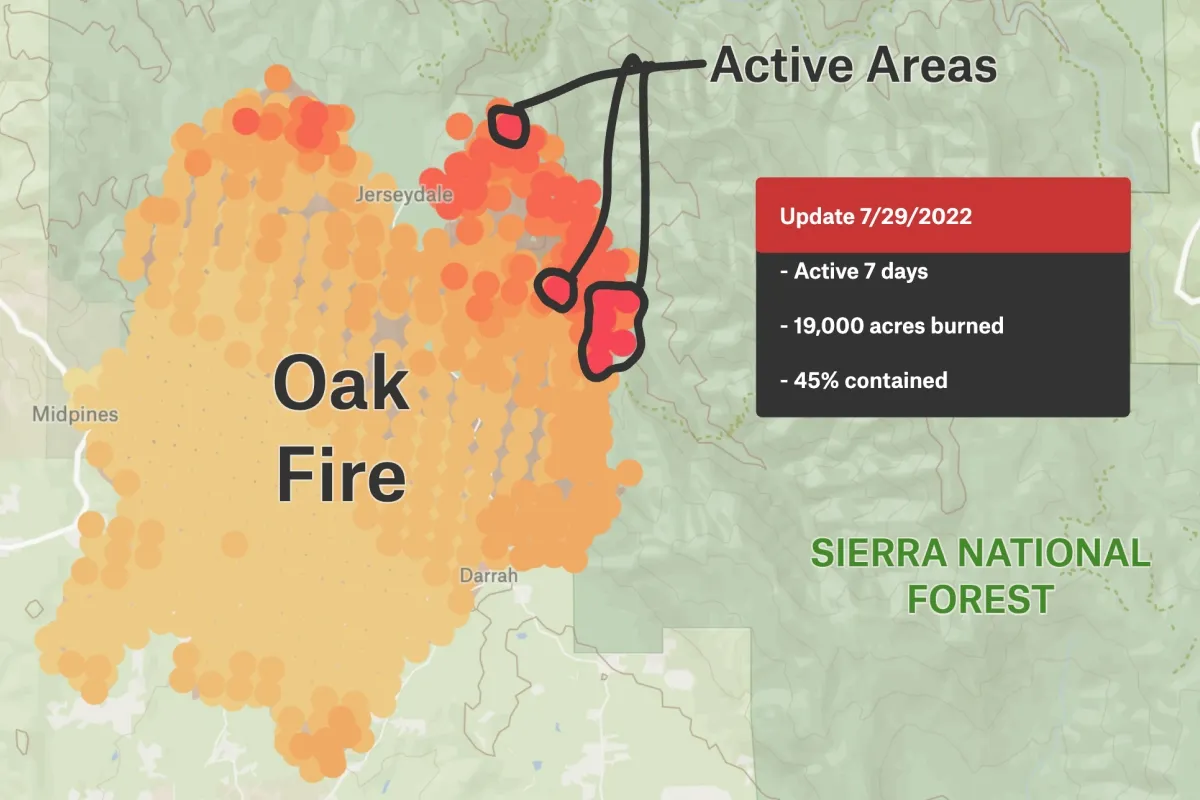
Oak Fire Progression
The extent and direction of the Oak Fire's progression in Northern California.
Categories
Agriculture
Cities and government
Climate and natural resources
Emergency response
Energy and utilities
Exploration
Finance
Insurance
Planning
Real estate
Spatial intelligence
Telecom
Transportation