The top 8 weather data sources for GIS mapping
Weather plays a key role in all kinds of spatial decisions, from planning major infrastructure to managing agricultural risks. But as any GIS analyst knows, choosing a weather data source is only half the battle. The real challenge is finding reliable data to use in spatial analysis.
This guide breaks down the leading global weather databases for GIS mapping. We’ll also cover how to evaluate data quality and show you practical ways to apply that information in spatial workflows.
What makes a weather data source reliable for GIS?
Weather data built for consumer apps is rarely detailed or precise enough for professional GIS workflows. Free apps provide general updates, but they often have low resolution and miss local microclimates. For critical tasks like flood assessments and crop management, this can lead to costly mistakes due to missed timing or inaccurate historical records.
GIS workflows rely on consistent, well-structured data. Teams need a simple way to check whether data sets meet their spatial and temporal requirements. The following criteria offer a framework for evaluating any weather data source for GIS use.
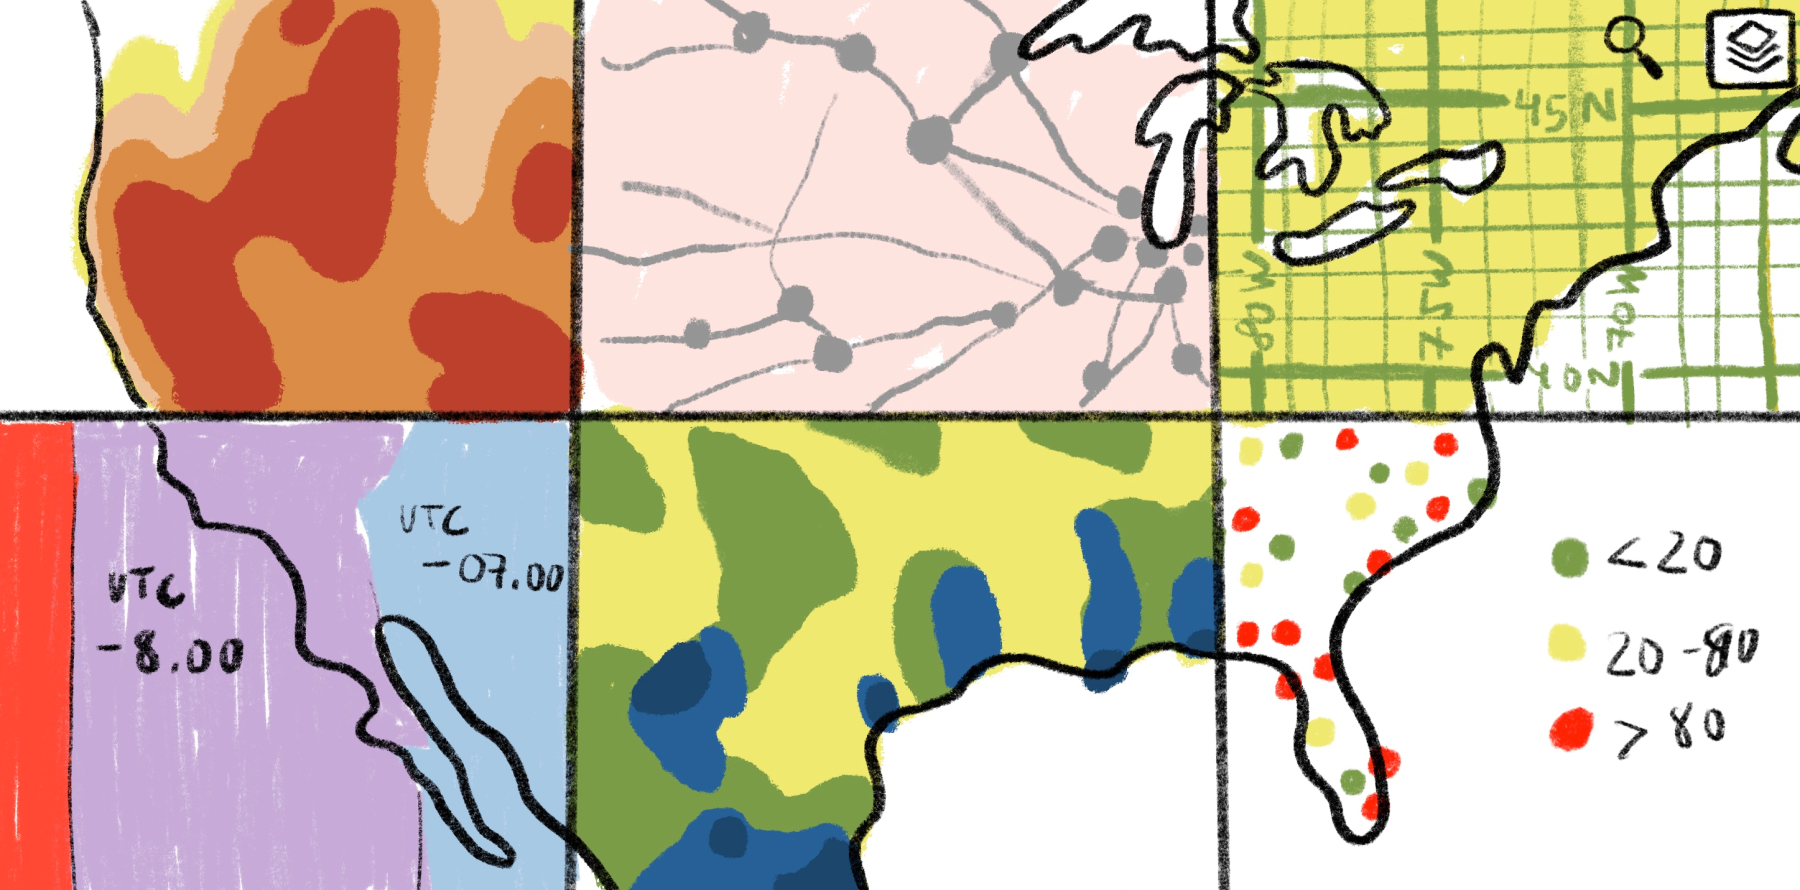
Spatial resolution
Spatial resolution is the level of detail a data set captures across a geographic area, usually defined by grid size. Smaller grid cells reveal localized variation that’s helpful for site-level analysis and terrain-driven modeling. Fine grids offer more detail (precision/resolution), but they don’t automatically guarantee higher accuracy (truthfulness) if the data has systematic bias or sensor noise.
Larger grids smooth out these differences, making them suitable for regional overviews. They reduce noise but can miss important nuances on the ground. Higher resolution is generally preferred for highlighting local variation. But in some cases, lower-resolution data works better if the high-resolution source is noisy or biased.
Temporal resolution
Temporal resolution measures how often a data set updates. Near-real-time feeds are ideal for live monitoring and short-term decision-making. Other sources that update daily or monthly work well for trend analysis and historical modeling, where long-term patterns matter more than minute-to-minute variation. Aligning your use case with update frequency — or revisit time — helps you avoid data that’s too coarse or detailed for the task.
Data format
Weather data comes in different formats and file types, but some are better than others for GIS applications:
- Raster grids (GeoTIFF): Represents continuous information across a geographic area and integrates well with most GIS platforms.
- Tabular files (CSV): Organizes observations by time and location. Structured CSVs load easily into GIS, but irregular files require cleaning first.
- NetCDF: Acts as a container for multidimensional raster data. Certain GIS software reads netCDF directly, but you need to select the relevant dimensions.
- Weather-specific formats (GRIB and HDF5): Calls for preprocessing or conversion, such as reprojecting data, before applying to GIS workflows.
The right file type ensures the data fits neatly into your existing tools, minimizing extra cleanup or reformatting.
Coverage and historical depth
Coverage describes the geographic areas where weather data is available, while historical depth indicates how far back your records go. Broad coverage supports large-scale analyses or projects spanning multiple regions. When paired with long-term records, it helps identify trends, assess risk, and build predictive models.
Limited coverage or incomplete records restrict spatial analysis, particularly for projects that rely on historical context. Even data sets with high coverage and long weather database history can produce weak results if they’re noisy or error-prone. Accuracy ultimately determines whether your analysis is trustworthy, regardless of how much data you’ve collected.
No single weather data source works for every use case. The right choice depends on how well a data set aligns with your spatial question and the level of detail you need.
8 best weather data sources for GIS
Weather data analytics come from a mix of public agencies, API platforms, and commercial providers. Each source has a different balance of precision and accessibility. The options below represent the most widely used systems for GIS analysis.
Official and government sources
Government data sets are the backbone of many GIS analyses. They’re highly reliable, often freely available, and house decades of historical records. That’s what makes them a go-to for environmental monitoring and public-sector projects like urban planning and disaster preparedness. Access requires navigating government portals, but the payoff is greater accuracy and transparency.
1. NOAA National Weather Service
The National Weather Service (NWS) offers a wide range of weather observations and alerts in GIS-compatible formats like shapefiles and CSV. Available data layers include watches, warnings, and flood and storm advisories. This is a trusted resource for emergency response planning and regional weather analysis, in addition to public safety studies. You can also access forecasts and current conditions through the National Digital Forecast Database (NDFD) XML web services, which integrate easily into GIS workflows.
2. NCEI Climate Data Online
The NCEI provides extensive weather and climate records on daily temperatures and extreme events. Data sets like GHCN-Daily offer observations from thousands of stations worldwide, with some records stretching more than 175 years. Available in CSV and netCDF formats, NCEI data can be filtered by station, county, state, or country — so it’s easy to pair with GIS workflows for trend analysis and climate research.
3. Meteorological Assimilation Data Ingest System (MADIS)
MADIS brings together surface station reports, radiosondes, and other specialized sources into a single data set with consistent units and timestamps. It covers standard meteorological variables, like temperature and humidity from thousands of stations across the U.S. and around the world.
Because MADIS updates frequently and combines multiple observation types, it supports near-real-time modeling and situational analysis. Teams use this to track flood development and monitor rapidly changing crop conditions.
4. Parameter-elevation Regressions on Independent Slopes Model
Parameter-elevation Regressions on Independent Slopes Model (PRISM) merges observational station data with topographic modeling to create high-resolution raster climate grids. It measures variables like precipitation, dew point, and maximum/minimum temperature at resolutions of ~800m to ~4km. These spatially continuous grids are used in precision agriculture and similar applications that need landscape-level data.
Weather data APIs
If your workflow involves automation or integrating live weather data into apps and models, APIs are a natural fit. They allow easy programmatic access, so you can pull data on demand and feed it straight into your GIS or modeling environment. The following are two widely used platforms and how they deliver forecasts and historical weather data for spatial analysis.
5. Open-Meteo
Open-Meteo delivers free weather forecasts through a simple API in JSON format. The platform generates hourly and daily forecasts for conditions like temperature, wind speed, and cloud cover — with global coverage and no API key required. With its lightweight structure, Open-Meteo supports feeding real-time or short-term forecasts into predictive models and automated workflows.
6. OpenWeatherMap
OpenWeatherMap shares current conditions and past weather data through a RESTful API, with responses in JSON and CSV for easy integration into GIS tools. It measures data on wind speed and air quality, along with endpoints for hourly forecasts, multi-day outlooks, and historical time series. The flexible API makes OpenWeatherMap well-suited for small-scale monitoring and applications that require live weather statistics.
Commercial weather data sources
Commercial providers support teams that need precise global weather data. They offer proprietary forecast models, high-resolution grids, and dedicated technical support. The following work well for high-stakes projects like energy planning and insurance risk modeling.
7. Meteomatics
Meteomatics provides access to hyper-local forecasts and gridded climate data sets via API or bulk download. It includes detailed parameters like wind, solar radiation, and soil moisture, often at high spatial and temporal resolution. Teams use this information for energy forecasting, like predicting wind and solar output, as well as for precision agriculture.
8. Weather Source
Weather Source blends global observational networks with proprietary modeling to deliver ready-to-use data sets. It covers everything from temperature and precipitation to more specialized variables such as wind gusts and lightning strikes. You can access Weather Source data in shapefiles or CSV and integrate it into GIS workflows for research and risk assessments like urban heat studies.
GIS use cases for weather data
Analyzing weather data in a spatial context reveals its full value. In GIS workflows, meteorological variables combine with land use layers and environmental data sets to evaluate spatial risks in more detail. Here’s how teams apply this data across three industries.
Urban planning and infrastructure
City planners, engineers, and municipal teams use weather data to keep communities safe. They analyze what streets and bridges are most at risk of flooding and which neighborhoods experience extreme heat. By mapping precipitation and temperature data alongside transportation networks and population density, planners can identify high-risk areas and improve emergency response.
Agriculture and land management
Weather data helps farmers and land managers make smarter decisions for crop production and resource allocation. GIS tools show fields at risk of drought and highlight where to prioritize irrigation or frost protection. When teams measure precipitation, temperature, and soil types on the same hydrological map, they can take targeted action to improve yields and conserve water.
Climate research and environmental science
Researchers use GIS systems to analyze historical weather and climate data. For example, they look at links between climate and ecosystems, such as how average temperatures have shifted over the past 50 years or which areas are vulnerable to deforestation. Mapping extreme weather events with topography, land cover, and vegetation data sets provides location-specific insights into climate change impact.
Map weather data with Felt
Most teams can find a reliable weather data source, but they lose hours cleaning files, reformatting downloads, or waiting for a GIS specialist to make it usable. By the time the map is ready, only a few team members understand the insights hidden in it.
Felt changes that. The web-based GIS platform lets you create, analyze, and share live maps right in the browser. Weather data streams directly from cloud sources like S3 and BigQuery, so your team always works with the latest information.
Felt AI lets you query your weather layers in natural language, so you can surface flood risk patterns or temperature anomalies in seconds. Plus, raster formats like GeoTIFF load instantly. Once the data is live, teams can build interactive dashboards to track precipitation thresholds, flood risk, and temperature anomalies all in the same place. And spatial insights flow right to your stakeholders — even those with no previous GIS experience.
Explore Felt to experience the full enterprise-level workflow that suits you better and see how weather data moves from raw files to shareable analysis.
Compare Felt using AI


.png)
.jpg)
.jpg)