37° 48' 15.7068'' N, 122° 16' 15.9996'' W
cloud-native gis has arrived
37° 48' 15.7068'' N, 122° 16' 15.9996'' W
cloud-native gis has arrived
37° 48' 15.7068'' N, 122° 16' 15.9996'' W
cloud-native gis has arrived
37° 48' 15.7068'' N, 122° 16' 15.9996'' W
cloud-native gis has arrived
37° 48' 15.7068'' N, 122° 16' 15.9996'' W
cloud-native gis has arrived
37° 48' 15.7068'' N, 122° 16' 15.9996'' W
cloud-native gis has arrived
37° 48' 15.7068'' N, 122° 16' 15.9996'' W
cloud-native gis has arrived
37° 48' 15.7068'' N, 122° 16' 15.9996'' W
cloud-native gis has arrived
37° 48' 15.7068'' N, 122° 16' 15.9996'' W
cloud-native gis has arrived
37° 48' 15.7068'' N, 122° 16' 15.9996'' W
cloud-native gis has arrived
Introducing Felt AI, your built-in team of spatial engineers
Learn more
PLATFORM
Web GIS
Dashboards
Cloud Sources
App Development
Raster
Felt AI
Field App
Industries
agriculture
Cities and Government
CLIMATE and NATURAL RESOURCES
Education
Energy and Utilities
Engineering and Infrastructure
Insurance
Real Estate
Retail
Spatial Intelligence
Telecom
Transportation
Resources
Customers
Webinars
Help Center
Developer Docs
map Gallery
Blog
QGIS Plugin
PRICING
BOOK A
DEMO
Log in
Sign Up
Log in
SIGN UP
Book Demo
Pricing
Product
WEB GIS
Dashboards
Cloud Sources
App Development
Raster
Felt AI
Field App
Industries
agriculture
Cities and Government
CLIMATE AND NATURAL RESOURCES
Education
Energy and Utilities
engineering and infrastructure
Insurance
Real Estate
Retail
Telecom
Transportation
Spatial Intelligence
Resources
Webinars
Help Center
Dev Docs
Map gallery
Customers
BLOG
QGIS Plugin
Map Gallery
Climate and natural resources
Felt Picks
Our selects for maps that we love, whether they’re useful, interesting, beautiful, or just unique.
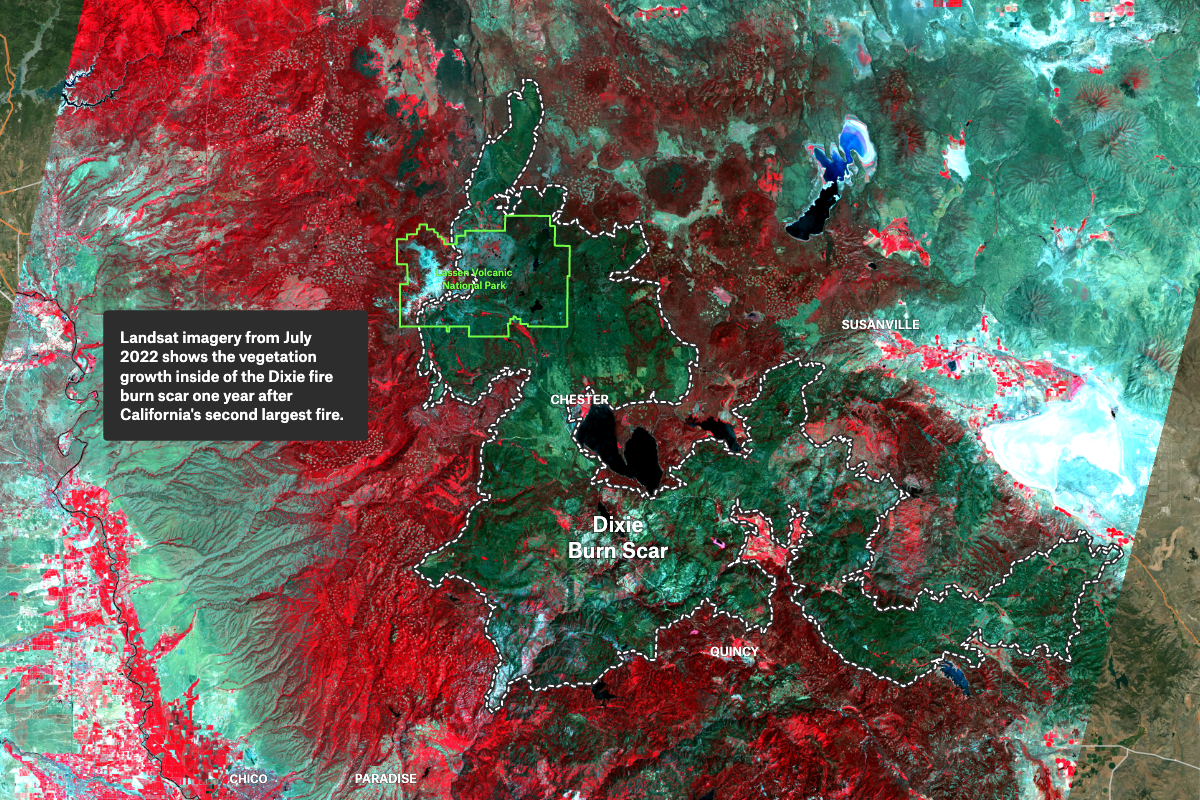
Landsat Dixie Fire
Annotate on top of images to tell a story, like this Landsat imagery map of new vegetation growth after the Dixie Fire.
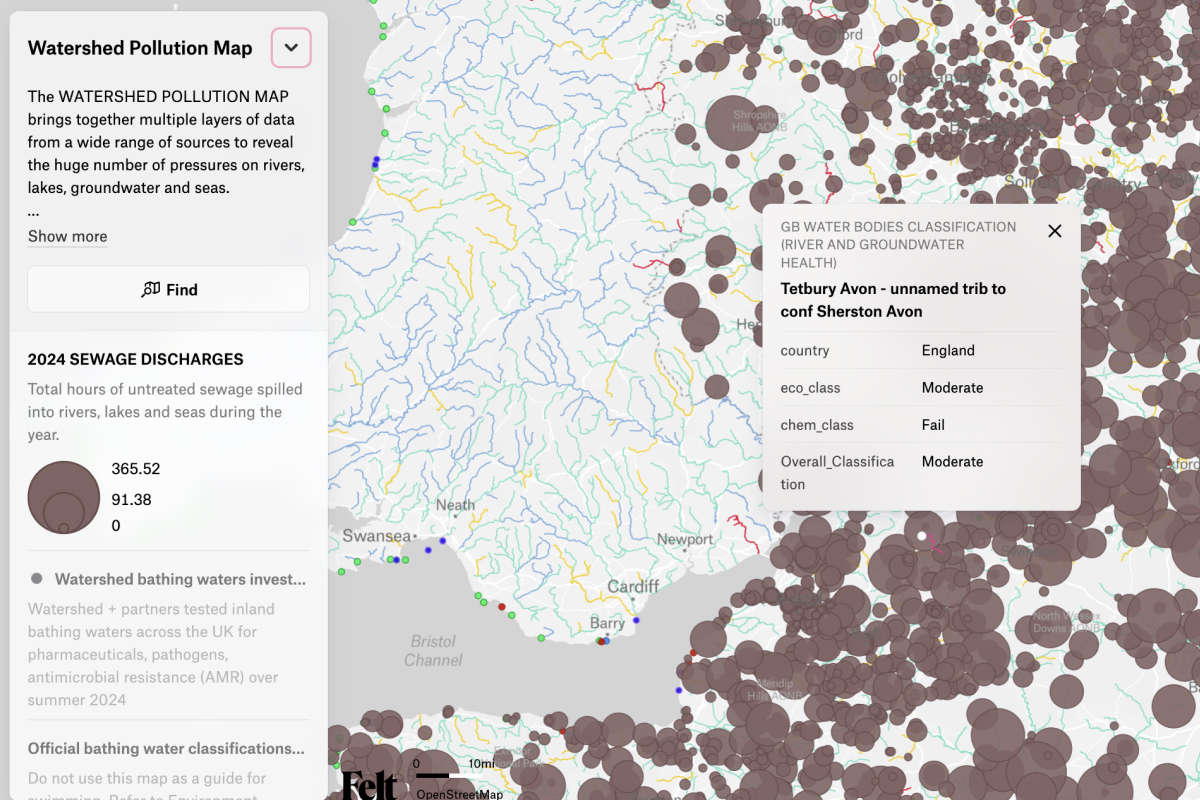
The Watershed Pollution Map
The Watershed Investigations Pollution Map reveals a huge range of potential pollution sources that can harm rivers, lakes, groundwater, coasts and more.
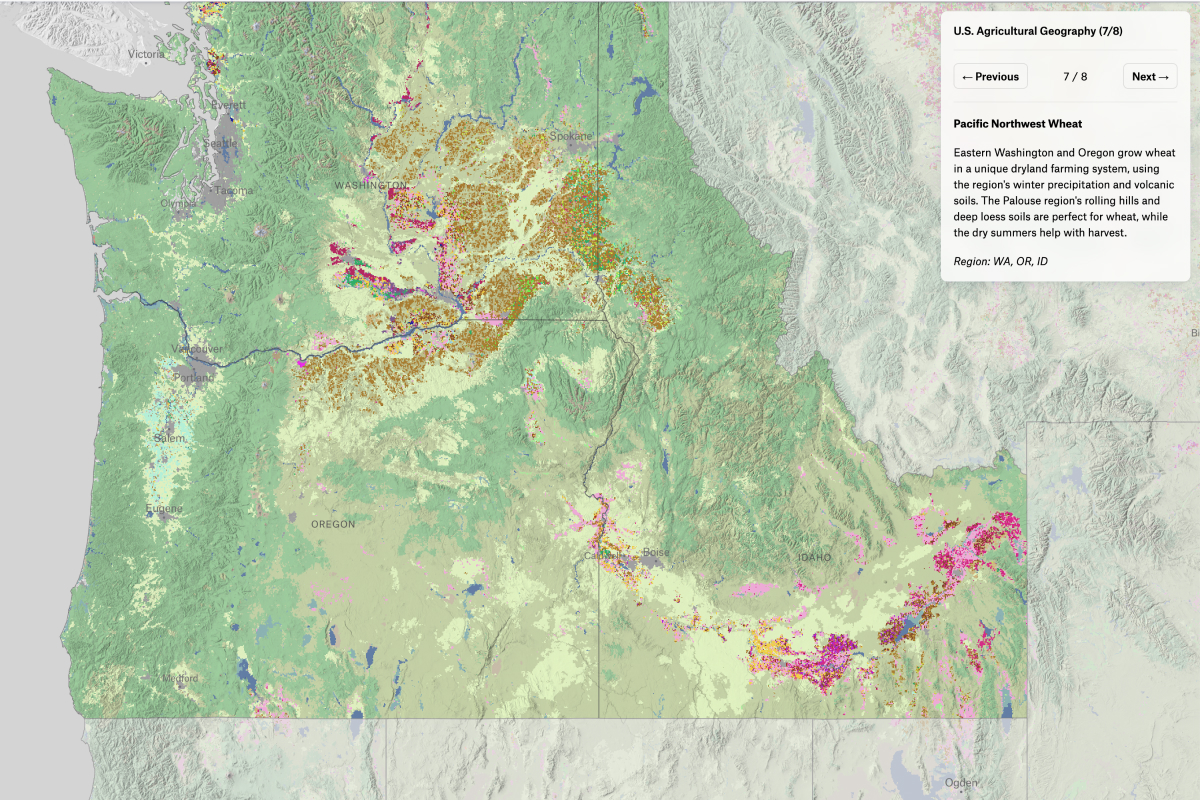
CropScape Story Map
Explore crop patterns across the U.S. through an interactive, guided story.
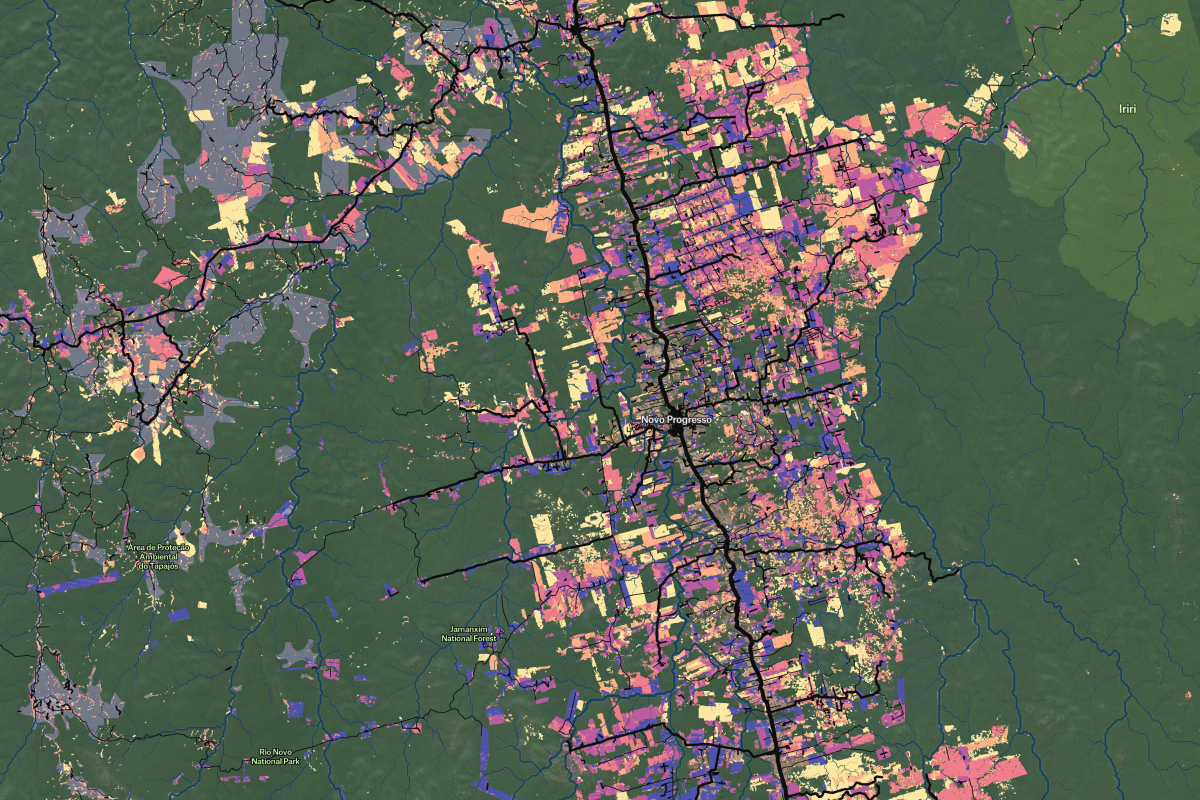
Deforestation Monitoring
Forest loss near Novo Progresso, Brazil reveals how roads drive Amazon deforestation patterns over 22 years.
Carbon Capture Siting
Identify and evaluate promising carbon capture project locations.
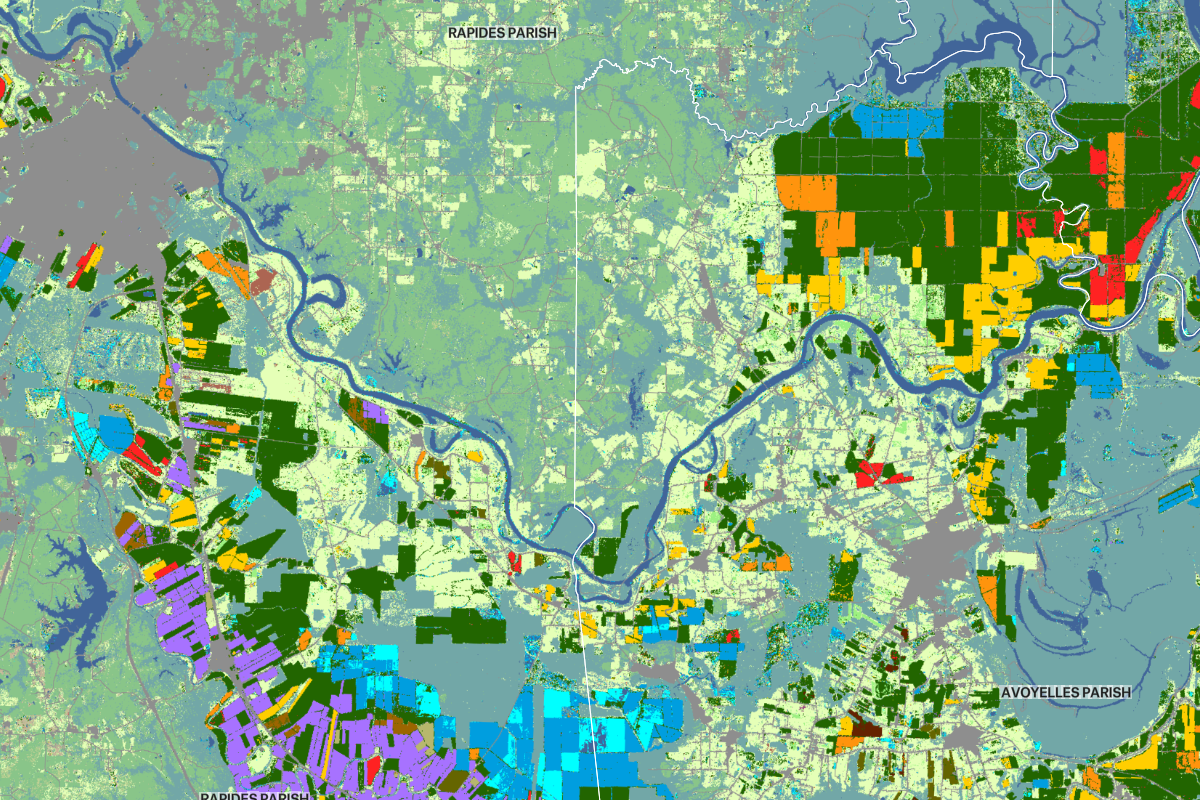
CropScape Louisiana
Raster data that contains color information, like this dataset from CropScape, will display with it’s own color scheme by default.
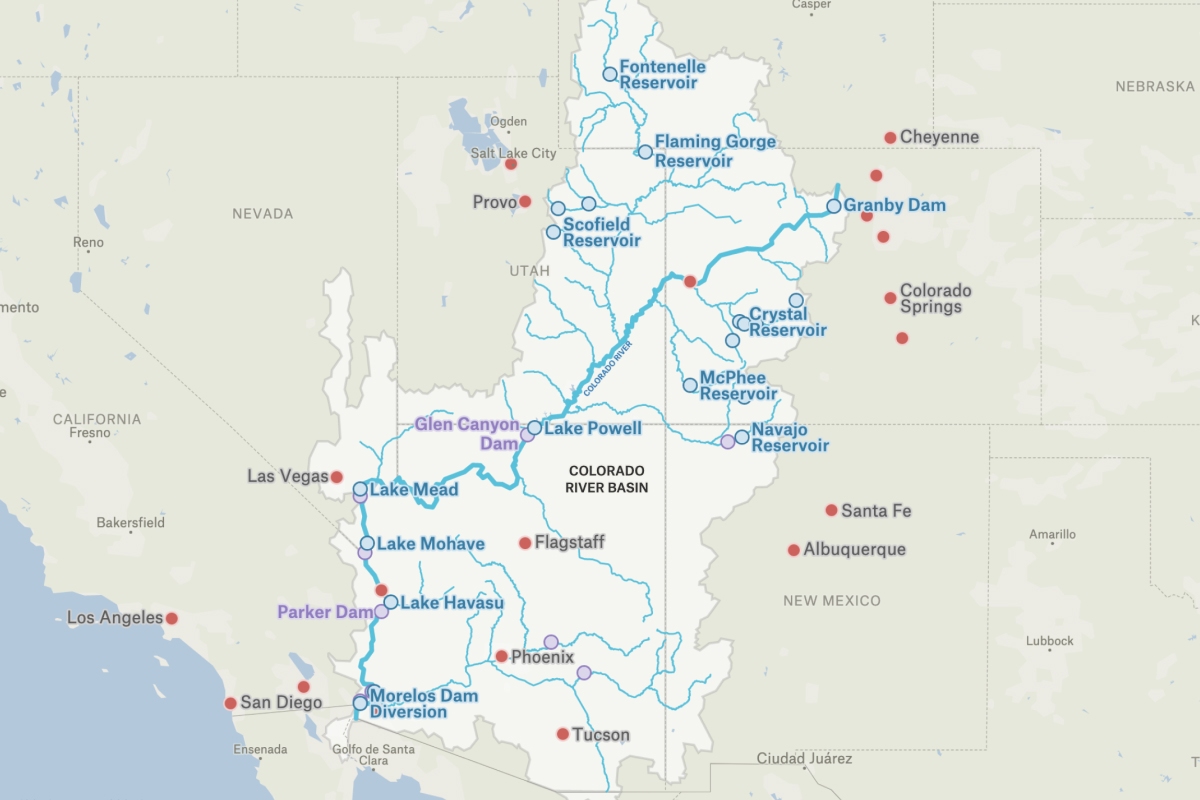
Colorado River Basin
250,000 square miles of the Colorado River Basin.
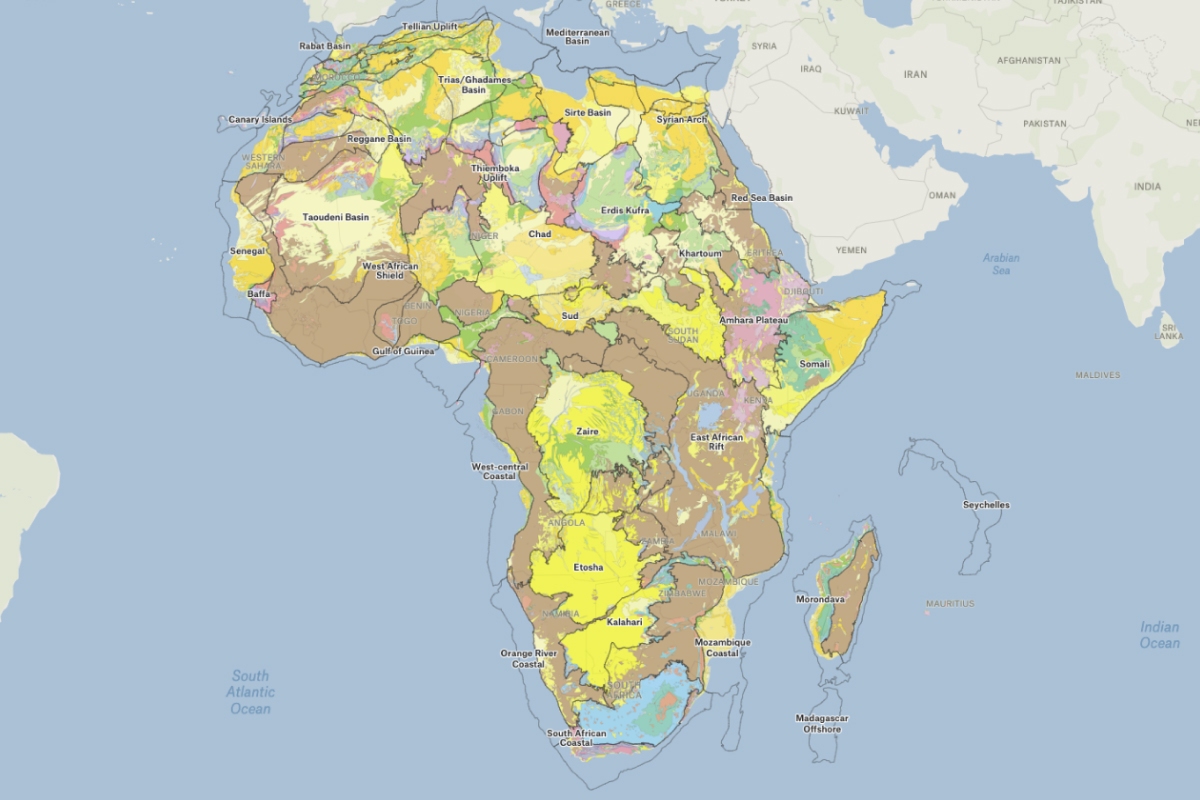
Geology of Africa
The complex geology of the African continent.
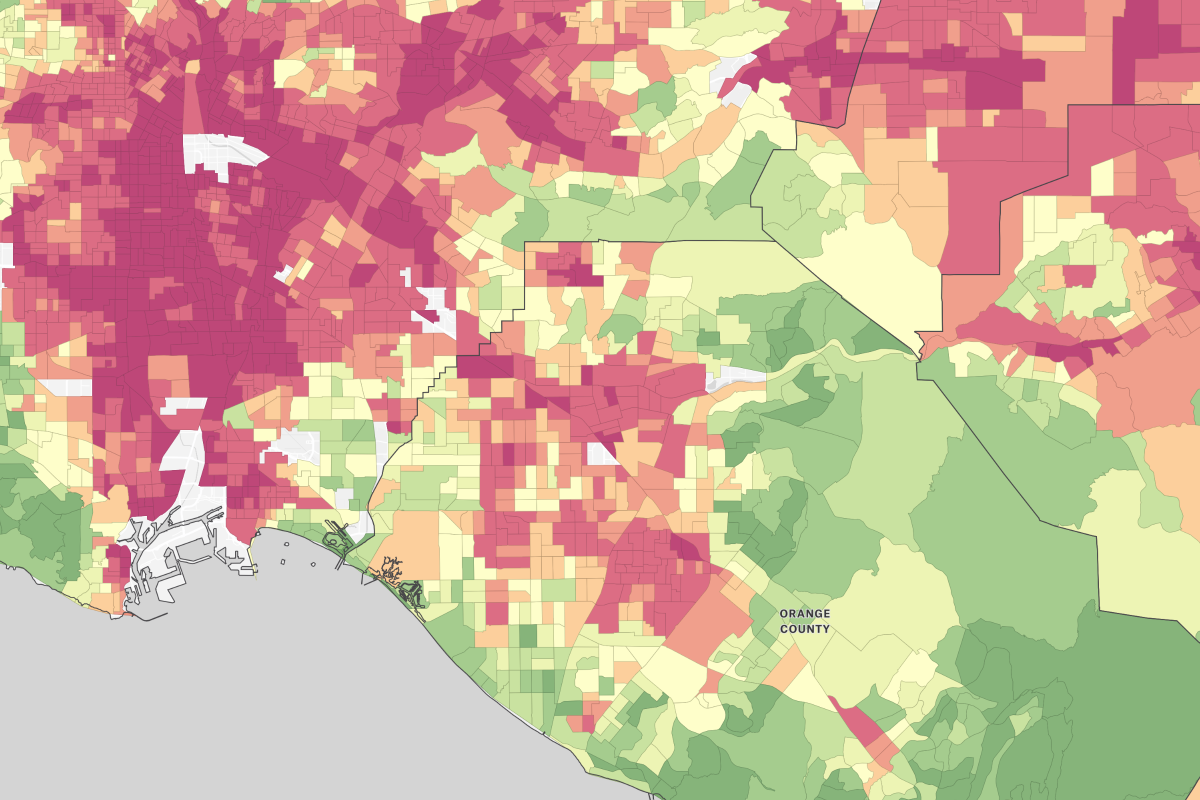
Pollution Burden Analysis
Identify communities facing the greatest pollution and socioeconomic burdens.
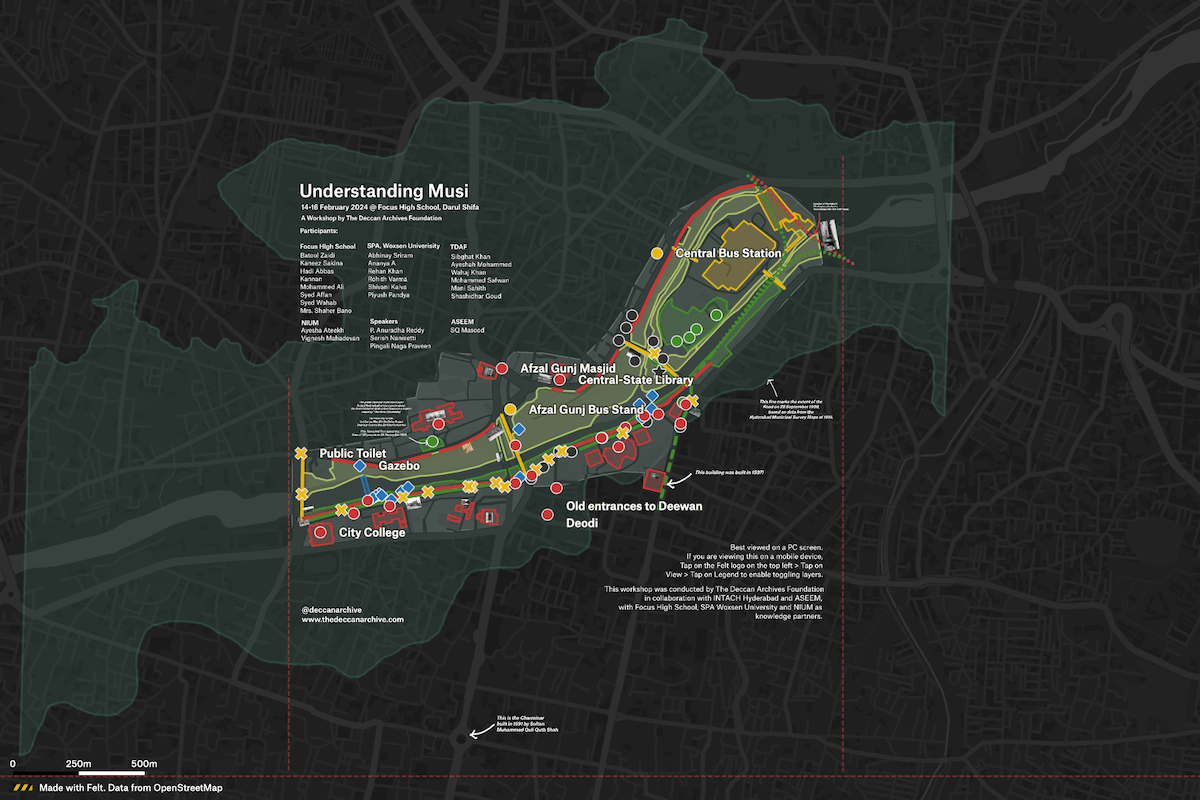
Understanding the Musi River
In a workshop hosted by The Deccan Archives Foundation, in collaboration with INTACH Hyderabad and ASEEM, collaborators mapped the historic core of the river Musi through on site visits, and sessions on history and ecology of the river by experts.
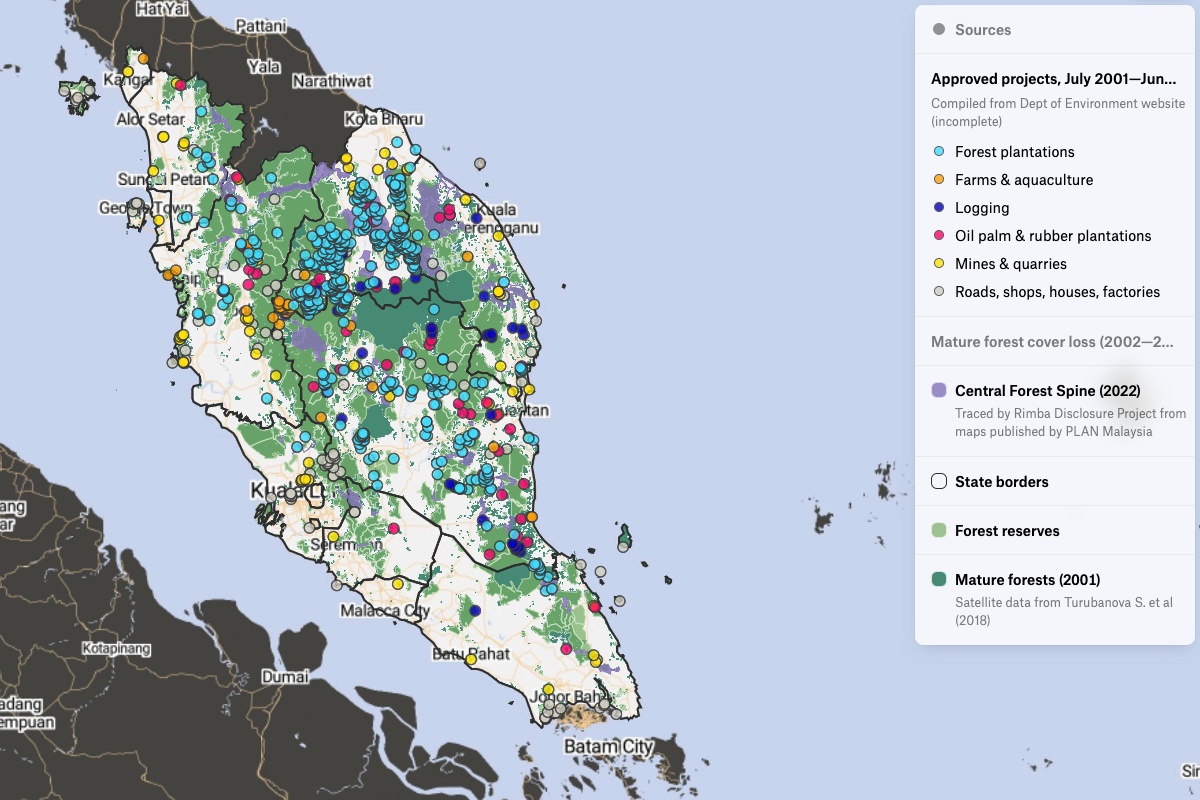
Investigative Journalism: Malaysian Deforestation
Macaranga, a Malaysian publication about sustainability, leveraged Felt to produce an interactive maps about deforestation using data from Department of Environment and Global Forest Watch.
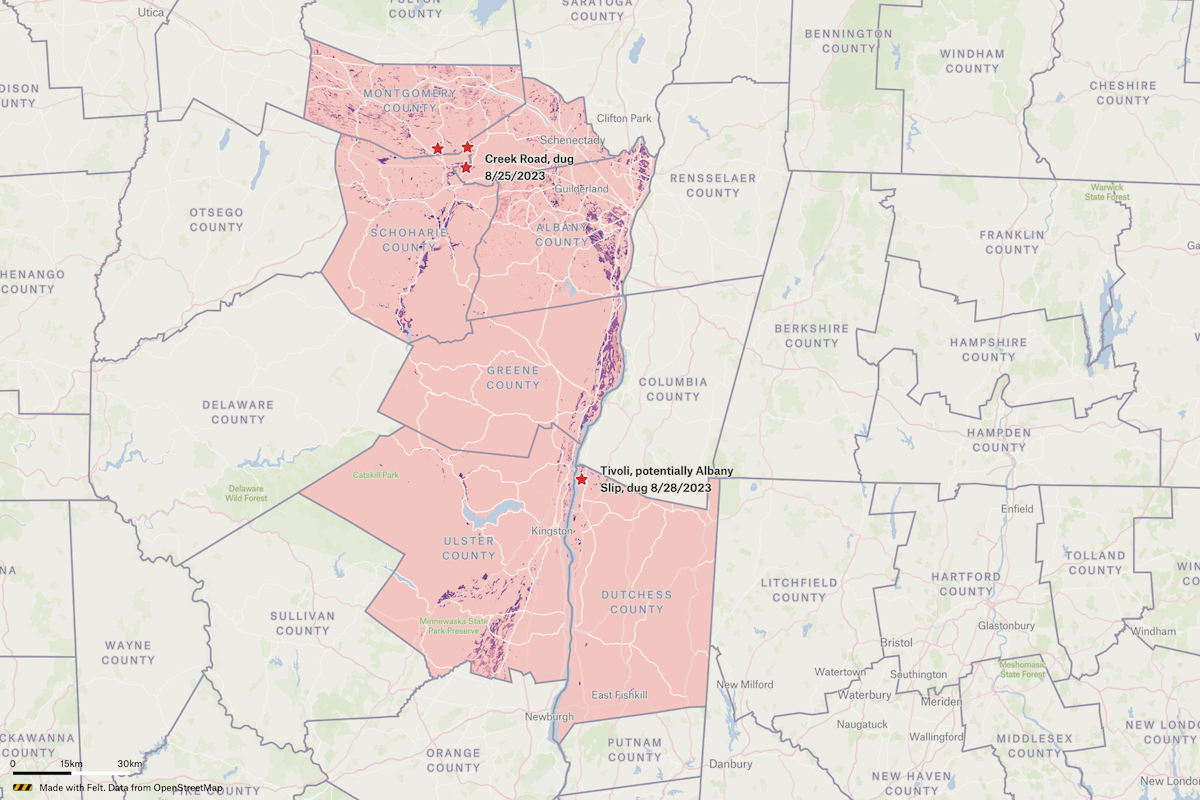
New York Clay Soil Composition
This interactive map created by cartographer and ceramicist Hayley Cranberry shows the clay percentages of soil in several counties in the Hudson Valley region of upstate New York. Soil compsition must be 40% or more of clay texture to be considered clay.
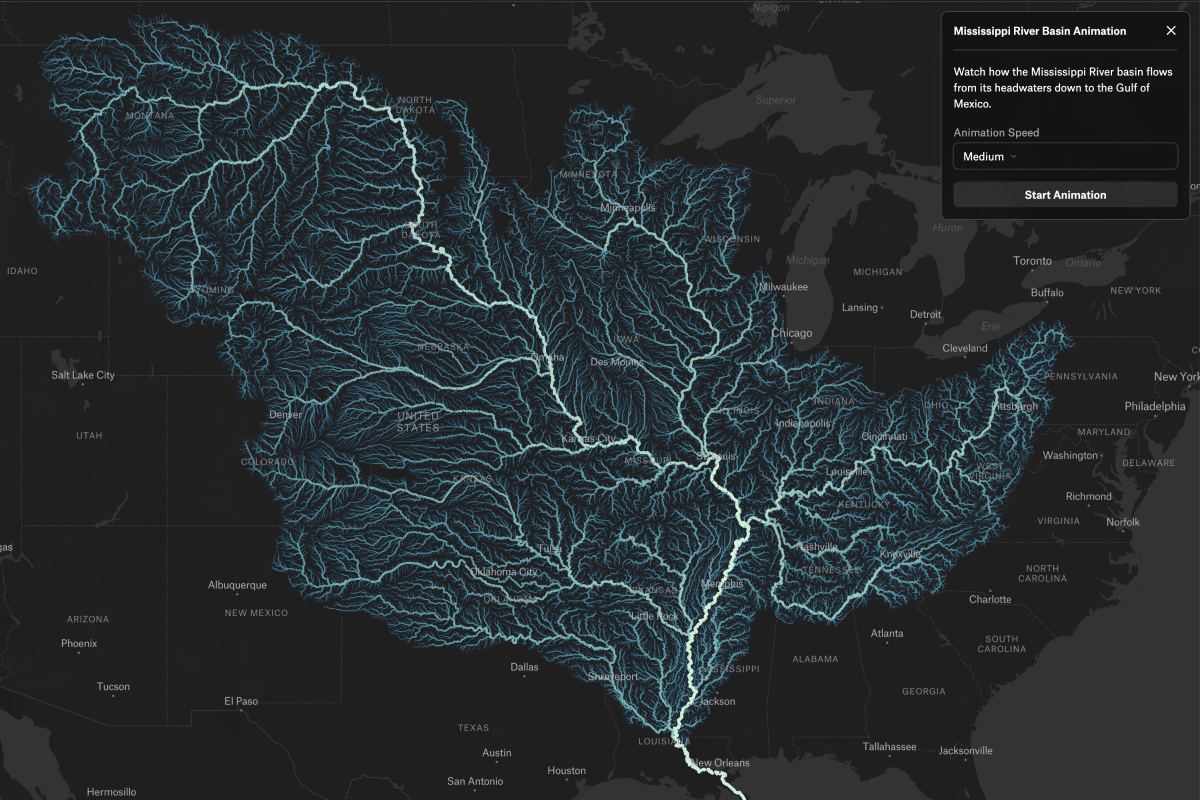
Mississippi Basin Animation
Watch rivers across the Mississippi River Basin animate downstream toward the Gulf of Mexico
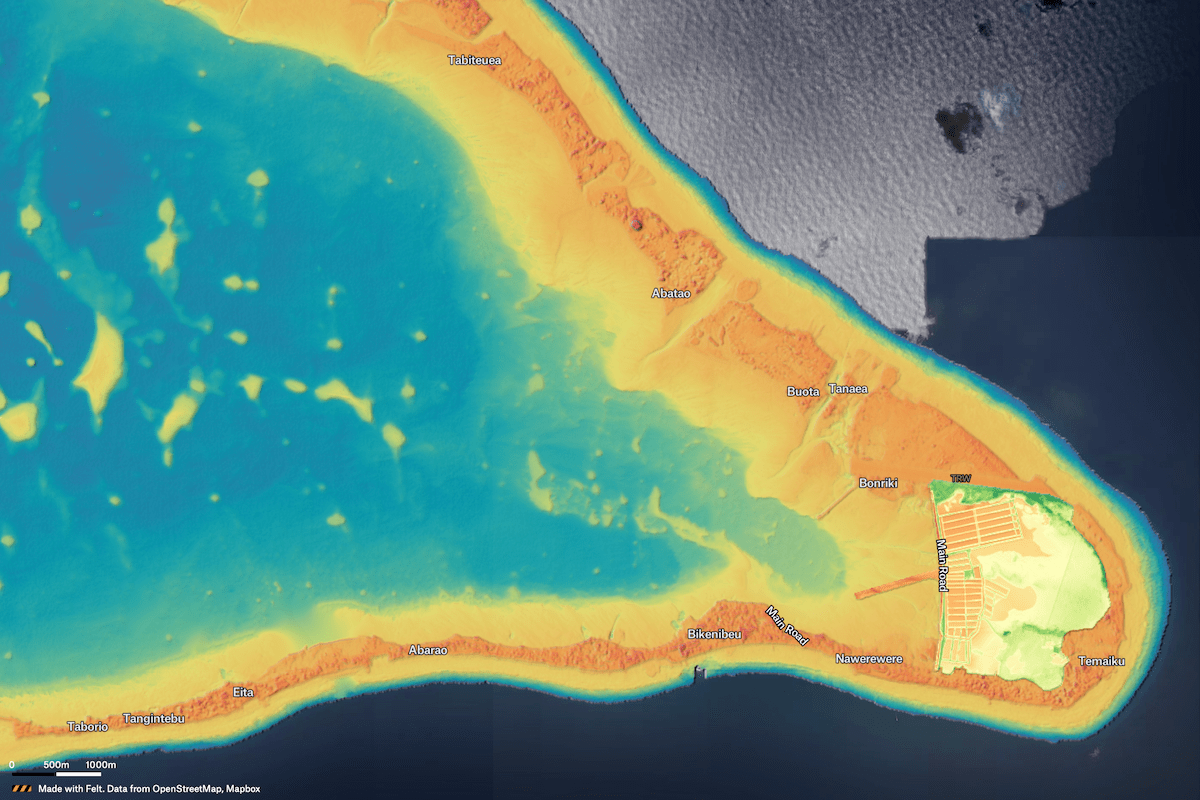
Oceania Satellite Terrain & Bathmetric Mapping
Terrabotics, working for Jacobs Engineering New Zealand, rapidly and accurately surveyed the land topography and shallow water bathymetry around the South Tarawa and Temaiku island atoll, part of the Kiribati Pacific Island nation. Kiribati is threatened by sea level changes, and this project served to help planning for climate resilience programmes on the island. The results were presented to the UN and at COP23.
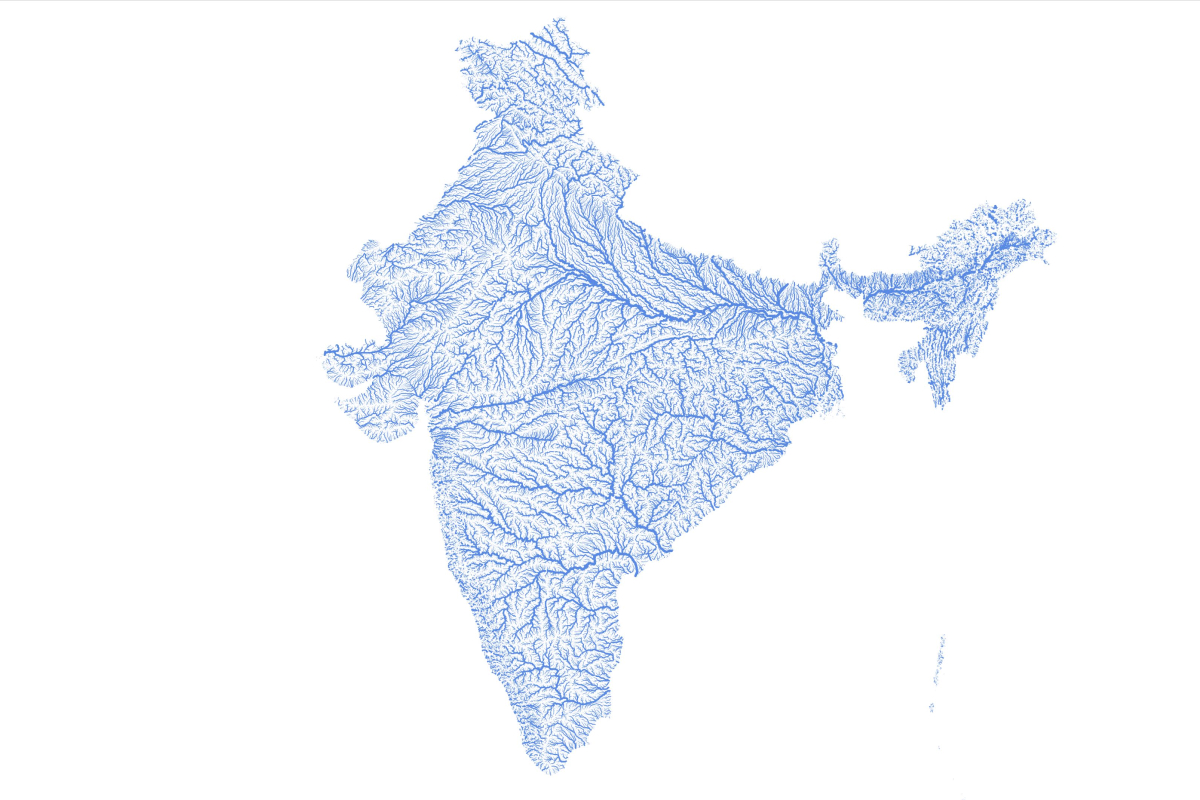
Rivers of India
India’s complex river network utilizing Felt's size-by-value visualization type.
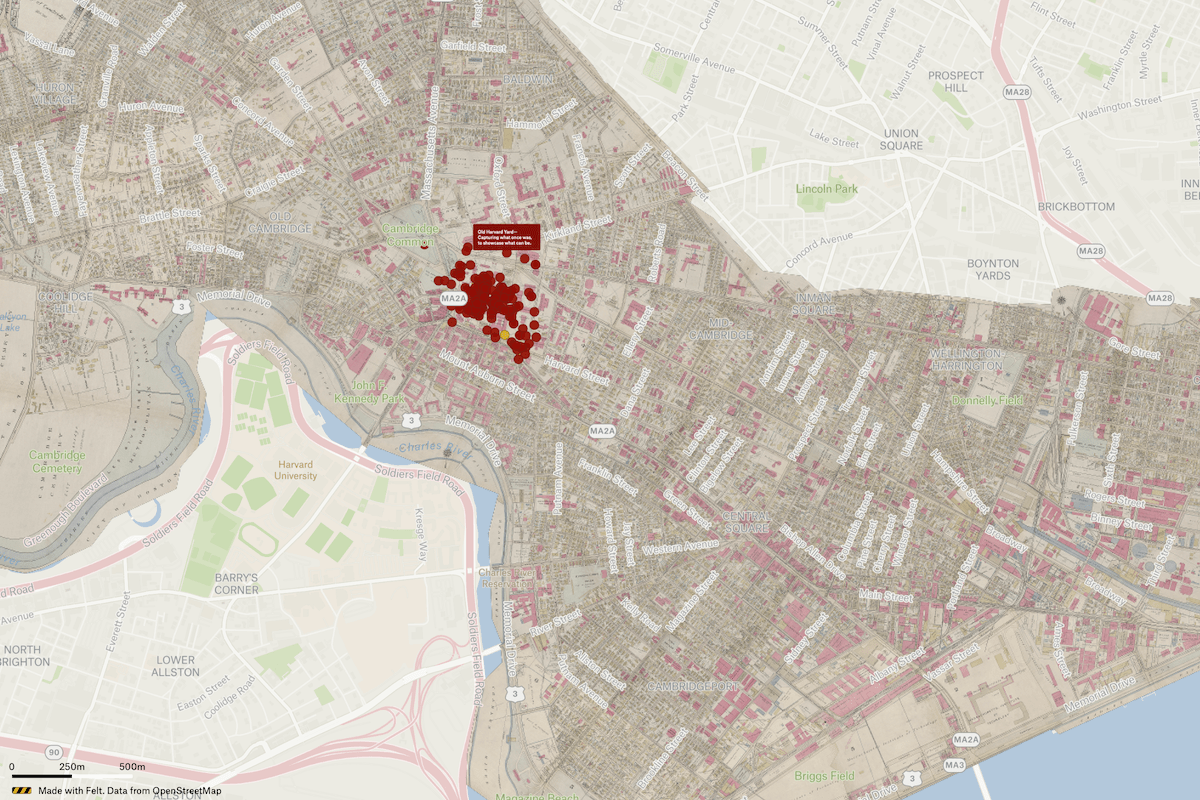
Historical Biodiversity at Harvard University
The Harvard Map Collection partnered with professor Joyce Chaplin and her students on an effort to understand historical biodiversity as they seek to re-wild spaces on campus. The project compares historical and contemporary images of Harvard Yard, revealing that despite its seemingly timeless appearance, many of its iconic features, including trees and buildings like Widener Library, are relatively recent additions from the early 20th century. This challenges the perception of Harvard Yard as an unchanging space and raises questions about potential future transformations of the landscape.
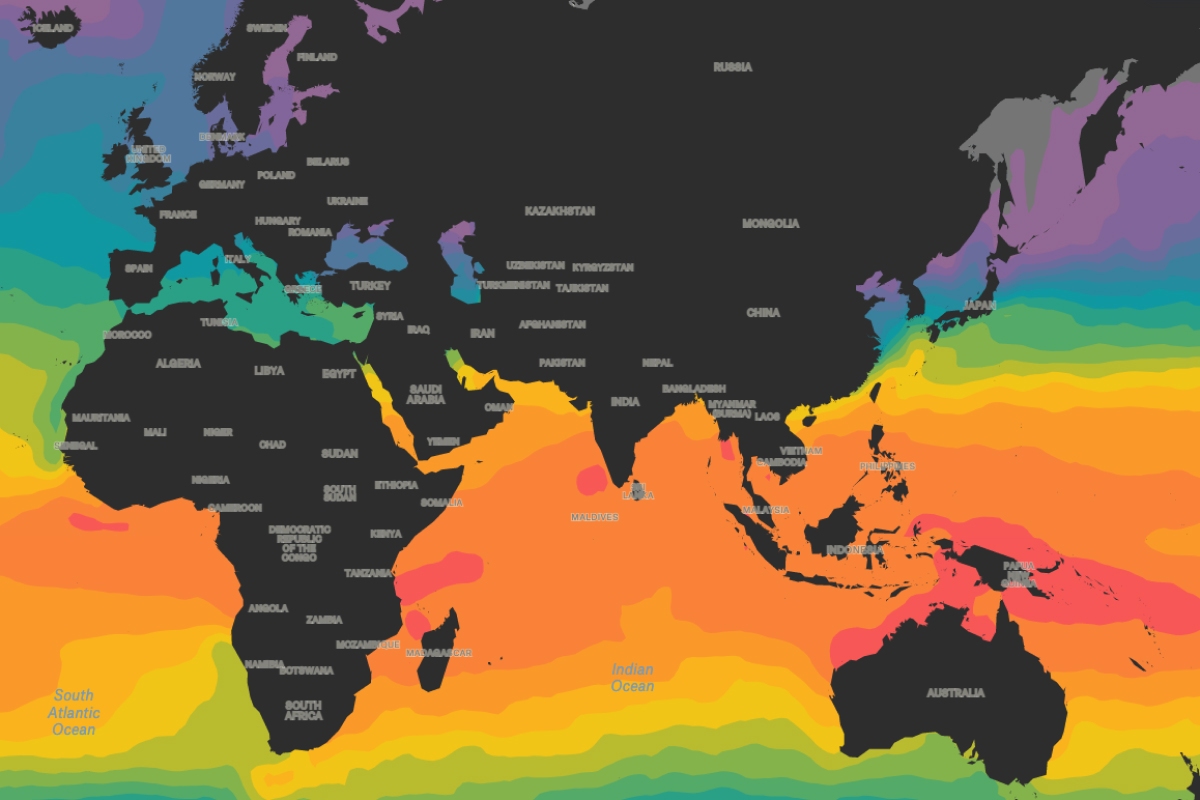
Sea Surface Temperatures
Sea surface temperature the week of September 4, 2022.
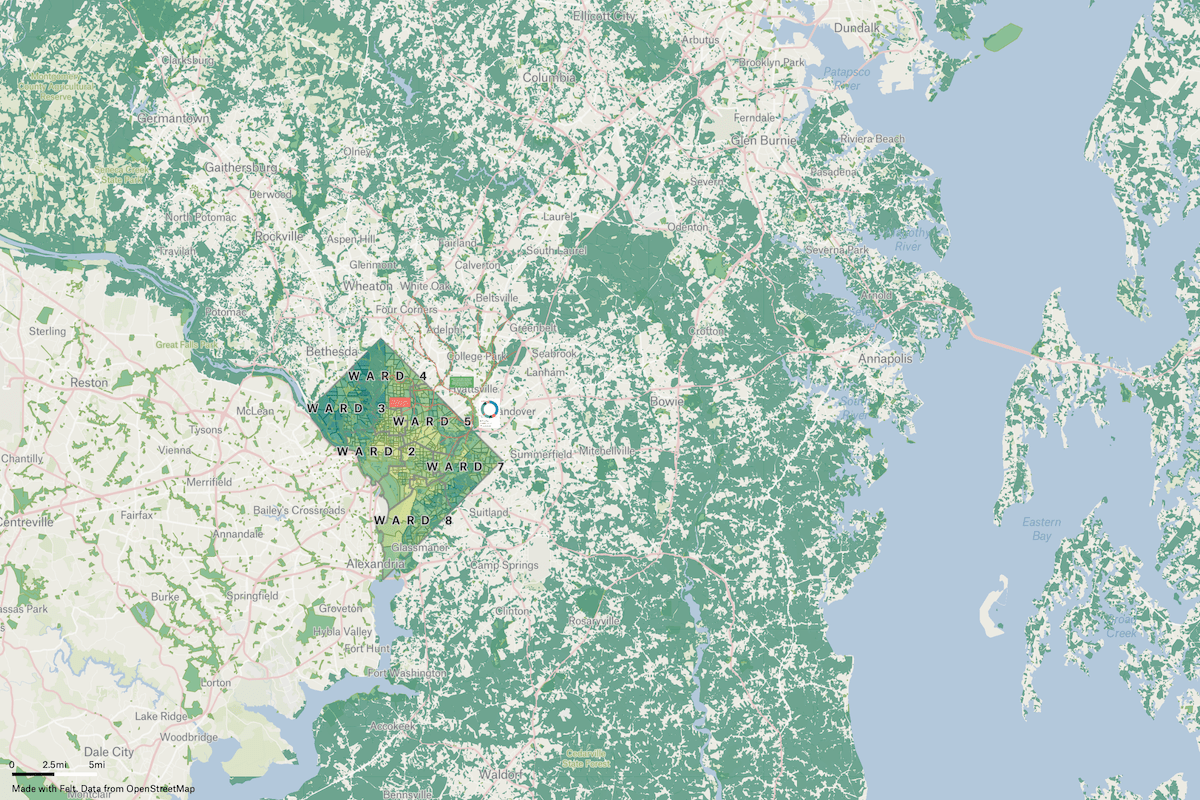
Woodlands and Wildlife Impact in D.C.
A detailed map of individual tress organized by height (points), and tree density (heat map) in Washington D.C. showcasing how wooded areas provide critical corridors for wildlife to enter Northeast D.C. from surrounding river systems.
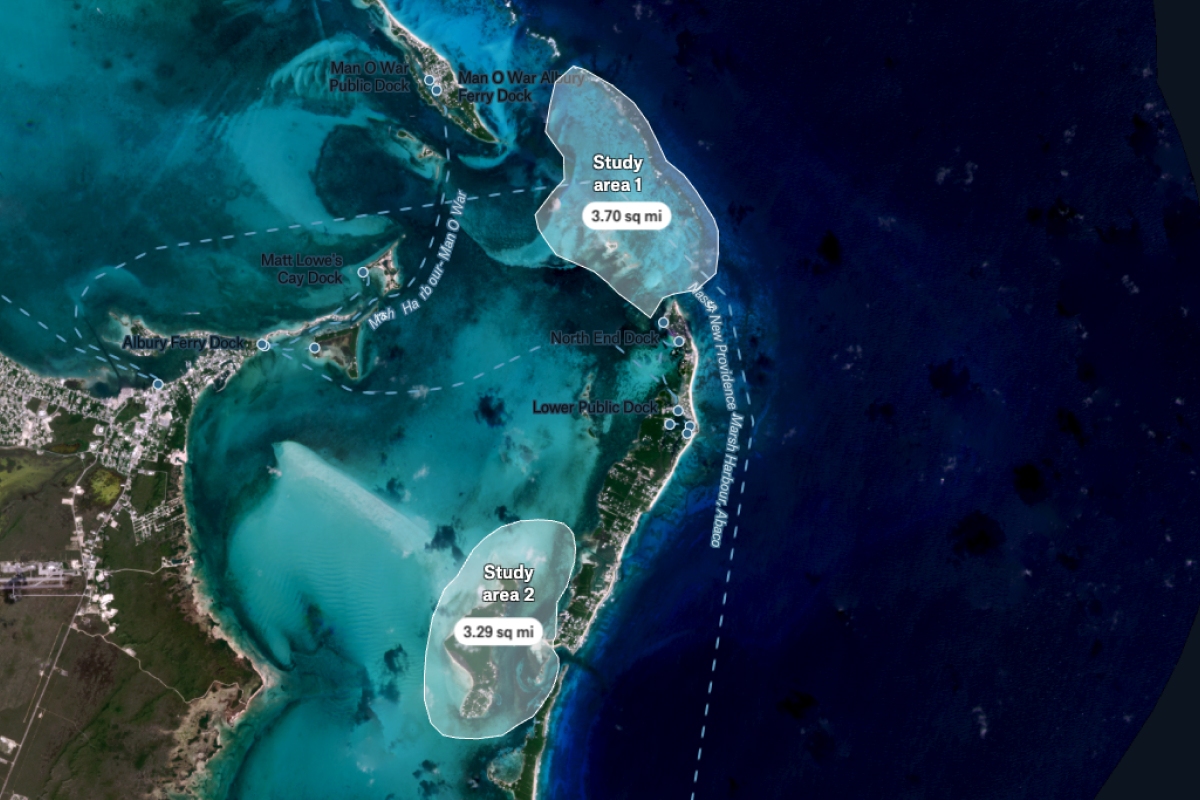
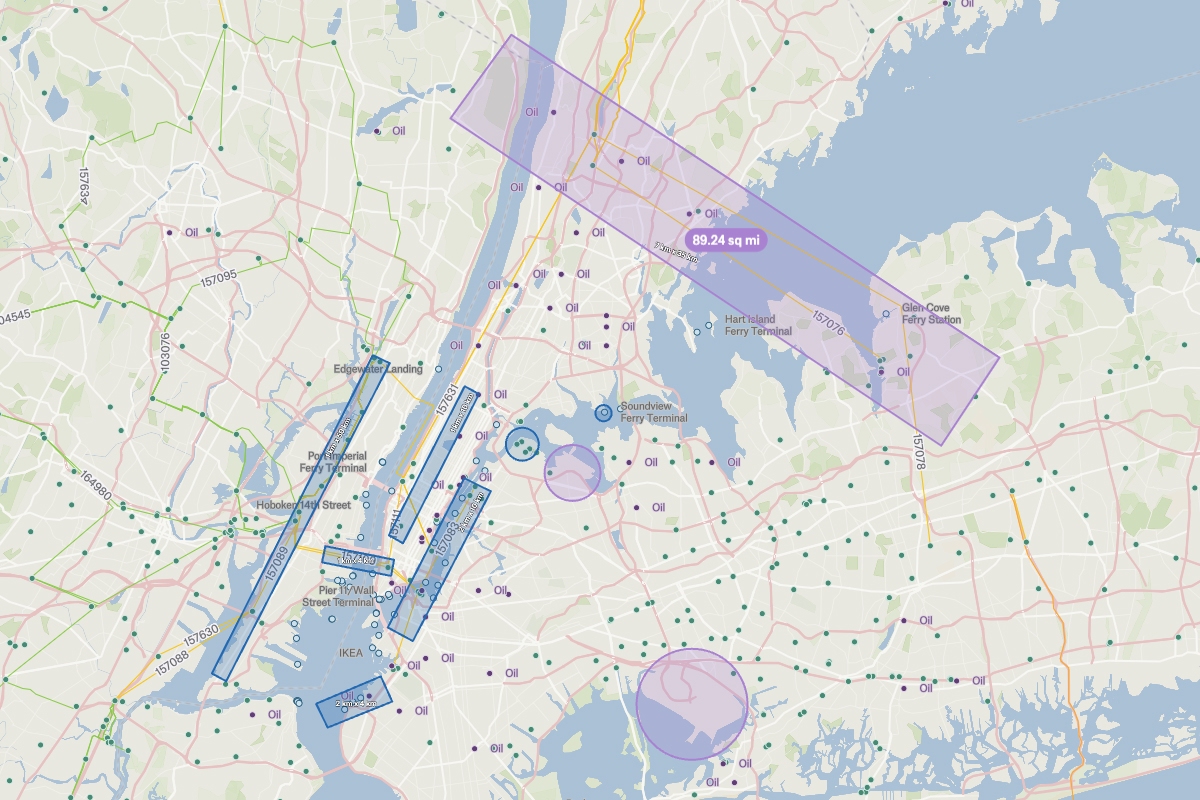
Planet Imagery Study Area
Study area drawn on top of high-resolution Planet imagery.
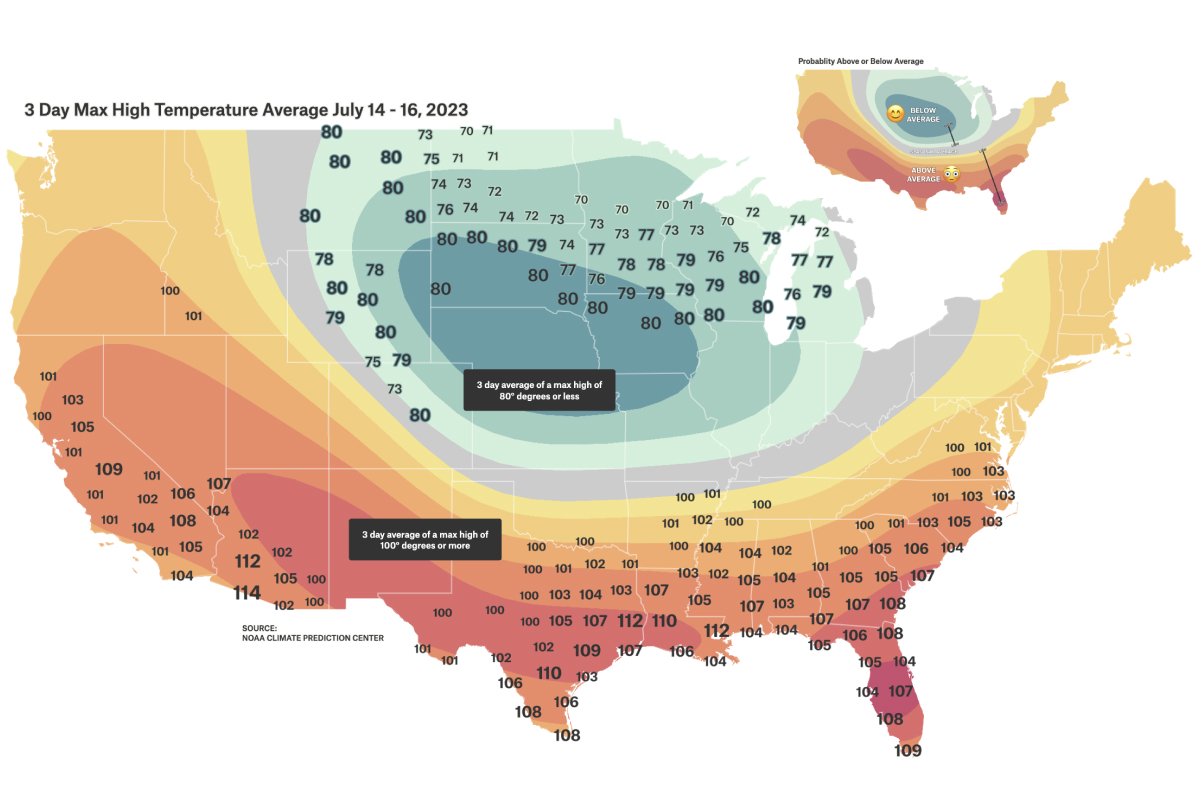
3 Day Average Heat Index
This map shows average three day maximum highs above 100 degrees in areas that were predicted to be above normal temperatures and highs below 80 degrees in areas predicted to be below normal temperatures.
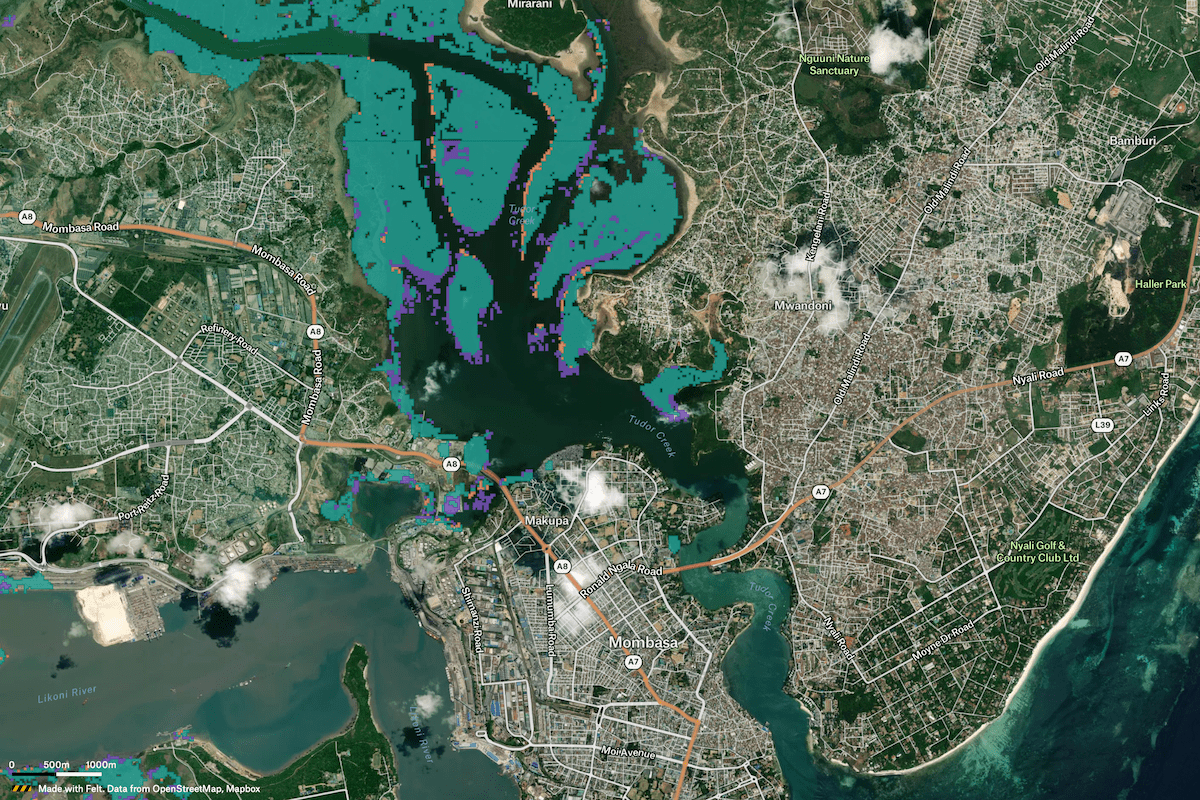
African Mangrove Population Study
Economic R&D firm Beard Labs built a visualization of mangrove coverage and loss in Kenya and Somalia to monitor population trends for their clients.
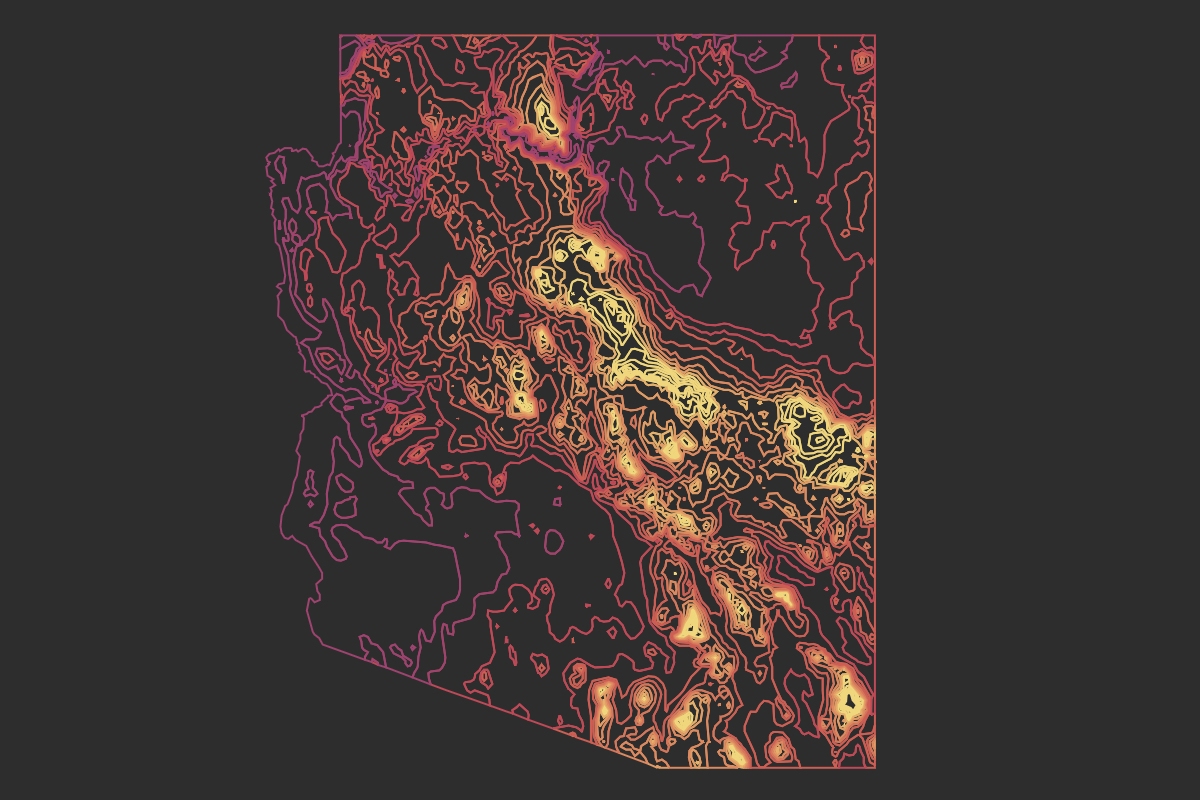
Arizona Precipitation
The average annual inches of precipitation in the state of Arizona.
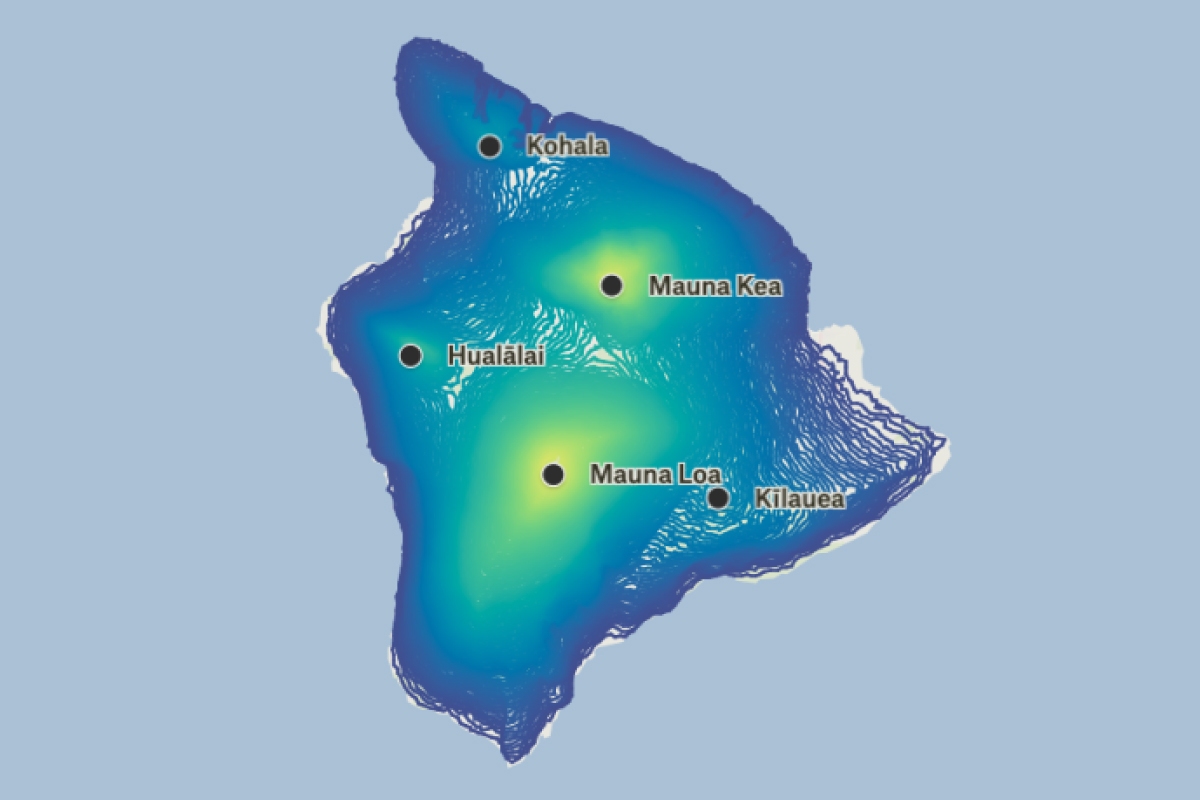
Hawai'i Elevation
The contours of the Island of Hawai'i displayed using continuous interpolation.
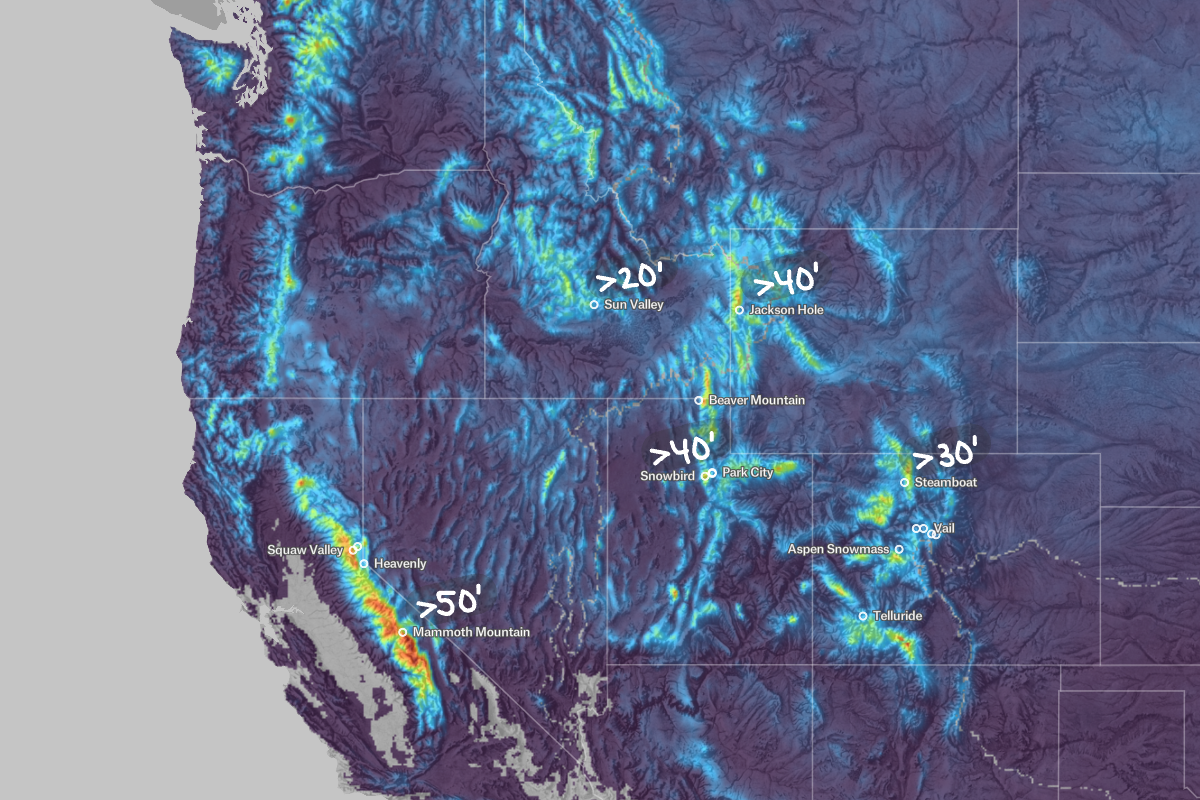
NOAA Seasonal Snow Accumulations
Combine rasters to achieve cartographic affects, like this map of NOAA’s September-April 2023 cumulative snowfall raster over Richard Edes Harrison shaded relief.
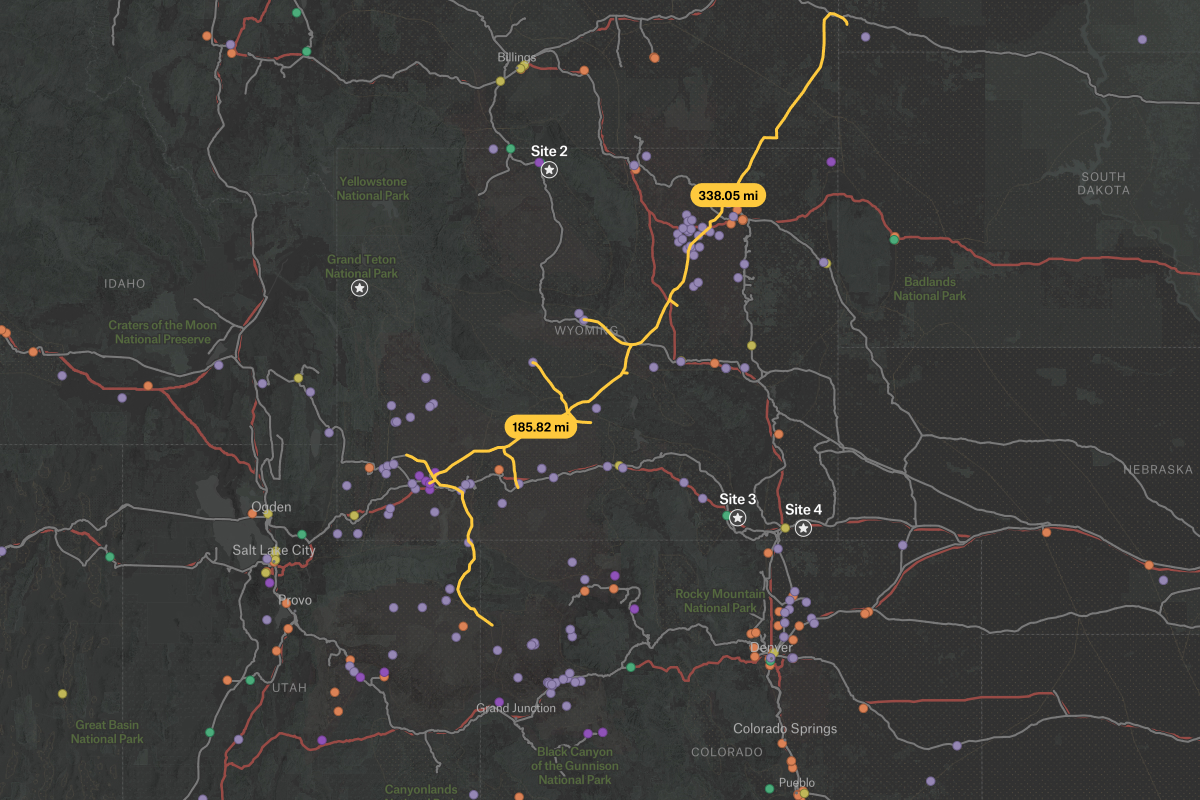
Satellite Imagery Sizing
Specific imagery locations to be captured by satellites.
Categories
Agriculture
Cities and government
Climate and natural resources
Emergency response
Energy and utilities
Exploration
Finance
Insurance
Planning
Real estate
Spatial intelligence
Telecom
Transportation