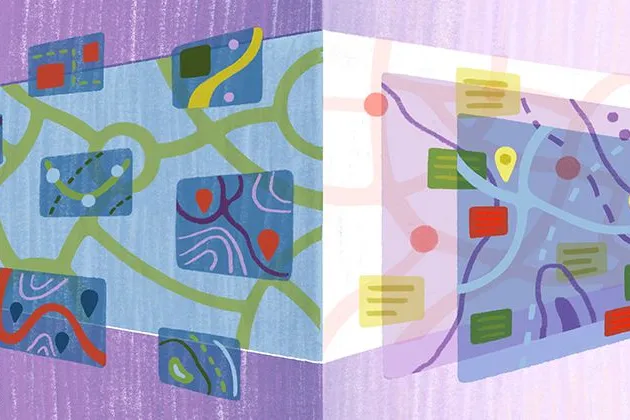
From SVG to Canvas – part 1: making Felt faster
Switching from SVG to Canvas keeps Felt maps performant as our users zoom and pan around their data-rich maps.

Graceful startup and shutdown for Phoenix applications
A quick guide for running a Graceful Shutdown process in your Phoenix application, ensuring clean process termination and minimizing downtime during deployments.
April spotlight: 10 best Felt Community maps
Here is how Felts were putting maps to use lately — from trying out new raster imagery features to locating best biking routes in Hungary.
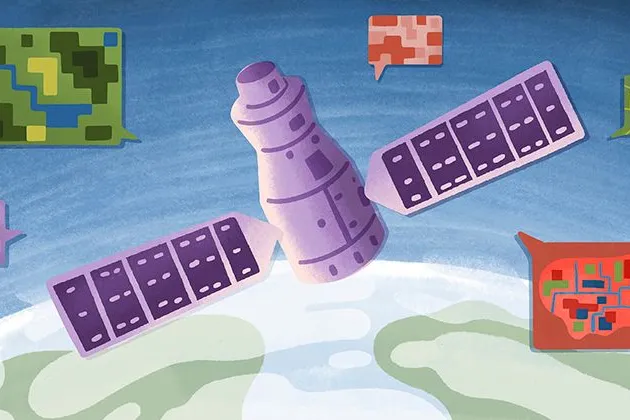
GeoTIFFs, XYZ urls, and raster imagery – now in Felt
Felt’s collaborative modern map-making platform now works for raster files. Try it today.

Routing patterns for manageable Phoenix Channels
There are unique challenges that arise when you’re building a huge Phoenix Channel, and in this post we’re going to explore some solutions.
March spotlight: 10 best Felt Community maps
Here is how Felts were putting maps to use lately — from locating cherry blossoms in Korea to visualizing every street in London by its width.

Modern client collaboration: Alta Planning + Design case study
Alta Planning+Design, a leading consulting firm specializing in bicycle and pedestrian planning, is using Felt to bring their clients a more modern mapping experience.
Creating maps on the web with QGIS & Felt
Many users prepare data in QGIS before styling and sharing in Felt. Here are some of the ways they are leveraging this combo to create beautiful maps on the web.
Monthly spotlight: 10 best Felt Community maps
Here is how Felts were putting maps to use lately — from mapping world’s electric battery gigafactories to investigating whale strandings on the East Coast.
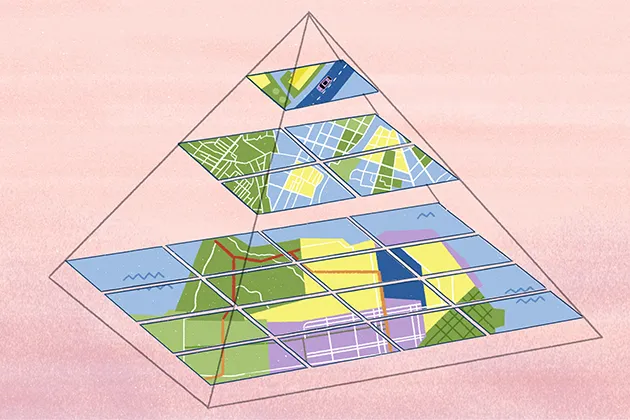
Felt renders faster than ever with MapLibre
When trying Felt 1.0 for the first time, users will immediately notice that it feels different...
January spotlight: 10 best Felt community maps
Here is how Felts were putting maps to use in January — from tracking Indigenous territories, treaties, and languages to visualizing Czech Presidential Election results.
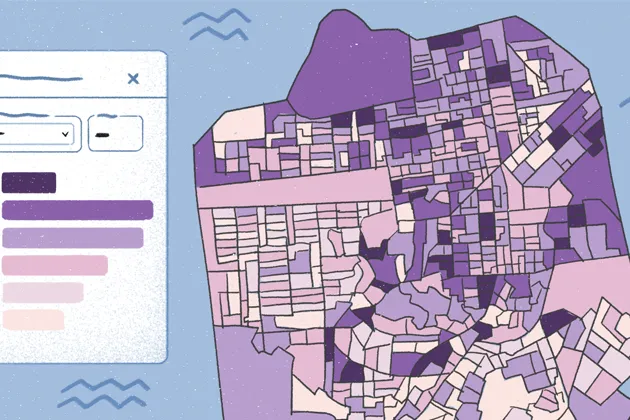
Beautiful new ways to visualize data in Felt
Drag and drop your numeric data into Felt and watch it appear as an informative, beautiful visualization.
Bring your data, see it on the map
Connect a database or drop in a file and see your data live on a map in minutes.