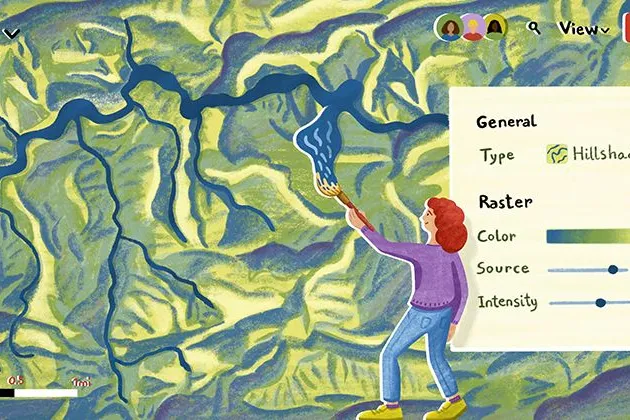
Dynamic styling, hillshades, & raster algebra – Felt’s new raster rendering engine
Felt is on a mission to make mapping effortless for everyone — from pros to the people who work alongside them.
Deploying more, stressing less: how Felt achieves 15+ daily releases
Felt is the best place to make maps on the web, and a big part of our magic is the speed of our maps.
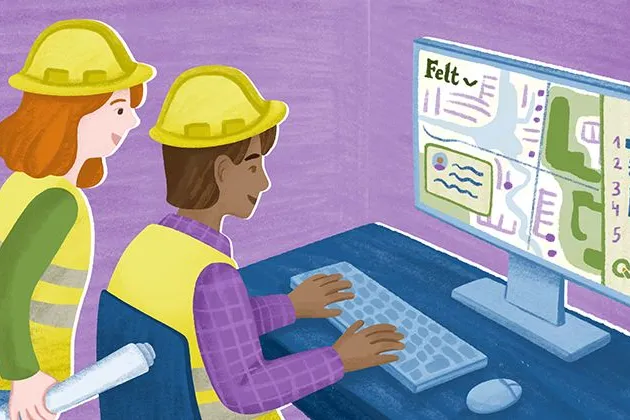
How one engineering firm streamlined client feedback with the 'Add to Felt' QGIS plugin
ICON Engineering, Colorado-based firm specializing in stormwater and transportation engineering, is leveraging Felt and QGIS for getting stakeholder feedback faster.
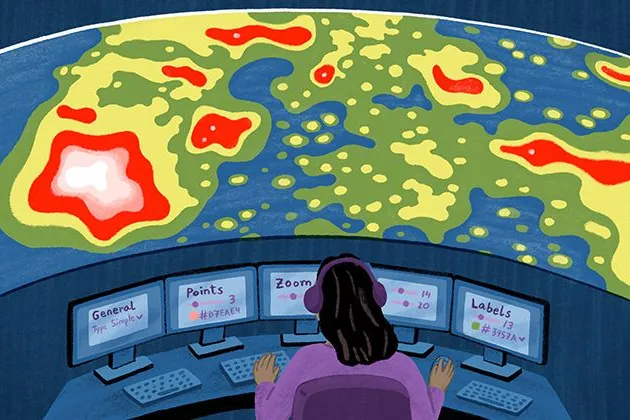
Introducing powerful new cartographic design tools, including heat maps
The most powerfully intuitive cartographic toolkit on the internet has arrived.
July spotlight: 10 best Felt Community maps
Here is how Felts put maps to use lately — from Barbenheimer history to visualizing Overture Maps Foundation data.
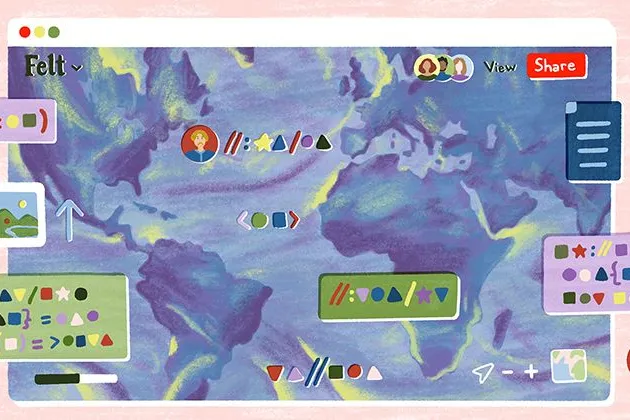
Visualizing weather data using the Felt API
Here is how you can leverage Felt API to create beautiful cartographic visualizations of data from The National Oceanographic and Atmospheric Administration (NOAA).
June spotlight: 10 best Felt Community maps
Here is how Felts put maps to use lately — from combining all the Tour de France races in one place to trying out new Open in Felt feature.

Felt for advocacy groups: mapping traffic violence in Oakland
Bryan Culbertson and Kuan Butts, two activists working on Traffic Violence Rapid Response, leverage Felt maps to advocate for safer streets in Oakland.
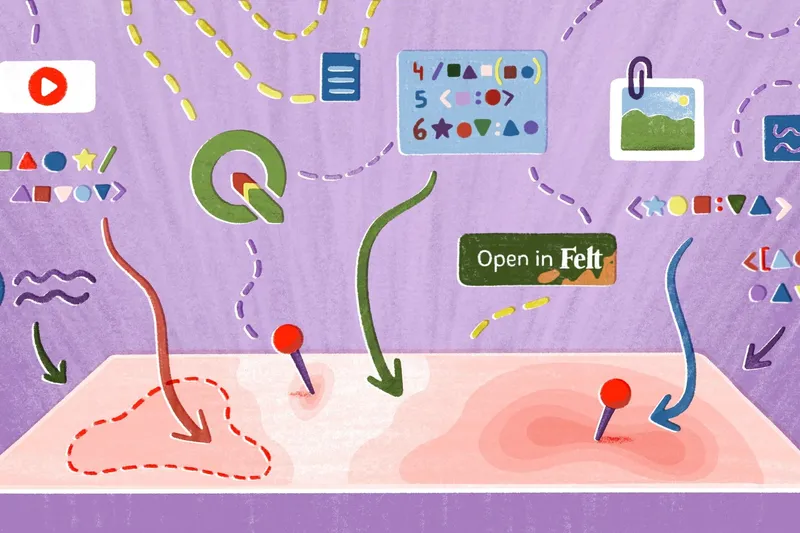
Easily bring data to Felt with our QGIS plugin and the Felt API
Creating collaborative maps is now even faster, with three new ways to bring data directly into Felt: a QGIS plugin, Open in Felt buttons, and the Felt API.
May spotlight: 10 best Felt Community maps
Here is how Felts were putting maps to use lately — from visualizing the impact of wildfires across the West to tracking air pollution in London.
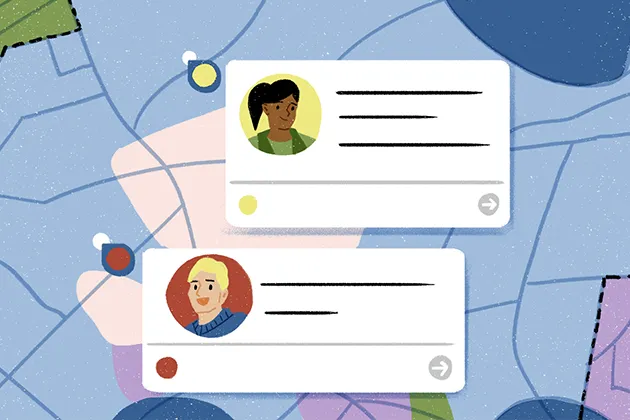
Powerful conversations in Felt: Comments, Public Feedback, and Grouping
Mapping deserves to be a team sport. That’s why we are launching comments, public feedback, and grouping.
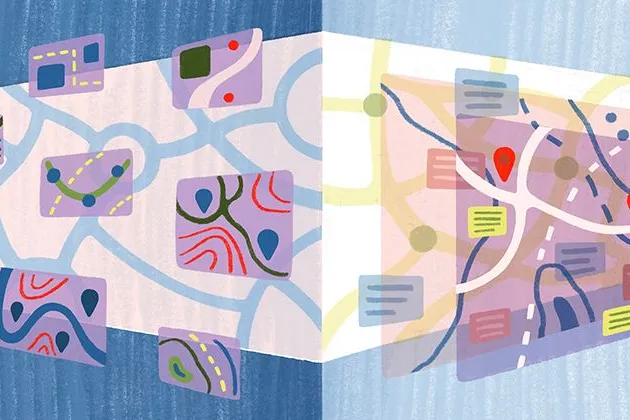
From SVG to Canvas – part 2: a new way of building interactions
While the DOM and React give you a lot of useful tools “for free”, that easy on-ramp starts to get very steep as you try to add more complex interactions.
Bring your data, see it on the map
Connect a database or drop in a file and see your data live on a map in minutes.